. 2020 Apr 22;10(1):6827.
doi: 10.1038/s41598-020-63602-7.

Establishment of macaque trophoblast stem cell lines derived from cynomolgus monkey blastocysts

Affiliations

Establishment of macaque trophoblast stem cell lines derived from cynomolgus monkey blastocysts

Shoma Matsumoto et al. Sci Rep. .

Abstract

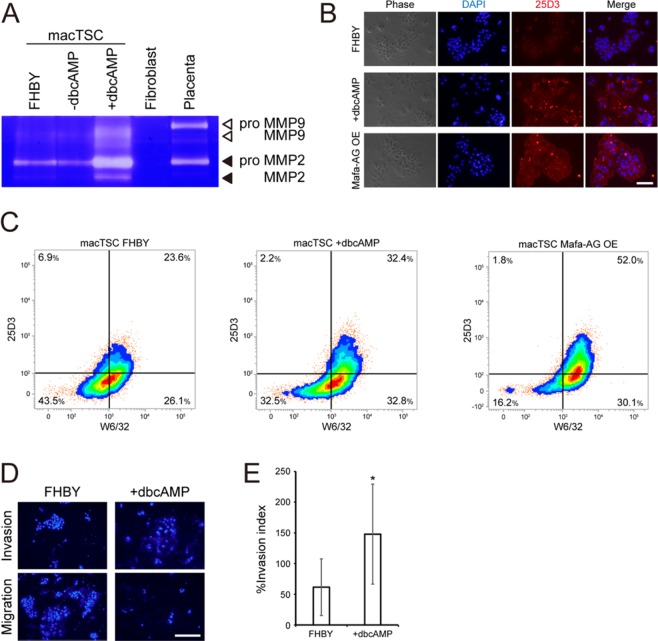
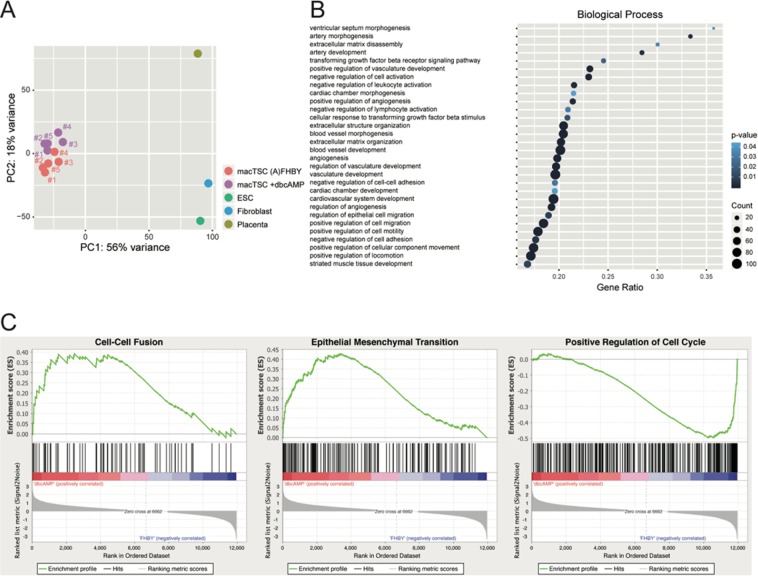
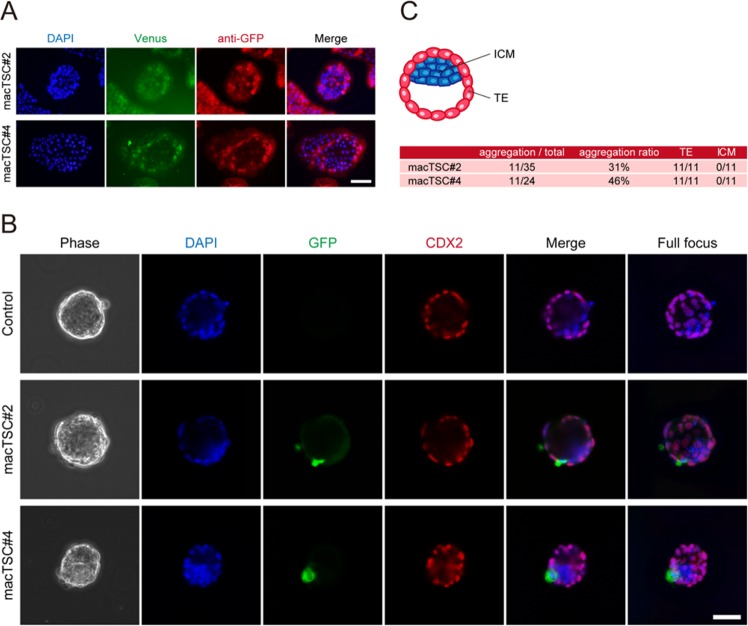
The placenta forms a maternal-fetal junction that supports many physiological functions such as the supply of nutrition and exchange of gases and wastes. Establishing an in vitro culture model of human and non-human primate trophoblast stem/progenitor cells is important for investigating the process of early placental development and trophoblast differentiation. In this study, we have established five trophoblast stem cell (TSC) lines from cynomolgus monkey blastocysts, named macTSC #1-5. Fibroblast growth factor 4 (FGF4) enhanced proliferation of macTSCs, while other exogenous factors were not required to maintain their undifferentiated state. macTSCs showed a trophoblastic gene expression profile and trophoblast-like DNA methylation status and also exhibited differentiation capacity towards invasive trophoblast cells and multinucleated syncytia. In a xenogeneic chimera assay, these stem cells contributed to trophectoderm (TE) development in the chimeric blastocysts. macTSC are the first primate trophoblast cell lines whose proliferation is promoted by FGF4. These cell lines provide a valuable in vitro culture model to analyze the similarities and differences in placental development between human and non-human primates.


Conflict of interest statement

The authors declare no competing interests.

Figures

Figure 1
Figure 1
Establishment of cynomolgus monkey trophoblast stem cell lines (macTSC) from blastocysts. (A) Schematic representation of the cell culture conditions and experimental procedure. Blastocysts #1-3 were initially co-cultured with mouse embryonic fibroblasts (MEF) that was substituted by 50 or 70% MEF-conditioned medium (50CM, 70CM) as indicated after the first passage. Abbreviations of the exogenously added reagents are shown. The other two blastocysts (#4 and #5) were cultured without MEF in the TS medium supplemented with FHBY. The fat arrow-like shapes depict each passage. (B) The appearance of the obtained cell line macTSC#2. Scale bar = 100 µm. (C) Growth of macTSC#2 cells over 132 days (from passage number 6 to 39) of culture in the AFHBY condition. At each passage, cells were harvested, counted, and seeded at 1 × 10⁵ per 35-mm dish in triplicate. A mean value of triplicate was used to calculate the theoretical cumulative number. (D) Growth of macTSC#2 cells in different culture conditions. The number of cells normalized to that at day 0, and arbitrarily set as 1. The mean values (±SD) of triplicates of biological duplicates are shown. Statistical analysis was done by the Tukey-Kramer test.
Figure 2
Figure 2
Characterization of macTSC#2 by DNA methylation profile. (A and B) DNA methylation status of ELF5 and OCT4 promoter regions (A) and the T-E T-DMRs (B; CA37, EB41, EG01, FF36, FF46, GC06, HD20, HF01, and OCT4) in macTSC#2, ES cell (ESC) and embryonic fibroblasts of cynomolgus monkey were analyzed by bisulfite sequencing. Open and filled circles represent unmethylated and methylated cytosines, respectively. Overall methylation percentage (the number of methylated CpGs per number of total CpGs) is shown under each part. *p < 0.01 between macTSC#2 and ESC (nonparametric two-tailed Mann-Whitney U-test).
Figure 3
Figure 3
The relative expression levels of five C19MC miRNAs in macTSC#2, brain, kidney, lung, small intestine, embryonic fibroblasts, and placenta of cynomolgus monkey. The mean expression level (±SD) was normalized to that of U6 snRNA. Values of each miRNA in placenta was arbitrary set as 1. *p < 0.05 (technical triplicate). The Tukey-Kramer test was used for statistical analysis.
Figure 4
Figure 4
Gene expression profiling of macTSC lines. (A) Heatmap was drawn by the values of correlation coefficients using the RNA-seq datasets of macTSCs, ESC, fibroblast, and cynomolgus monkey placenta. (B) Enriched GO terms associated with the genes with >2-fold expression in all macTSCs compare to that in ESC. PANTHER (www.pantherdb.org) was used for GO analyses. Gene ratio, the ratio of the analyzed genes in the gene set of the GO term; Count, the number of analyzed genes in the GO term. P-values were calculated using Fisher's exact test with Bonferroni correction. (C,D,E) qRT-PCR for analyzing the expression of CTB (C), STB (D) and EVT (E) markers. The mean values (±SD) of technical replicates for biological duplicates, normalized by the expression of ACTB, were shown relative to those of cells maintained under the FHBY condition (arbitrarily set as 1). −dbcAMP, basal TS medium without FHBY and dbcAMP; +dbcAMP, basal TS medium with 1 mM dbcAMP. *p < 0.05 vs. FHBY (Two-tailed Student's t-test).
Figure 5
Figure 5
Differentiation of macTSC#2 towards multinucleated cells. (A) Fluorescent immunocytochemistry for CG protein. Scale bar = 100 µm. (B) Detection of multinucleated cells by immunofluorescence for E-cadherin and DAPI staining. Arrowheads show multinucleated (≥tri-n ucleated) cells. Scale bars = 40 µm. (C) The fusion index ± SD (%) calculated from four randomly chosen fields each of biological duplicates. Fusion index was calculated by (N-C)/T × 100 (N, nuclei in multinucleated cells; (C) number of multinucleated cells; T, total number of nuclei in a field of microscopic view). (D,E) Measurement of secreted steroid hormones. Progesterone (D) and Estradiol (E) in macTSC#2 culture medium were detected by ELISA (n = 3). *p < 0.05 vs. FHBY (two-tailed Student's t-test).
Figure 6
Figure 6
Differentiation of macTSC#2 toward invasive cells. macTSC#2 cells cultured for six days under the indicated conditions and were subjected to further analysis. (A) Detection of gelatinase activities in macTSC#2 by gelatin zymography. Fibroblast and placenta were used as negative and positive controls, respectively. (B) Fluorescent immunocytochemistry for Mafa-AG protein, a cynomolgus macaque homolog of HLA-G. Mafa-AG was detected by using the 25D3 antibody. A macTSC line overexpressing Mafa-AG protein (Mafa-AG OE) was used as a positive staining control. The high-intensity dots stained by 25D3 antibody were non-specific signals. Scale bar = 100 µm. (C) Flow cytometric analysis. PI staining-positive dead cells were gated out. The thresholds of positive and negative staining were decided using the isotype control antibody of Mafa-AG-overexpressing macTSC#2 (Fig. S5). (D) Cell invasion analysis of macTSC#2 cells. Cells were cultured on the FluoroBlok inserts with (Invasion) or without (Migration) Matrigel coating in the indicated conditions for four days. The nuclei of cells on the lower surface of the inserts were stained with Hoechst 33342 and photographed. The typical images are shown. Scale bar = 50 µm. (E) The invasion index (%) calculated from 835 and 364 total nuclei in FHBY and +dbcAMP conditions, respectively.
Figure 7
Figure 7
The effect of dbcAMP treatment for macTSCs. (A) PCA was performed using RNA-seq data of macTSCs in (A) FHBY and dbcAMP conditions, ESC, fibroblasts, and placenta. (B) Enriched GO terms associated with the genes >2-fold upregulated by the dbcAMP treatment. PANTHER (www.pantherdb.org) was used for GO analyses. Gene ratio, the ratio of the analyzed genes in the gene set of the GO term; Count, the number of analyzed genes in the GO term. P-values were calculated using Fisher's exact test and Bonferroni correction. (C) Gene set enrichment analysis (GSEA) was performed using gene expression data of RNA-seq by GSEA v4.0.3 Mac App from Broad Institute (software.broadinstitute.org/gsea/index.jsp).
Figure 8
Figure 8
Contribution of macTSCs to the xenogeneic chimera blastocysts. (A)  Immunofluorescence images of Venus (modified GFP)-expressing macTSCs. Venus was detected by its fluorescence and by using anti-GFP antibody. Scale bar = 200 µm. (B) Images of xenogeneic chimera blastocysts generated by aggregating macTSC cells and mouse eight-cell embryos, at two days of culture. Scale bar = 50 µm. (C) Locations of Venus-positive cells in the xenogeneic chimera blastocysts.

Similar articles

Cited by

References

    1. James JL, Stone PR, Chamley LW. Cytotrophoblast differentiation in the first trimester of pregnancy: evidence for separate progenitors of extravillous trophoblasts and syncytiotrophoblast. Reproduction. 2005;130:95–103. doi: 10.1530/rep.1.00723. - DOI - PubMed
    1. Gamage TK, Chamley LW, James JL. Stem cell insights into human trophoblast lineage differentiation. Hum. Reprod. Update. 2016;23:77–103. doi: 10.1093/humupd/dmw026. - DOI - PubMed
    1. Kliman HJ, Nestlert JE, Sermasi E, Sanger JM, Purification JFS., III. characterization, and in vitro differentiation of cytotrophoblasts from human term placentae. Endocrinology. 1986;118:1567–1582. doi: 10.1210/endo-118-4-1567. - DOI - PubMed
    1. Graham CH, et al. Establishment and characterization of first trimester human trophoblast cells with extended lifespan. Experimental Cell Research. 1993;206:204–211. doi: 10.1006/excr.1993.1139. - DOI - PubMed
    1. Weber M, Knoefler I, Schleussner E, Markert UR, Fitzgerald JS. HTR8/SVneo cells display trophoblast progenitor cell-like characteristics indicative of self-renewal, repopulation activity, and expression of “stemness-” associated transcription factors. Biomed Res. Int. 2013;2013:1–10. doi: 10.1155/2013/243649. - DOI - PMC - PubMed

Publication types

MeSH terms