

Continuous Hypodynamic Change of Cerebrospinal Fluid Flow as A Potential Factor Working for Experimental Scoliotic Formation
- PMID: 32321986
- PMCID: PMC7176657
- DOI: 10.1038/s41598-020-63822-x
Continuous Hypodynamic Change of Cerebrospinal Fluid Flow as A Potential Factor Working for Experimental Scoliotic Formation
Abstract
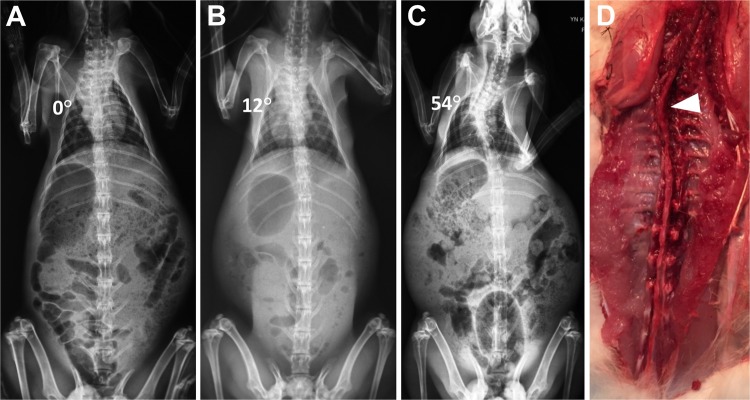
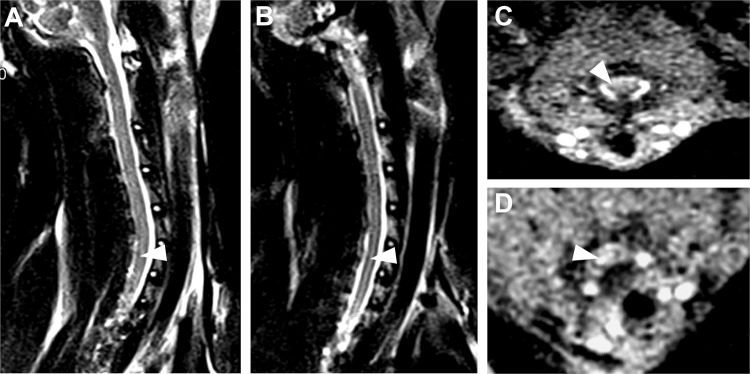
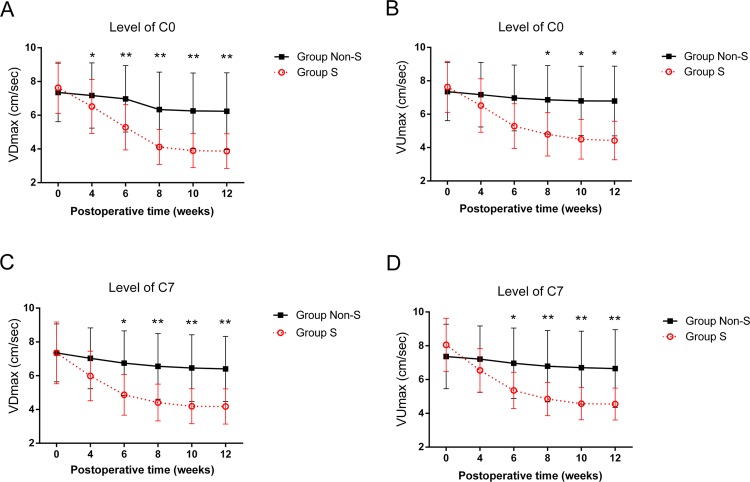
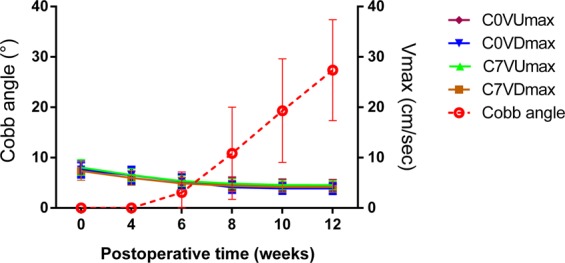
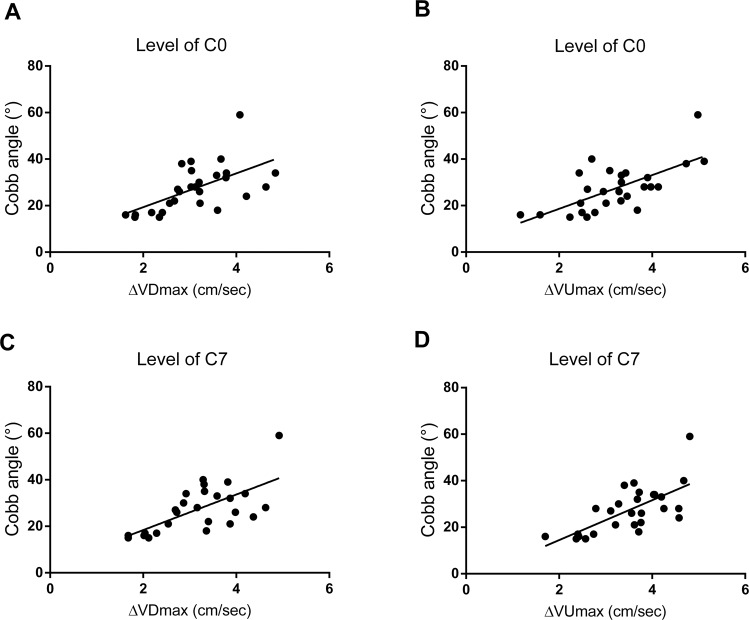
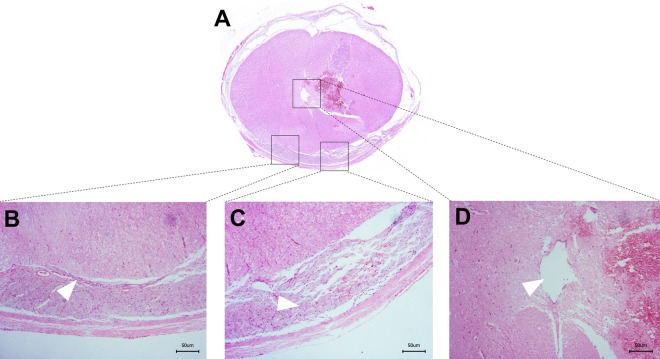
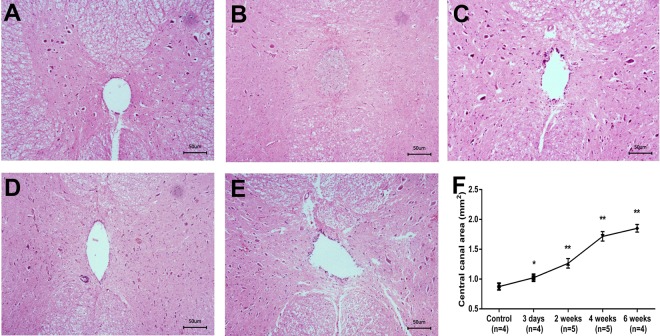
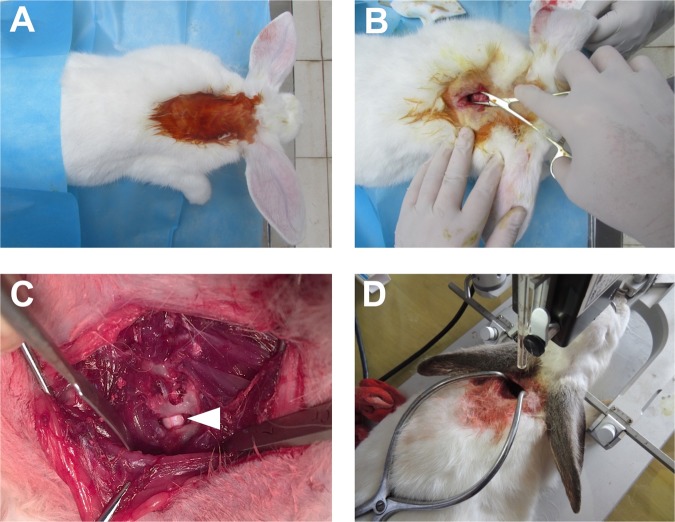
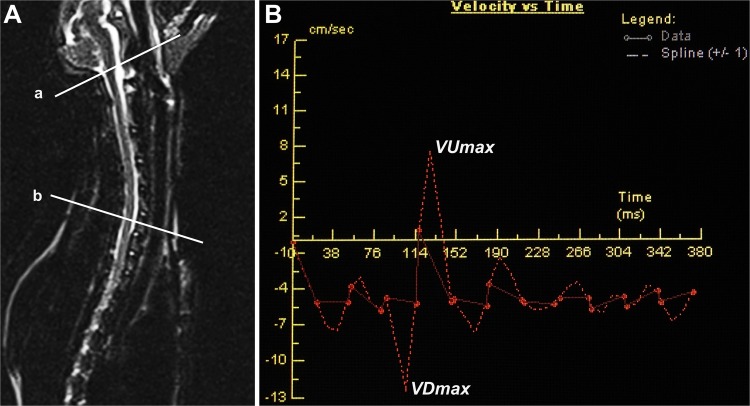
Scoliosis is often associated with syringomyelia (SM). As an important role in SM formation, the influence from abnormal cerebrospinal fluid (CSF) flow is still unclear to scoliosis. The aim of this experimental work is to explore the connection between CSF flow and scoliosis through imaging and histological analysis on the basis of a kaolin-induced scoliotic rabbit model. For imaging observation, in 40 kaolin-induced rabbits by C7 spinal cord injection, through pre- and postoperative MRI and radiography, CSF flow and scoliosis formation were detected at consecutive phases. According to the final formation of scoliosis until postoperative week 12, the kaolin-induced rabbits were divided into 2 groups. Through comparing the 2 groups, the relationship between the changes of CSF flow velocity and scoliosis formation were reviewed and analyzed. For histological observation, another 20 kaolin-induced rabbits were used for consecutive histological observations of spinal cord at postoperative 3-day, 2-week, 4-week and 6-week. After kaolin-induction, abnormal spinal coronal curve was observed from postoperative week 6 in the 37 survived rabbits. At postoperative week 12, scoliosis formation was detected in 73.0% kaolin-induced rabbits and the mean Cobb angle was 27.4°. From the comparison between scoliotic and non-scoliotic groups, the difference of the velocities of CSF flow was more obviously from postoperative week 4 to 12, especially after week 6. In the scoliotic group, the peak velocity of CSF flow was diseased gradually following scoliosis formation after induction. Moreover, the decrease of the peak velocities of CSF flow from preoperation to postoperative 12 weeks (ΔVmax), including up-flow (ΔVUmax) and down-flow (ΔVDmax), were positively correlated to the final scoliotic Cobb angle (P < 0.01). Through histological observation at different phases, the distinctive pathological changes of the spinal cord included early inflammatory reaction, adhesion and blockage in the subarachnoid space and the central canal, perivascular space enlargement, central canal expansion, which suggested the CSF flow being blocked by multiple ways after kaolin-induction. In conclusion, experimental scoliosis can be successfully induced by intraspinal kaolin injection. In this model, continuous hypodynamic change of CSF flow was correlated to the formation of scoliosis, which could be an important factor of scoliotic pathogenesis being explored furtherly.
Conflict of interest statement
The authors declare no competing interests.
Figures
Similar articles
-
Chronic changes in cerebrospinal fluid pathways produced by subarachnoid kaolin injection and experimental spinal cord trauma in the rabbit: their relationship with the development of spinal deformity. An electron microscopic study and magnetic resonance imaging evaluation.Neurosurg Rev. 2005 Oct;28(4):289-97. doi: 10.1007/s10143-005-0391-8. Epub 2005 Jun 2. Neurosurg Rev. 2005. PMID: 15931513
-
Cerebrospinal fluid flow in an animal model of noncommunicating syringomyelia.Neurosurgery. 1999 May;44(5):1065-75; discussion 1075-6. doi: 10.1097/00006123-199905000-00068. Neurosurgery. 1999. PMID: 10232540
-
Changes in CSF flow after one-stage posterior vertebral column resection in scoliosis patients with syringomyelia and Chiari malformation type I.J Neurosurg Spine. 2013 May;18(5):456-64. doi: 10.3171/2013.1.SPINE12366. Epub 2013 Mar 1. J Neurosurg Spine. 2013. PMID: 23452245
-
Correlation of radiographic, clinical, and patient assessment of shoulder balance following fusion versus nonfusion of the proximal thoracic curve in adolescent idiopathic scoliosis.Spine (Phila Pa 1976). 2002 Sep 15;27(18):2013-20. doi: 10.1097/00007632-200209150-00009. Spine (Phila Pa 1976). 2002. PMID: 12634561 Review.
-
The course of sagittal plane abnormality in the patients with congenital scoliosis managed with convex growth arrest.Spine (Phila Pa 1976). 2004 Mar 1;29(5):547-52; discussion 552-3. doi: 10.1097/01.brs.0000106493.54636.b4. Spine (Phila Pa 1976). 2004. PMID: 15129069 Review.
References
-
- Kontio K, Davidson D, Letts M. Management of scoliosis and syringomyelia in children. J. Pediatr. Orthop. 2002;22:771–779. - PubMed
-
- Zhang Y, et al. Intraspinal pathology (ISP) in severe spinal deformity (SSD): a ten-year MRI review, Paper presented at: Scoliosis Research Society 52nd Annual Meeting & Course, Philadelphia, PA (2017).
Publication types
MeSH terms
Substances
LinkOut - more resources
Full Text Sources
Medical
Research Materials
Miscellaneous
