. 2020 Apr;580(7804):517-523.
doi: 10.1038/s41586-020-2209-9. Epub 2020 Apr 15.

Mechanisms and therapeutic implications of hypermutation in gliomas

Mehdi Touat #  1   2   3 Yvonne Y Li #  4   5 Adam N Boynton  4   6 Liam F Spurr  4   5 J Bryan Iorgulescu  5   7 Craig L Bohrson  8   9 Isidro Cortes-Ciriano  10 Cristina Birzu  11 Jack E Geduldig  12 Kristine Pelton  12 Mary Jane Lim-Fat  5   13 Sangita Pal  4   5 Ruben Ferrer-Luna  4   5   14 Shakti H Ramkissoon  14   15 Frank Dubois  4   5 Charlotte Bellamy  12 Naomi Currimjee  5 Juliana Bonardi  12 Kenin Qian  6 Patricia Ho  6 Seth Malinowski  12 Leon Taquet  12 Robert E Jones  12 Aniket Shetty  16 Kin-Hoe Chow  16 Radwa Sharaf  14 Dean Pavlick  14 Lee A Albacker  14 Nadia Younan  11 Capucine Baldini  17 Maïté Verreault  18 Marine Giry  18 Erell Guillerm  19 Samy Ammari  20   21 Frédéric Beuvon  22 Karima Mokhtari  23 Agusti Alentorn  11 Caroline Dehais  11 Caroline Houillier  11 Florence Laigle-Donadey  11 Dimitri Psimaras  11 Eudocia Q Lee  5   13 Lakshmi Nayak  5   13 J Ricardo McFaline-Figueroa  5   13 Alexandre Carpentier  24 Philippe Cornu  24 Laurent Capelle  24 Bertrand Mathon  24 Jill S Barnholtz-Sloan  25 Arnab Chakravarti  26 Wenya Linda Bi  27 E Antonio Chiocca  27 Katie Pricola Fehnel  28 Sanda Alexandrescu  29 Susan N Chi  6   30 Daphne Haas-Kogan  31 Tracy T Batchelor  5   13 Garrett M Frampton  14 Brian M Alexander  14   31 Raymond Y Huang  32 Azra H Ligon  7 Florence Coulet  19 Jean-Yves Delattre  11   33 Khê Hoang-Xuan  11 David M Meredith  12   7 Sandro Santagata  12   7   34   35 Alex Duval  36 Marc Sanson  11   33 Andrew D Cherniack  4   5 Patrick Y Wen  5   13 David A Reardon  5 Aurélien Marabelle  17 Peter J Park  8 Ahmed Idbaih  11 Rameen Beroukhim  37   38   39 Pratiti Bandopadhayay  40   41   42 Franck Bielle  43 Keith L Ligon  44   45   46   47   48
Affiliations

Mechanisms and therapeutic implications of hypermutation in gliomas

Mehdi Touat et al. Nature. 2020 Apr.

Abstract

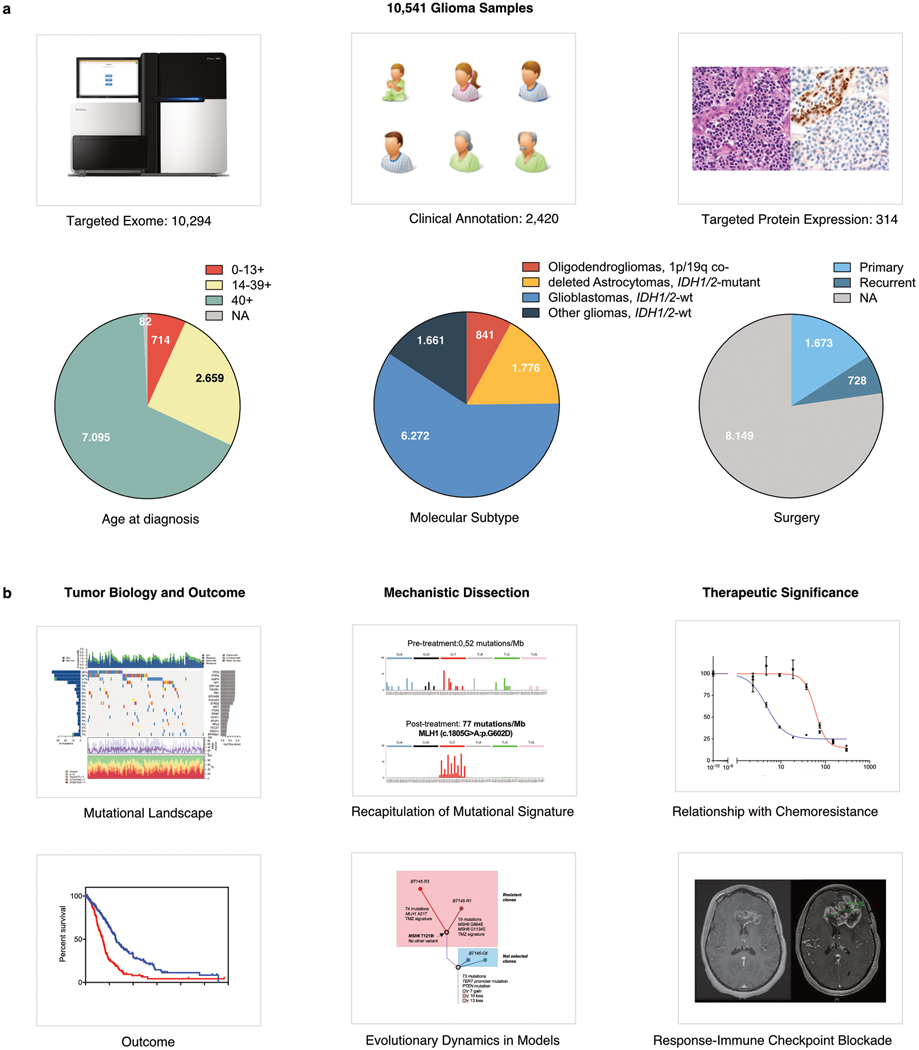
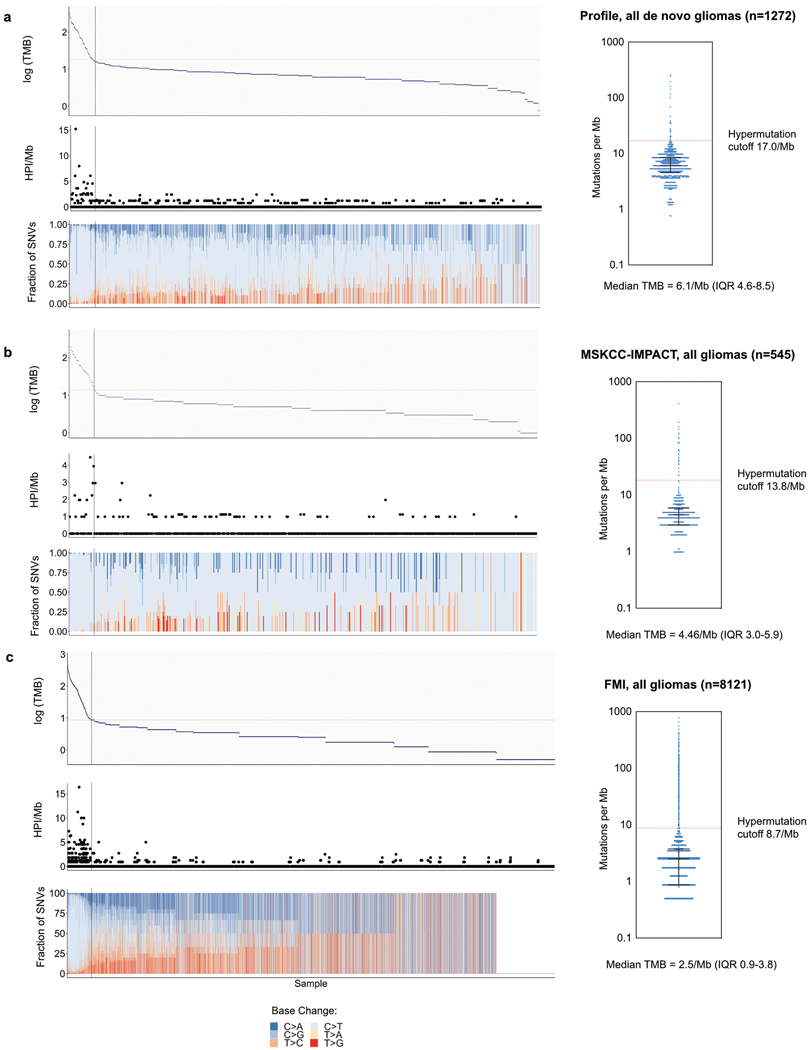
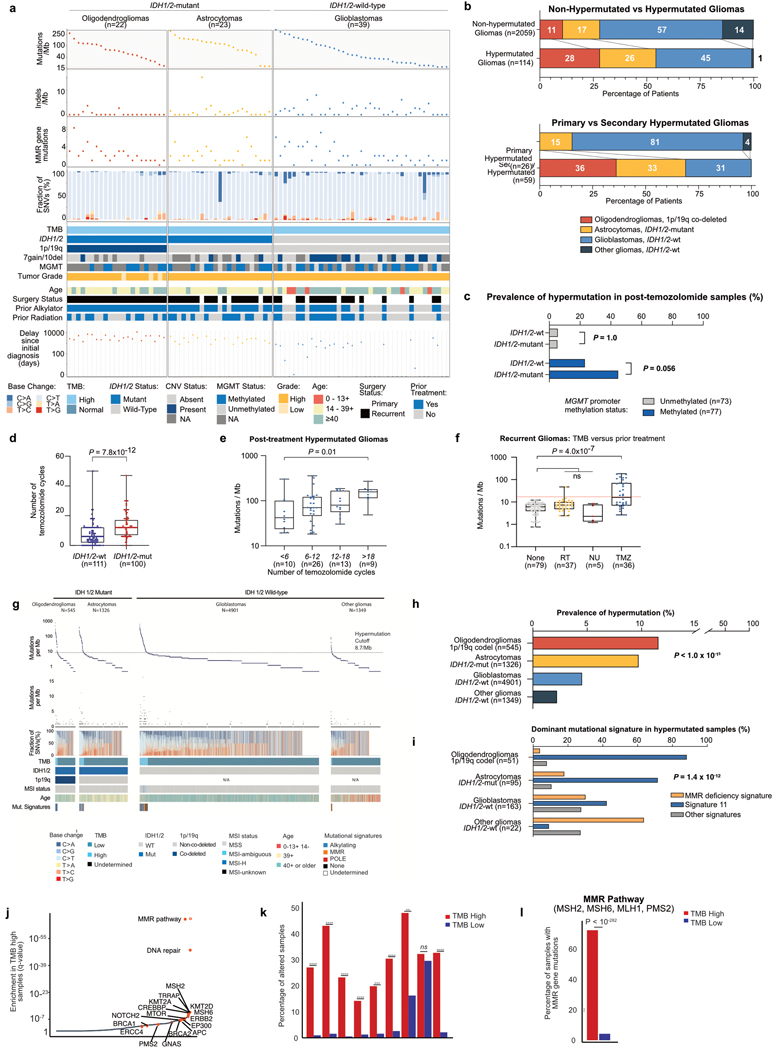
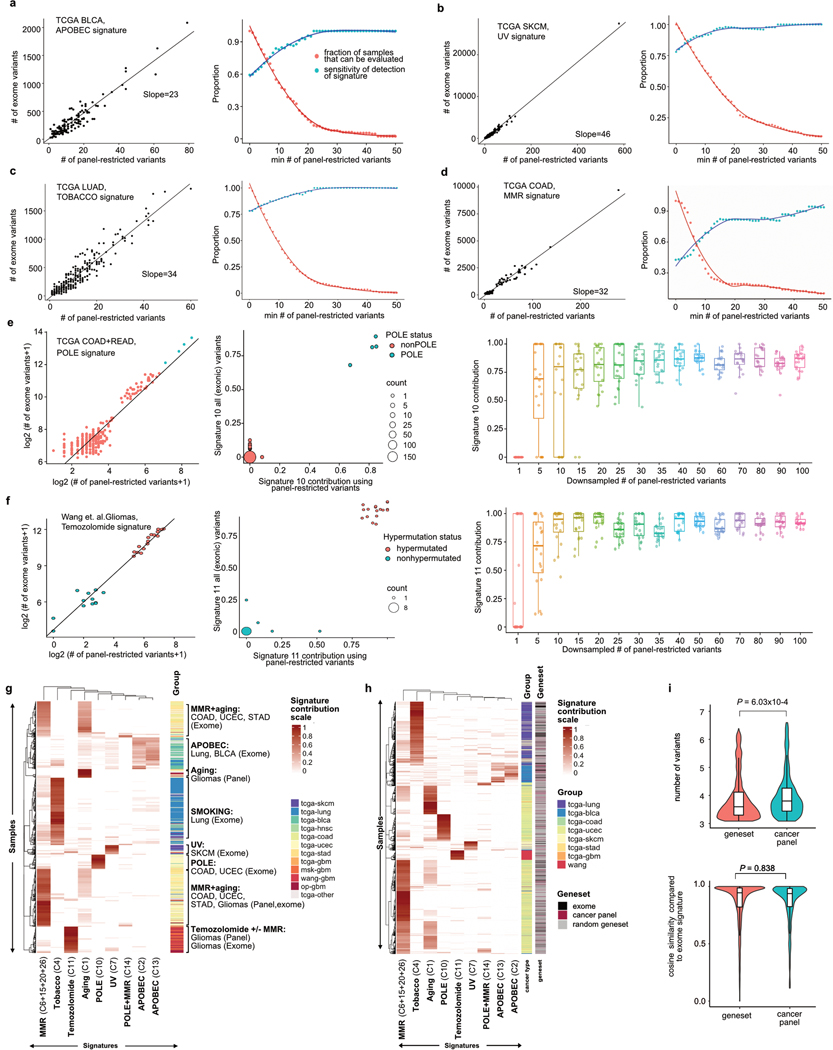
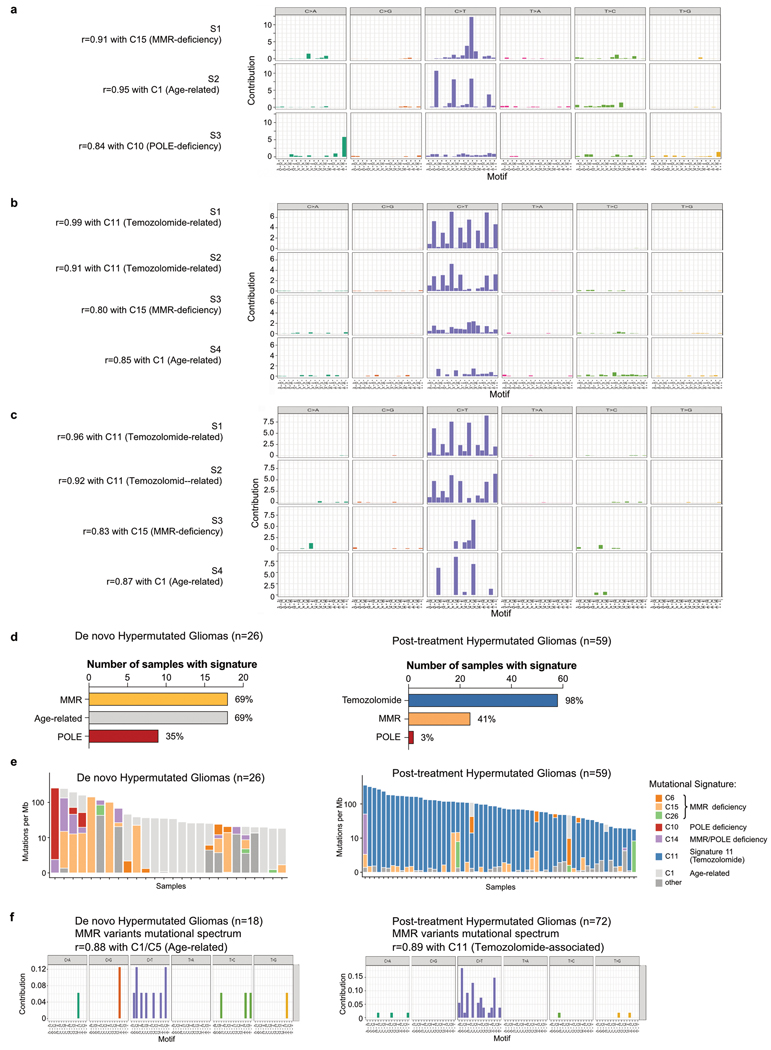
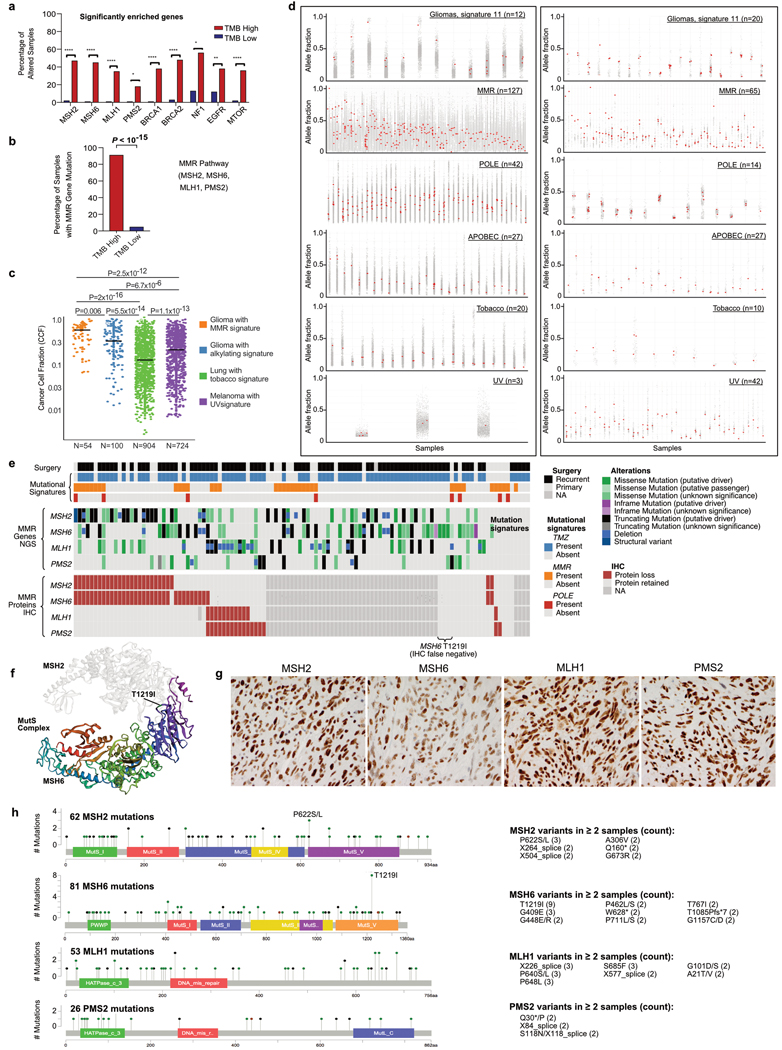
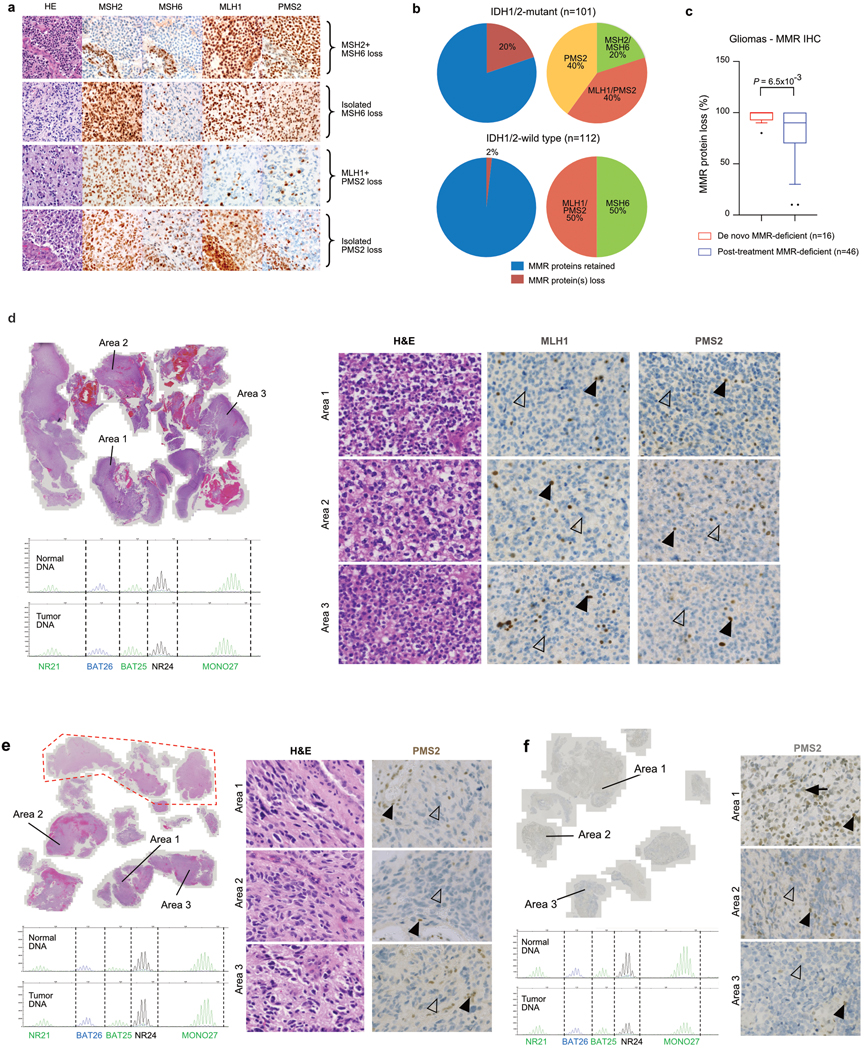
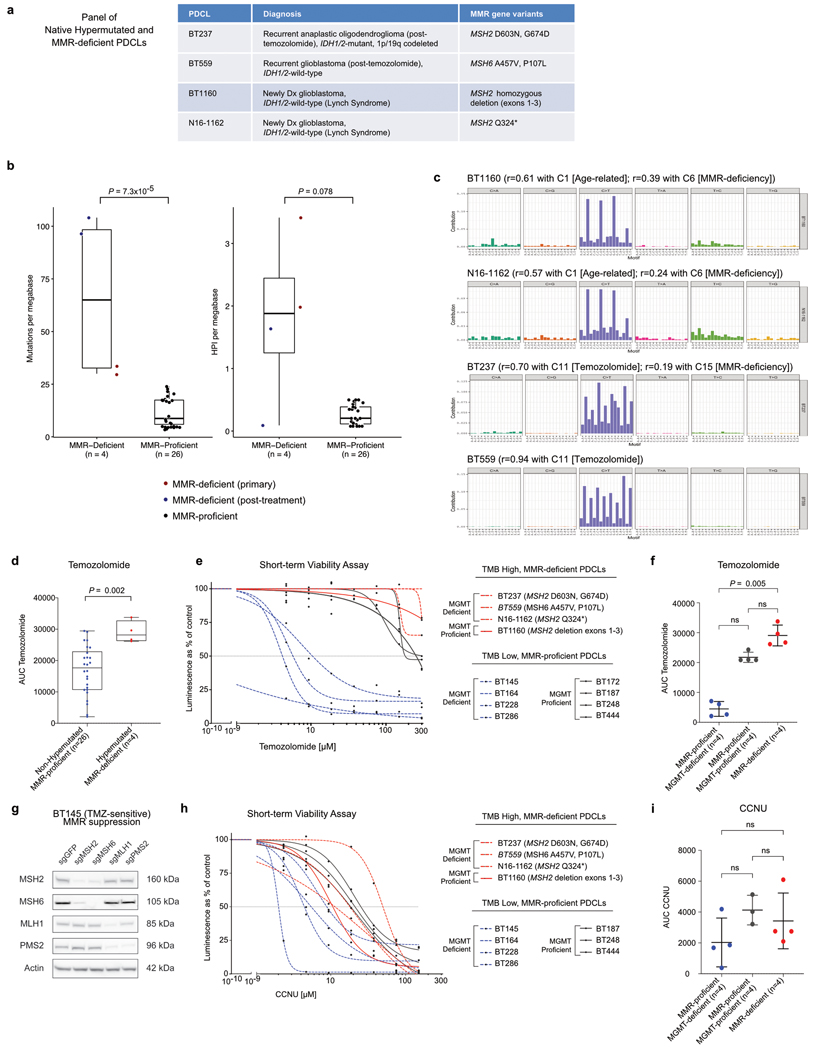
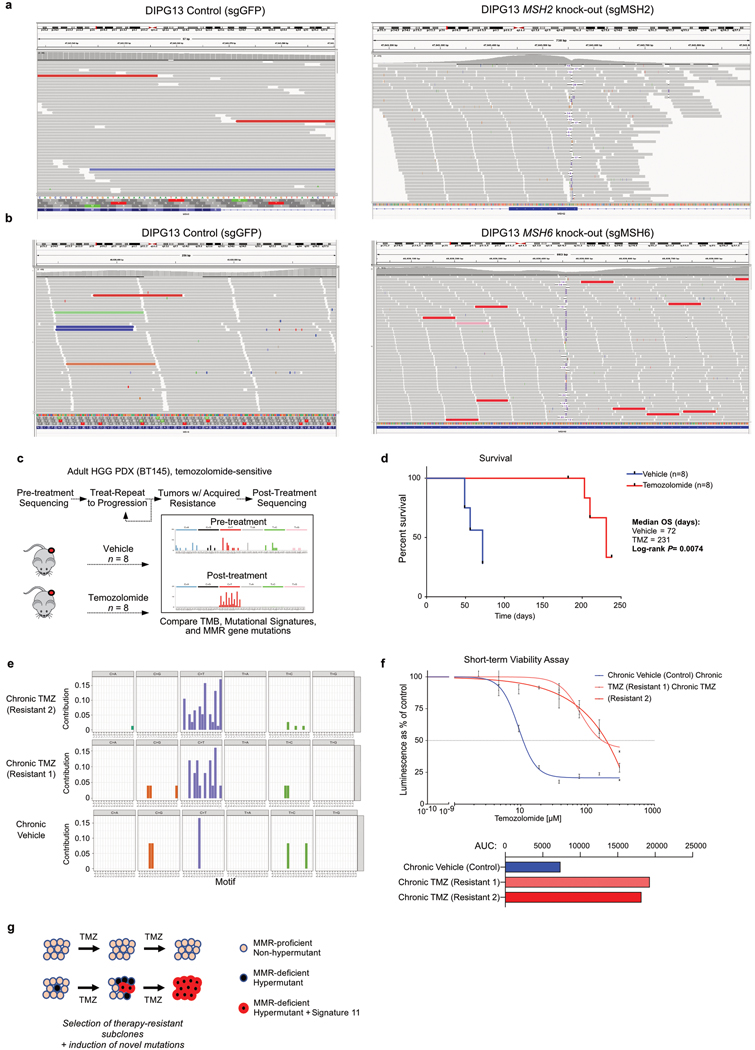
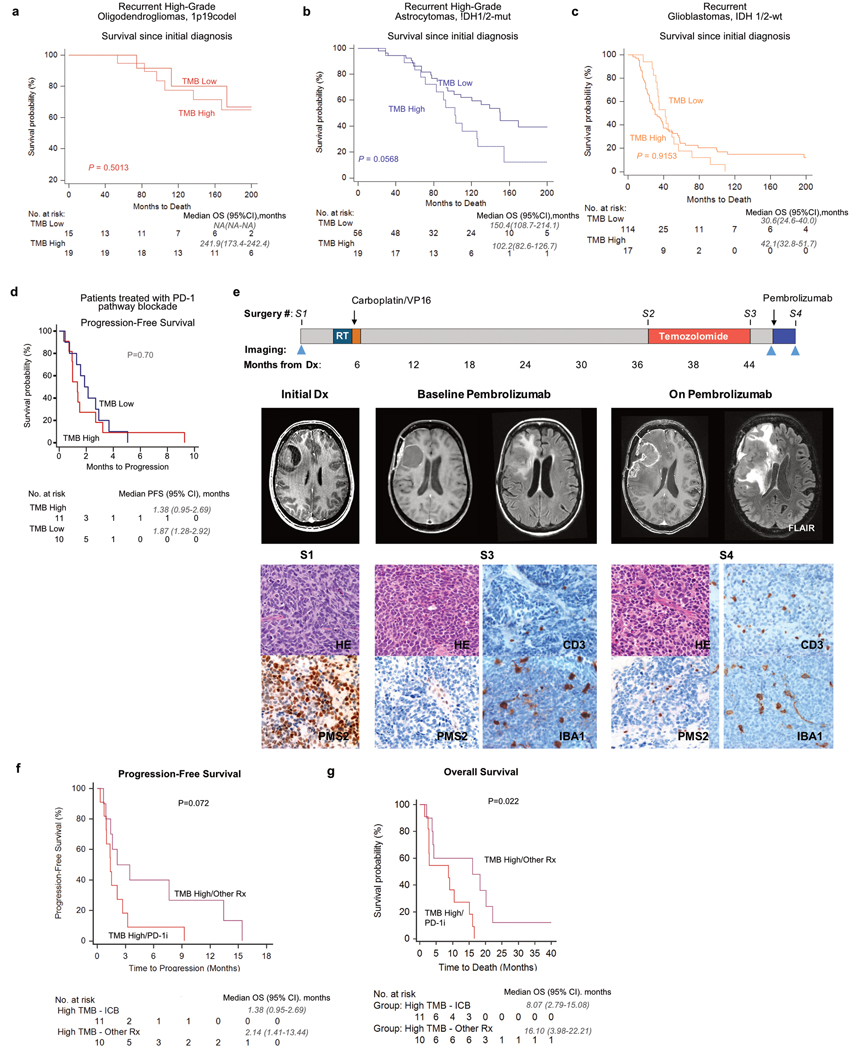
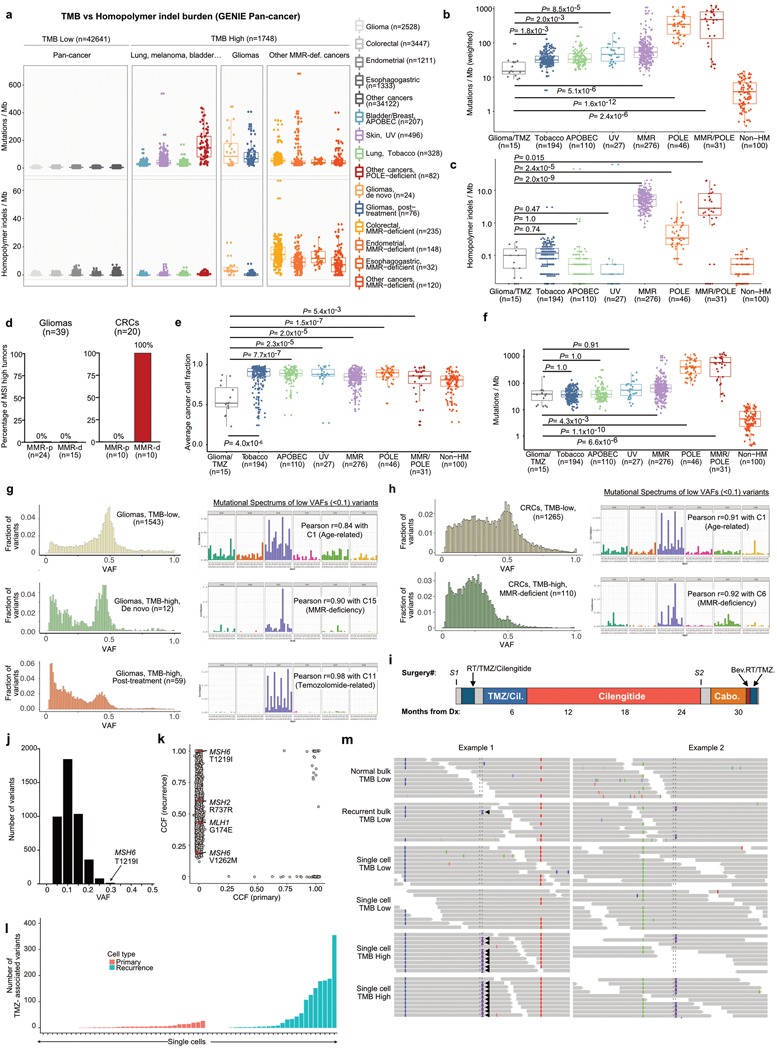
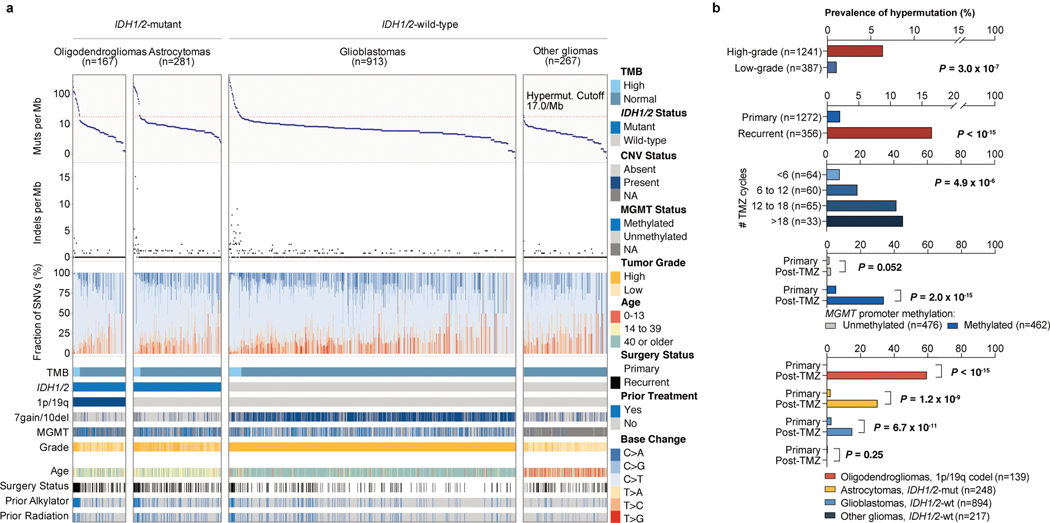
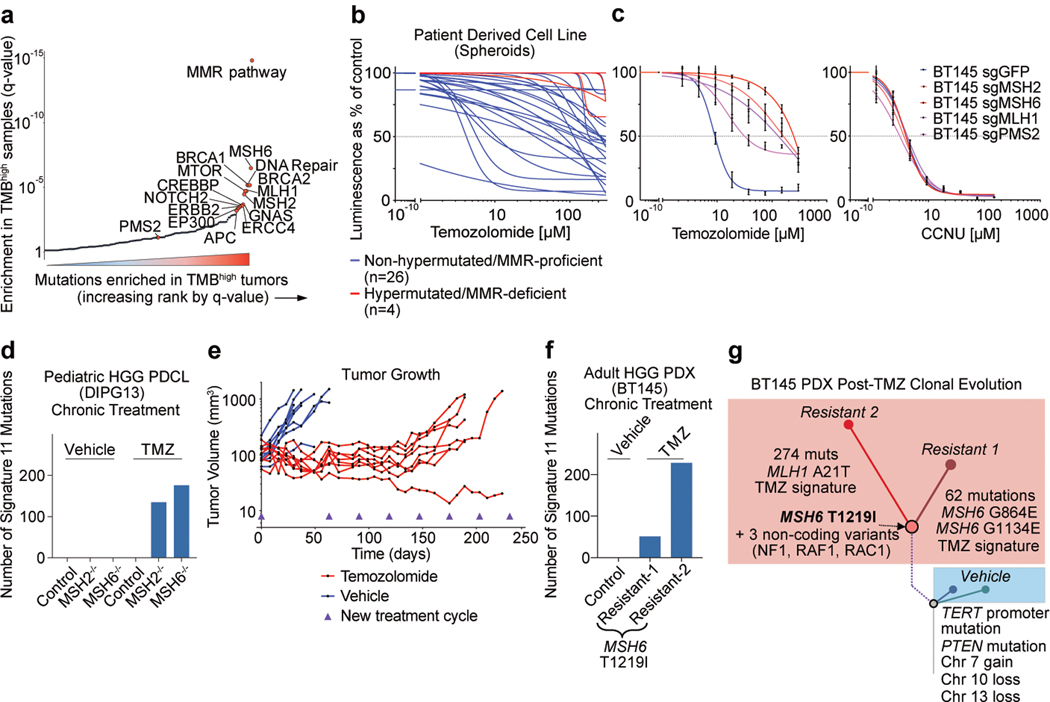
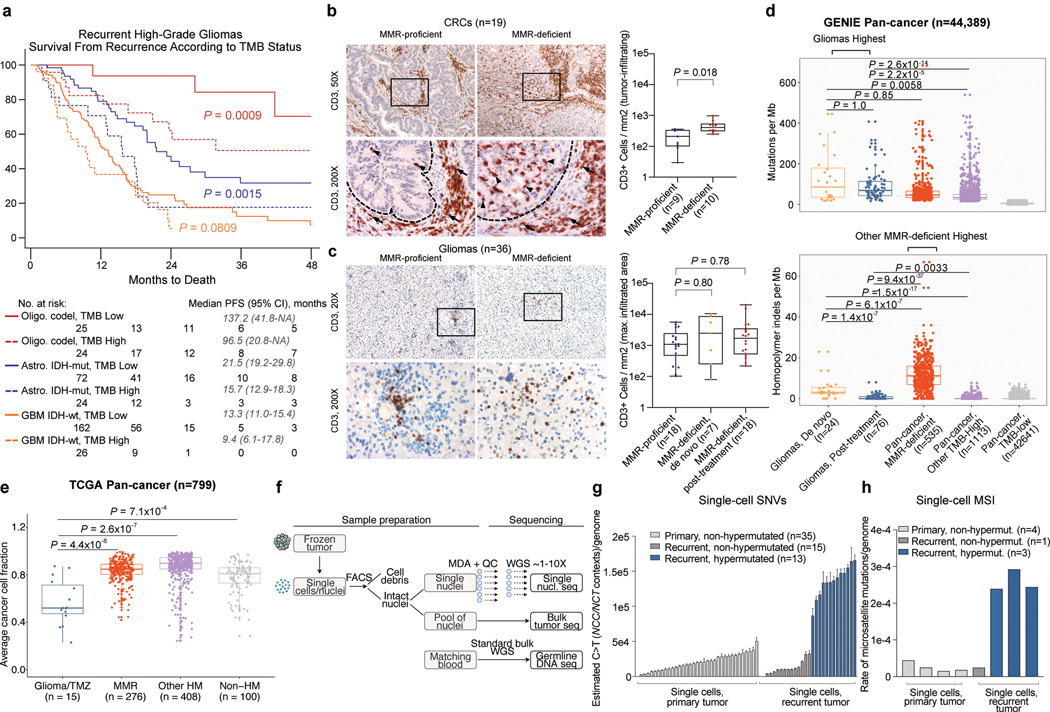
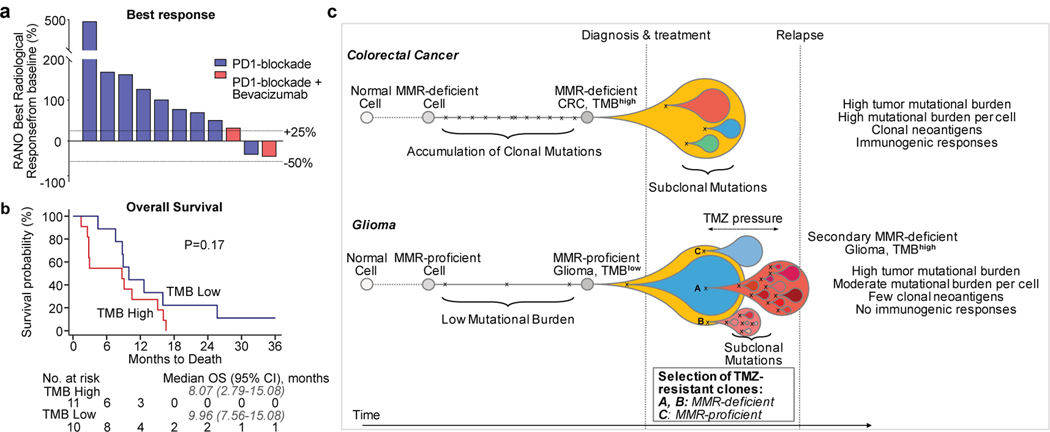
A high tumour mutational burden (hypermutation) is observed in some gliomas1-5; however, the mechanisms by which hypermutation develops and whether it predicts the response to immunotherapy are poorly understood. Here we comprehensively analyse the molecular determinants of mutational burden and signatures in 10,294 gliomas. We delineate two main pathways to hypermutation: a de novo pathway associated with constitutional defects in DNA polymerase and mismatch repair (MMR) genes, and a more common post-treatment pathway, associated with acquired resistance driven by MMR defects in chemotherapy-sensitive gliomas that recur after treatment with the chemotherapy drug temozolomide. Experimentally, the mutational signature of post-treatment hypermutated gliomas was recapitulated by temozolomide-induced damage in cells with MMR deficiency. MMR-deficient gliomas were characterized by a lack of prominent T cell infiltrates, extensive intratumoral heterogeneity, poor patient survival and a low rate of response to PD-1 blockade. Moreover, although bulk analyses did not detect microsatellite instability in MMR-deficient gliomas, single-cell whole-genome sequencing analysis of post-treatment hypermutated glioma cells identified microsatellite mutations. These results show that chemotherapy can drive the acquisition of hypermutated populations without promoting a response to PD-1 blockade and supports the diagnostic use of mutational burden and signatures in cancer.


Conflict of interest statement

The other authors report no competing interests.

Figures

Extended Data Figure 1.
Extended Data Figure 1.. Overview of the Clinical Characteristics of the Patients in the Study and Analyses Performed.
a, Clinical datasets analysed and main demographics including age, histomolecular subtype and disease stage. 1,628 glioma samples from adult and paediatric patients were sequenced as part of a large institutional prospective sequencing program of consented patients (DFCI-Profile) and subsequently clinically annotated. We identified 545 and 8,121 gliomas with sequencing from the MSKCC-IMPACT and FMI datasets, respectively, and used them as a replication set (total set of 10,294 sequenced samples). In addition, 314 tumours—including 247 consecutive recurrent gliomas—were analysed for protein expression of four MMR proteins (MSH2, MSH6, MLH1, and PMS2) using immunohistochemistry. b, Analyses performed and key clinical questions that were addressed in the study.
Extended Data Figure 2.
Extended Data Figure 2.. Distributions of TMB, homopolymer indels, and SNV mutation spectra in the datasets used.
a, DFCI-Profile (de novo gliomas only); b, MSKCC-IMPACT; c, FMI (total n = 9,938). After examining the distribution of TMB in each dataset for breakpoints, thresholds for hypermutation were further confirmed using segmented linear regression analysis (analysis restricted to de novo gliomas for DFCI-Profile). This method showed the presence of a breakpoint at 17.0 and 8.7 mutations per Mb for the DFCI-Profile and FMI datasets, respectively. For the MSKCC-IMPACT dataset, the cutoff used for hypermutation (13.8 mutations per Mb) was previously determined . The frequency of hypermutation was similar in the three datasets (85 (5.2%) in DFCI-Profile; 29 (5.3%) in MSKCC-IMPACT; 444 (5.5%) in FMI). The median tumour mutation burden (TMB) in the combined datasets was 2.6 mutations per Mb (range, 0.0–781.3). Compared with non-hypermutated gliomas, hypermutated tumours showed atypical patterns of SNVs, consistent with abnormal mutational processes operating in these samples. Bars represent median and interquartile range for each dataset (right). HPI, homopolymer indels.
Extended Data Figure 3.
Extended Data Figure 3.. Integrated analysis of tumour mutation burden in hypermutated gliomas in the DFCI-Profile, MSKCC-IMPACK and FMI datasets.
a, Distribution of TMB, homopolymer indels, MMR mutations, and SNV mutational spectrum according to molecular status of IDH1/2, 1p/19q co-deletion (1p/19q), gain of chromosome 7 and/or deletion of chromosome 10 (7gain/10del), and MGMT promoter methylation, histological grade, age at initial diagnosis, and history of prior treatment with alkylating agents or radiation therapy (the distinction between photon and proton therapy was not systematically captured) in the DFCI-Profile dataset (n = 84, data not shown for the single sample from other gliomas, IDH1/2-wt subgroup). b, Top, distribution of histomolecular groups in non-hypermutated and hypermutated gliomas from the combined sequencing dataset (n = 2,173). Bottom, distribution of molecular groups in de novo and post-treatment hypermutated gliomas from the DFCI-Profile dataset (n = 85) (annotation not available for the MSKCC-IMPACT set). c, Prevalence of hypermutation according to MGMT promoter methylation and IDH1/2 mutation status in post-temozolomide gliomas from the DFCI-Profile dataset (n = 150). Two-sided Fisher’s exact test. d, Number of temozolomide cycles according to IDH1/2 mutation status in post-temozolomide diffuse gliomas from the DFCI-Profile dataset (n = 211 gliomas). Patients who received combined chemoradiation but no adjuvant temozolomide were included. Two-sided Wilcoxon rank-sum test. e, Boxplots of TMB in post-treatment hypermutated gliomas according to the number of temozolomide cycles received before surgery. Kruskal–Wallis test and Dunn’s multiple comparison test. f, TMB in recurrent gliomas according to treatments received before surgery. Patients who received multiple treatment modalities were excluded. Kruskal–Wallis test and Dunn’s multiple comparison test. Boxes, quartiles; centre lines, median ratio for each group; whiskers, absolute range (df). g, Integrated analysis of the FMI dataset (n = 8,121 gliomas) depicting tumour mutation burden, the number of indels at homopolymer regions, and the SNV mutation spectrum detected in each tumour according to molecular status of IDH1/2 and 1p/19q co-deletion (1p/19q), MSI status, and age at initial diagnosis. Dominant mutational signatures detected in hypermutated samples are depicted. The dotted line indicates the threshold for samples with a high mutation burden (8.7 mutations per Mb). h, Prevalence of hypermutation among molecularly defined subgroups in the FMI dataset (n = 8,121 gliomas). Chi-squared test. i, Dominant mutational signatures detected in hypermutated samples in the FMI dataset (n = 8,121 gliomas). Chi-squared test. j, Mutated genes and pathways enriched in hypermutated gliomas in the FMI dataset (n = 8,121). Enrichment was assessed using a permutation test to control for random effects of hypermutability in tumours with high TMB. k, l, Proportion of TMBhigh versus TMBlow samples with mutations in selected DNA repair genes and glioma drivers (e) and in the MMR pathway (MSH2, MSH6, MLH1 and PMS2; f). Permutation test; ****P < 0.0001, ***P < 0.001, **P < 0.01; ns, not significant.
Extended Data Figure 4.
Extended Data Figure 4.. Validation of Known Hypermutation-Associated Signatures Using TCGA Datasets.
Mutational signatures were predicted using exome-sequencing variants that overlapped with the panel-targeted regions, and then compared to previously published DeconstructSigs signature predictions based on all exome variants. The TCGA MC3 dataset was used to assess the detection of COSMIC mutational signatures associated with APOBEC (signatures 2 and 13), mismatch repair (signature 6), ultraviolet light (signature 7), POLE (signature 10), and tobacco (signature 4). Variant calls for 17 hypermutated and 12 non-hypermutated glioma exome-sequenced samples were used to assess temozolomide (signature 11) detection . a, Detection of APOBEC-associated mutational signature in TCGA BLCA samples (n = 129 out of 411 samples). b, Detection of ultraviolet-associated mutational signature in TCGA SKCM samples (n = 237 out of 466 samples). c, Detection of tobacco smoking-associated mutational signature in TCGA LUAD samples (n = 250 out of 513 samples). d, Detection of MMR-associated mutational signature in TCGA COAD (n = 188 out of 380 samples). e, Detection of POLE-associated mutational signature in TCGA COAD and READ samples (n = 277 out of 380 samples). f, Detection of temozolomide-associated mutational signature in ref. (n = 29). g, Unsupervised clustering of hypermutated samples. A total of 865 hypermutated tumour samples from exomes (pan-TCGA and Wang et al.) and targeted panels (DFCI-Profile and MSK-IMPACT) were analysed for known hypermutation signatures (tobacco, UV, MMRD, POLE, TMZ, APOBEC). Samples and signatures underwent 2D hierarchical clustering based on Euclidean distance. h, Performance of cancer panel versus other genesets in mutational signature calling. We analysed 622 hypermutated tumour exomes (pan-TCGA and Wang et al., black) for their mutational signature contributions when restricted to variants from i) DFCI-Profile OncoPanel cancer panel genes (red), or ii) 9 randomly selected gene sets (grey) of similar total capture size to the cancer panel. For each sample, we assessed known hypermutation signatures for cancer panels and gene sets for which at least 20 single base substitutions were retained in the sample after restriction. Samples and signatures underwent 2D hierarchical clustering based on Euclidean distance. i, The violin plots represent the number of variants (top) and the cosine similarity of signature contributions (bottom) when using all exonic variants versus restriction to cancer panel or the 49 random gene sets. Boxes, quartiles; centre lines, median ratio for each group; whiskers, absolute range. Two-sided Welch’s t-test.
Extended Data Figure 5.
Extended Data Figure 5.. Mutational Signature Analysis of Primary and Secondary Hypermutated Cohort (n=111)
a, Mutational signature analysis of newly diagnosed hypermutated gliomas in the DFCI-Profile dataset (n = 24). b, Mutational signature analysis of secondary hypermutated gliomas (samples in which hypermutation was detected in the recurrent tumour) in the DFCI-Profile dataset (n = 58). The novel COSMIC Signature 11-related signature (S2) was associated with 1p/19q co-deletion and lack of prior radiation therapy (66.7% of samples with high S2 versus 26.2% of samples with high S1 signature, Fisher P = 0.016). c, Mutational signature analysis of hypermutated gliomas from the MSKCC-IMPACT dataset (n = 29). d, Mutational signature analysis in de novo (hypermutated at first diagnosis, n = 26, left) and post-treatment hypermutated gliomas (hypermutation in a recurrent tumour, n = 59, right). Percentage of samples exhibiting the most common mutational signatures and their hypothesized causes are displayed. MMR, C6, C14, C15, C26; age-related, C1; POLE, C10, C14. Chi-squared test. e, Mutational signatures identified in individual de novo hypermutated gliomas (hypermutated at first diagnosis, n = 26, left) and post-treatment hypermutated gliomas (hypermutation in a recurrent tumour, n = 59, right). f, Mutational signature analysis of MMR variants in hypermutated gliomas from the DFCI-Profile and MSKCC-IMPACT datasets (n = 114). Ninety variants of the MMR genes MSH2, MSH6, MLH1, and PMS2 were merged into two groups (de novo, n = 18; post-treatment, n = 72) according to the type of sample in which they were found and analysed for mutational signatures using a regression model (Rosenthal et al. ). In each sample, only the MMR variant with the highest VAF was included, to limit the inclusion of possible passenger variants. For signature discovery in both cohorts (ac), variants were analysed using the non-negative matrix factorization (NMF) method and correlated with known COSMIC mutational signatures using Pearson correlation.
Extended Data Figure 6.
Extended Data Figure 6.. Characteristics of MMR Molecular Variants in Hypermutated Gliomas.
a, b, Proportion of TMBhigh versus TMBlow samples with mutations in selected DNA repair genes and glioma drivers (a) and in the MMR pathway (MSH2, MSH6, MLH1 and PMS2) (b) in the merged DFCI-Profile/MSKCC-IMPACT dataset (n = 2,173). Permutation test; ****P < 10−5, **P < 10−2, *P < 0.05. c, CCFs of MMR gene mutations in post-treatment hypermutated gliomas versus other hypermutated cancers in the FMI dataset. Horizontal line, median. Two-sided Wilcoxon rank-sum test with Benjamini–Hochberg correction. d, VAF distribution of mutations in post-treatment hypermutated gliomas, non-glioma MMR-deficient cancers (diverse histologies) and other non-glioma hypermutated samples (diverse histologies) from the TCGA and MSKCC-IMPACT datasets. Each dot represents a mutation found in an individual sample (represented vertically). MMR mutations are depicted in red. Left, hypermutated samples from the pan-TCGA dataset; right, hypermutated samples from the MSKCC-IMPACT dataset. e, Integrated view of mutational signatures and MMR gene mutations and protein expression in hypermutated gliomas (n = 114). Tumours with the mutational hotspot MSH6(T1219I) (11.9% of post-treatment hypermutated gliomas) are highlighted. f, Mutation diagram of MSH2, MSH6, MLH1, and PMS2 mutations found in hypermutated gliomas from the DFCI-Profile and MSKCC-IMPACT datasets (n = 114). The hotspot MSH6 missense variant p.T1219I was found in nine samples. g, Hotspot MSH6 p.T1219I variant mapped to the bacterial MutS 3D structure (PDB 5YK4). h, Representative immunohistochemistry (IHC) images of the MMR proteins MSH2, MSH6, MLH1 and PMS2 in a hypermutated glioblastoma with MSH6(T1219I) mutation. Three independent samples were stained. Scale bar, 100 μm.
Extended Data Figure 7.
Extended Data Figure 7.. Results of MMR IHC Screening in 213 Consecutive Recurrent Gliomas and Patterns of MMR Protein Expression Loss in three de novo or post-treatment MMR-deficient Gliomas.
a, Recurrent patterns of MMR protein loss identified by IHC in gliomas. Scale bar, 50 μm. b, Summary of MMR IHC screening results for 213 consecutive recurrent gliomas. All monocentric consecutive relapses of diffuse gliomas in adult patients following treatment with post-alkylating agents (surgery between 2009 and 2015) were included in the immunohistochemistry analysis. Further sequencing of samples in which MMR protein loss was identified showed hypermutation with MMR molecular defects in 18/19 (94.7%) samples. c, Percentage of tumour MMR protein loss in glioma samples with de novo (n = 16) or post-treatment (n = 46) MMR deficiency. Samples were scored by two pathologists in blinded fashion. Regional heterogeneity of MMR protein loss for the four MMR proteins MSH2, MSH6, MLH1, and PMS2 was scored as to the maximal percentage of protein loss among tumour cells for each sample (5% increments). Boxes, quartiles; centre lines, median ratio for each group; whiskers, absolute range, excluding outliers. Two-sided Wilcoxon rank-sum test. d, Clonal MMR deficiency in a de novo high-grade glioma. Top left, low magnification of haematoxylin and eosin (H&E) staining of the large surgical tumour pieces obtained from surgical resection. Right, high magnification in three tumour areas (H&E staining, MLH1 and PMS2 immunostaining) showing a highly cellular tumour with an oligodendroglial phenotype and a loss of expression of MLH1 and PMS2 in all tumour cells (open arrowheads). Normal cells have a maintained MLH1 and PMS2 expression (solid arrowheads). Bottom left, microsatellite testing via PCR amplification of five mononucleotide markers (BAT25, BAT26, NR21, NR24, and MONO27) showed the tumour to be MSS. Array CGH showed a homozygous deletion of the entire coding region of MLH1. Scale bars; top left, 5 mm; right, 100 μm. e, Clonal MMR deficiency in a hypermutated post-treatment, IDH1-mutant glioblastoma. Top left, low-magnification image of H&E staining of tissue obtained from surgical resection, with three areas of tumour selected for images. Red dashed line delimits normal brain. Right, high-magnification images of H&E staining, showing highly cellular tumour and an astrocytic phenotype, and PMS2 IHC, showing loss of expression of PMS2 in all tumour cells (open arrowheads). Normal cells have maintained PMS2 expression (internal control, solid arrowheads). Bottom left, Microsatellite testing via PCR amplification of five mononucleotide markers (BAT25, BAT26, NR21, NR24, and MONO27) showed the tumour to be MSS. NGS showed a TMB of 120.1 per Mb and homopolymer indel burden of 3.8 per MB, with contributions from temozolomide (90%) and MMR-deficiency (10%) mutational signatures. A missense (p.P648L) hotspot MLH1 mutation known to be pathogenic from patients with Lynch syndrome with a VAF of 0.73 and loss of heterozygosity was present in this case. Scale bars, top left, 5 mm; right 100 μm. f, Subclonal MMR deficiency in a hypermutated post-treatment IDH1-mutant glioblastoma. Top left, low-magnification image of PMS2 immunostaining of the tumour pieces obtained from surgical resection. Right, high magnification images of three areas of PMS2 immunostaining showing heterogeneous PMS2 expression across the sample consistent with a subclonal tumour. Area 1 shows that PMS2 is retained in atypical tumour cells (arrow); area 2 is heterogeneous with loss (open arrowhead) in some but not all tumour cells; area 3 is an example of diffuse loss of expression in tumour cells (open arrowhead). Normal cells have a maintained PMS2 expression (solid arrowheads in all images). Bottom left, microsatellite analysis via PCR amplification of five mononucleotide markers (BAT25, BAT26, NR21, NR24, and MONO27) showed the tumour to be MSS. NGS showed a TMB of 236.5 per Mb and homopolymer indel burden of 2.3 per MB, with 95% contribution of temozolomide mutational signature. Scale bars, top left 5 mm; right 100 μm.
Extended Data Figure 8.
Extended Data Figure 8.. Characterization of High-grade Glioma PDCLs and their Sensitivity to Temozolomide and CCNU
a, Clinico-molecular characteristics of four native newly diagnosed or recurrent glioma PDCL models harbouring hypermutation and MMR deficiency. b, Thirty glioma PDCLs, including four PDCLs derived from patients with de novo (BT1160, N16-1162, both established from patients with Lynch syndrome) or post-treatment (BT237, BT559) MMR deficiency were molecularly characterized using whole-exome sequencing. The panels show the tumour mutational burden (left) and homopolymer indel burden (right) in each model. Boxes, quartiles; centre lines, median ratio for each group; whiskers, absolute range. Two-sided Wilcoxon rank-sum test. c, Mutational signature analysis was performed in the PDCL models of constitutional and post-treatment MMR deficiency using the R package DeconstructSigs to estimate the contributions of mutational signatures using a regression model (Rosenthal et al. ). For each PDCL, the contribution of the main COSMIC mutational signatures identified is expressed as decimal. d, Boxplots of temozolomide AUC in non-hypermutated versus hypermutated PDCLs. Boxes, quartiles; centre lines, median ratio for each group; whiskers, absolute range. Two-sided Wilcoxon rank-sum test. e, f, A panel of 12 glioma PDCL models representing the different MGMT and MMR classes was selected and assessed for sensitivity to temozolomide in a short-term viability assay (e; dots represent means). The temozolomide AUC was compared between the three groups using a Kruskal–Wallis test and Dunn’s multiple comparison test (f; mean ± s.d.). g, Western blot of the glioblastoma patient-derived cell line (BT145) in which the genes MSH2, MSH6, MLH1 or PMS2 have been knocked-out using the CRISPR–Cas9 system. h, i, A panel of 11 glioma PDCL models representing the different MGMT and MMR classes was selected and assessed for sensitivity to CCNU in a short-term viability assay (h; dots represent means). No CCNU data was available for the model BT172. The CCNU AUC was compared between the three groups using a Kruskal–Wallis test and Dunn’s multiple comparison test (i; mean ± s.d.).
Extended Data Figure 9.
Extended Data Figure 9.. MMR-deficient models of glioma, continued.
a, b, CRISPR-Cas9 MSH2 and MSH6 gene knockout in DIPG13 high-grade glioma cell line. a, Integrated genomics viewer (IGV) plots depicting MSH2 reads in between the guide RNAs in the MSH2 unedited line (sgGFP, left) and the MSH2 CRISPR knockout line (right) confirming knockout in the MSH2 edited line. b, IGV plots depicting MSH6 reads in between the guide RNAs in the MSH6 unedited line (sgGFP, left) and the MSH6 CRISPR knockout line (right) confirming knockout in the MSH6 edited line. c, Overview of in vivo temozolomide resistance study. Treatment of subcutaneous BT145 PDX-bearing animals was initiated at a volume of 100 mm3 and eight nude mice per group were randomized to 12 mg/kg/day temozolomide or vehicle for five consecutive days per 28-day cycle. Mice were treated until tumours reached a volume of 1,500 mm3, and tumours were sequenced to identify mutations and mutational signature. d, Survival of mice with BT145 xenografts (n = 8 mice per group) during treatment with vehicle (blue) or temozolomide (red). Two-sided log-rank test. e, Unique variants found in three sequenced BT145 tumours (two temozolomide-treated, and one vehicle-treated) were analysed for correlation with known mutational signatures. COSMIC Signature 11 was found in the two temozolomide-treated tumours. Mutational signatures could not be called in the vehicle-treated tumour (too few variants). After filtering of truncal variants common to all tumours, the two temozolomide-treated tumours shared only four variants, including an MSH6(T1219I) mutation and three noncoding variants. f, BT145 xenografts chronically treated with vehicle (n = 1) or temozolomide (n = 2) were removed, dissociated and cultured in serum-free medium to establish cell lines. After three passages in culture, sensitivity to temozolomide was assessed. The results of the short-term viability assays (mean ± s.e.m.) and temozolomide AUC of each cell line are depicted. g, Model of acquired hypermutation with mutational signature 11 in gliomas. Top, MMR-proficient cells repair TMZ damage and do not develop signature 11. Resistance in these cells is mediated by non-MMR pathways (for example, MGMT expression). Bottom, TMZ induces and/or selects resistant subclonal MMR-deficient cells. Further TMZ exposure produces accumulation of mutations at specific trinucleotide contexts, detected as hypermutation with signature 11.
Extended Data Figure 10.
Extended Data Figure 10.. Extended Outcome Data.
ac, Survival of patients with recurrent high-grade glioma (WHO grade III or IV) from the time of initial diagnosis according to TMB status (solid curves, TMBlow; dotted curves, TMBhigh). The curves include 240 recurrent samples from DFCI-Profile with available survival data from initial diagnosis. Two-sided log-rank test. a, Survival of patients with recurrent high-grade 1p/19q co-deleted oligodendroglioma from the time of initial diagnosis. b, Survival of patients with recurrent high-grade IDH1/2-mutant astrocytoma from the time of initial diagnosis. c, Survival of patients with recurrent IDH1/2 wild-type glioblastoma from the time of initial diagnosis. d, PFS of 11 patients with hypermutated and MMR-deficient glioma who were treated with PD-1 blockade (single-agent or in combination with bevacizumab, red curve). A cohort of patients with non-hypermutated glioma who were treated with PD-1 blockade is depicted as control (n = 10, best matches according to diagnosis, primary versus recurrent status, and prior treatments, blue curve). A two-sided log-rank test is used. e, f, PFS (e) and OS (f) of 11 patients with hypermutated and MMR-deficient glioma who were treated with PD-1 blockade (red curves). A cohort of hypermutated patients treated with other systemic agents is depicted as control (best matches according to diagnosis, primary vs recurrent status, and prior treatments were selected from the cohort of sequenced gliomas, purple curves). Two-sided log-rank test. Clinical and histomolecular characteristics of patients from both cohorts are provided in Supplementary Table 7. g, Lack of immune response following PD1 blockade (pembrolizumab) in a patient with post-treatment hypermutated MMR-deficient glioblastoma. Top, timeline; middle, MRI images; bottom, H&E images and IHC for PMS2 expression and tumour infiltration with CD3-positive T cells and IBA1-positive macrophages in the primary (S1), recurrent pre-pembrolizumab (S3) and recurrent post-pembrolizumab (S4) tumours. The tumour acquired a focal PMS2 two-copy deletion, protein loss, and hypermutation in the post-temozolomide recurrent tumour (S3). Scale bar, 50 μm.
Extended Data Figure 11.
Extended Data Figure 11.. Molecular Characteristics of Hypermutated Gliomas.
a, Pan-cancer analysis of TMB and homopolymer indel burden in the GENIE dataset (n = 44,389). Tumour samples from the GENIE dataset (v6.1) were analysed for mutational and homopolymer indel burden. Statistical comparisons between groups are provided in Supplementary Table 6. b, TMB in hypermutated gliomas (post-treatment) versus MMR-deficient cancers and other hypermutated cancers from the TCGA and Wang et al. exome datasets (n = 798). Two-sided Wilcoxon rank-sum test with Bonferroni correction. c, Pan-cancer analysis of the homopolymer indel burden in hypermutated gliomas (post-treatment) versus MMR-deficient cancers and other hypermutated cancers from the TCGA and Wang et al. exome datasets (n = 798). d, Results of MSI analysis using the standard pentaplex assay in glioma (n = 39) and CRC samples (n = 19) according to MMR status (MMR-d, MMR deficient; MMR-p, MMR-proficient). e, Pan-cancer analysis of cancer cell fractions in hypermutated gliomas (post-treatment) versus MMR-deficient cancers and other hypermutated cancers from the TCGA and Wang et al. exome datasets (n = 798). Two-sided Wilcoxon rank-sum test with Bonferroni correction. f, Weighted TMB in hypermutated gliomas (post-treatment) versus MMR-deficient cancers and other hypermutated cancers from the TCGA and Wang et al. exome datasets (n = 798). The weighted TMB was calculated by weighing each individual mutation to its cancer cell fraction. Two-sided Wilcoxon rank-sum test with Bonferroni correction. g, Distribution of VAFs (left) and mutation spectrum analysis of low-allelic frequency variants (<0.1, right) in TMBlow gliomas (n = 1,543, top), de novo hypermutated gliomas with MMR deficiency mutational signature (n = 12, middle), and post-treatment hypermutated gliomas (n = 59, bottom) from the DFCI-Profile dataset. h, Distribution of VAFs (left) and mutation signature analysis of low-allelic frequency variants (<0.1, right) in TMBlow CRCs (n = 1,265, top) and TMBhigh CRCs with MMR deficiency mutational signature (n = 110, bottom) from the GENIE dataset. i, Clinical timeline for the patient with hypermutated glioblastoma with an MSH6(T1219I) mutation in whom bulk and single-cell WGS was performed. j, Distribution of VAFs of mutations in the recurrent bulk sample. The median VAF in the recurrent sample was 0.11. The MSH6(T1219I) mutation had the 18th-highest VAF out of 4,350 coding mutations. k, Cancer cell fractions (CCFs) of mutations in the primary and recurrent tumour bulk samples. Each dot represents a coding mutation. The horizontal and vertical axes are estimated clonal frequency for each mutation in the primary and recurrent samples, respectively. Mutations of the four main MMR genes are depicted in red. l, Mutational spectra in 35 cells from the primary tumour (orange) and 28 from the recurrent tumour (green) submitted to scWGS sequencing (1×). Mutational signature analysis showed a strong contribution of mutational signature 11 in hypermutated cells from the recurrent tumour. m, Representative IGV plots (n = 2 distinct genomic segments for each sample) of microsatellite insertions in the normal (TMB low) and recurrent (TMB high) bulk samples and recurrent TMB low (n = 2) and TMB high (n = 2) single cells. Solid arrowheads represent microsatellite insertions phased with a flanking heterozygous SNP allele. Open arrowheads represent microsatellite insertions for which the reads do not reach the flanking heterozygous SNP allele. Both hypermutated single cells showed multiple phased microsatellite insertions consistent with a true somatic microsatellite mutation. In general, a few reads with similar microsatellite insertions correctly phased with the same flanking heterozygous SNP allele were found in the recurrent bulk, but not in the normal bulk or non-hypermutated cells. For ac, e, f, biological subgroups were identified on the basis of mutational burden, dominant signature and histology. For b, c, e, f, 100 non-hypermutated samples were randomly selected as controls. For all box plots: boxes, quartiles; centre lines, median ratio for each group; whiskers, absolute range, excluding outliers. RT, radiation therapy; Cil, cilengitide; Cabo, cabozantinib; Bev, bevacizumab.
Figure 1.
Figure 1.. TMB and mutational signature analysis reveals clinically distinct subgroups of hypermutated gliomas.
a, Integrated analysis of the DFCI-Profile dataset (n = 1,628 gliomas) depicting TMB, indels at homopolymer regions, and the single nucleotide variant (SNV) mutation spectrum in each tumour according to molecular status of IDH1/2, 1p/19q co-deletion, chromosome 7 gain and/or chromosome 10 deletion (7gain/10del), MGMT promoter methylation, histological grade, age at initial diagnosis, and prior treatment. Red line denotes high TMB (≥17.0 mut. per Mb). b, Prevalence of hypermutation in the DFCI-Profile dataset. Chi-squared test and two-sided Fisher’s exact test. NA, not available; TMZ, temozolomide; WT, wild-type; mut, mutant; codel, co-deleted.
Figure 2.
Figure 2.. MMR deficiency drives hypermutation and chemotherapy resistance in gliomas.
a, Mutated genes and pathways enriched in hypermutated gliomas in the merged DFCI-Profile/MSKCC-IMPACT dataset (n = 2,173) using a permutation test to control for random mutation rate in the setting of hypermutability. b, Response to temozolomide across a panel (n = 30) of native spheroid glioma PDCLs (blue, MMR-proficient; red, MMR-deficient). Dose–response curves were calculated using mean surviving fractions from three independent assays. c, Response to temozolomide and CCNU in the glioblastoma PDCL BT145 following knockout of MSH2, MSH6, MLH1 or PMS2 by CRISPR-Cas9. Dose–response curves were calculated using mean surviving fractions from three independent assays (mean ± s.e.m.). d, Number of signature 11 variants after chronic temozolomide treatment of the PDCL DIPG13 with MSH2 or MSH6 knockout by CRISPR-Cas9. Mutational signatures could not be called in the vehicle-treated samples (too few variants). e, Tumour volume (n = 8 mice per group) during treatment with vehicle (blue) or temozolomide (red) in BT145 patient-derived xenografts (PDXs). f, Number of signature 11 variants found after chronic temozolomide exposure in BT145 PDXs. Mutational signatures could not be called in the vehicle-treated tumours (too few variants). g, Schematic representation of BT145 PDXs clonal evolution under temozolomide exposure. Two independent secondary resistant tumours (Resistant 1 and 2) and one vehicle-treated tumour are represented. Resistant tumours had four private variants that were not detected in the vehicle-treated tumour: an MSH6(T1219I) mutation (VAF 0.27 and 0.37 for resistant 1 and 2, respectively), and three non-coding variants of NF1 (VAF 1.0 and 0.99), RAC1 (VAF 0.86 and 0.86) and RAF1 (0.44 and 0.56). HGG, high-grade glioma; Chr, chromosome.
Figure 3.
Figure 3.. Hypermutated and MMR-deficient gliomas harbour unique phenotypic and molecular characteristics including poor outcome and lack of MSI in bulk sequencing.
a, Survival of patients with recurrent high-grade glioma from the time of sample collection according to histomolecular group and TMB status (n = 333 recurrent samples; 238 from DFCI-Profile, 95 from MSKCC-IMPACT). Two-sided log-rank test. b, Quantification of tumour-infiltrating CD3-positive T-cells in CRC samples (n = 19). Left, representative low- and high-magnification images of CD3 immunolabelling (brown; intraepithelial lymphocytes, black arrowheads; stromal lymphocytes, black arrows) and nuclear counterstaining (blue). Dashed lines, border between tumour and stroma. Only intraepithelial lymphocytes were quantified. Scale bars; 100 μm (100×), 50 μm (200×). Right: boxes, quartiles; centre lines, median ratio for each group; whiskers, absolute range. Two-sided Wilcoxon rank-sum test. c, Quantification of tumour-infiltrating CD3-positive T-cells in gliomas according to their MMR status (n = 43). For each group, three areas with the maximal CD3 infiltration were selected for quantification (representative images, left). Scale bars: 500 μm (20×), 50 μm (200×). Right: boxes, quartiles; centre lines, median ratio for each group; whiskers, absolute range. Kruskal–Wallis test and Dunn’s multiple comparison test. d, TMB (top) and homopolymer indel burden (bottom) in hypermutated gliomas compared with other hypermutated cancers from the GENIE dataset. Tukey’s boxplots are shown. Two-sided Wilcoxon rank-sum test with Bonferroni correction. e, Pan-cancer analysis of cancer cell fractions in hypermutated gliomas (post-treatment) compared with other hypermutated cancers from the TCGA and ref. exome datasets (n = 798). One hundred non-hypermutated samples from the TCGA were randomly selected as controls. Boxes, quartiles; centre lines, median ratio for each group; whiskers, absolute range excluding outliers. Two-sided Wilcoxon rank-sum test with Bonferroni correction. f, Workflow for scWGS and bulk tumour DNA sequencing. g, Single-cell sequencing estimate of the number of G:C>A:T transitions at NCC and NCT trinucleotide contexts in 63 cells from a glioblastoma patient with post-temozolomide hypermutation using 1× scWGS sequencing. Error bars show 95% CI. The absolute computed purity was 0.66 for the primary tumour sample and 0.47 for the recurrent tumour sample in the bulk sequencing. h, Single-cell sequencing estimate of microsatellite mutation rate in eight cells from a patient with glioblastoma with post-temozolomide hypermutation. Eight cells were analysed for the presence of MSI using 10× scWGS sequencing. WGA, whole genome amplification; QC, quality control; nucl, nuclei; seq, sequencing.
Figure 4.
Figure 4.. Treatment of Hypermutated Gliomas with PD-1 Blockade.
a, b, Best radiological response (a, measured as the best change in the sum of the products of perpendicular diameters of target lesions), and overall survival (b) of 11 patients with hypermutated and MMR-deficient gliomas who were treated with PD-1 blockade. A cohort of patients with non-hypermutated gliomas who were treated with PD-1 blockade is depicted as control (n = 10, best matches according to diagnosis, primary versus recurrent status, and prior treatments). Two-sided log-rank test. c, Proposed model explaining differential response to PD-1 blockade in MMR-deficient CRCs and gliomas. In CRCs (top), MMR deficiency is acquired early in pre-cancerous cells, creating mutations and indels at homopolymer regions. Over time, clonal neoantigens of both types emerge and strong immune infiltrates are seen at diagnosis. Treatment with anti-PD-1 results in expansion of T cells that recognize these clonal neoantigens and substantial antitumour responses. In gliomas (bottom), few mutations are acquired early during tumorigenesis in the majority of tumours. Temozolomide drives the expansion of cells with MMR deficiency and late accumulation of random temozolomide-induced mutations. Ineffective antitumour responses may result from poor neoantigen quality (high burden of missense mutations versus frameshift-producing indels) and high subclonality associated with an immunosuppressive microenvironment. In some tumours, MMR-proficient subclones that have acquired therapy resistance through other pathways can co-exist with MMR-deficient subclones, giving rise to a mixed phenotype.

Comment in

References

    1. Hunter C. et al. A hypermutation phenotype and somatic MSH6 mutations in recurrent human malignant gliomas after alkylator chemotherapy. Cancer Res. 66, 3987–3991 (2006). - PMC - PubMed
    1. Cancer Genome Atlas Research Network. Comprehensive genomic characterization defines human glioblastoma genes and core pathways. Nature 455, 1061–1068 (2008). - PMC - PubMed
    1. Johnson BE et al. Mutational analysis reveals the origin and therapy-driven evolution of recurrent glioma. Science 343, 189–193 (2014). - PMC - PubMed
    1. Wang J. et al. Clonal evolution of glioblastoma under therapy. Nat. Genet 48, 768–776 (2016). - PMC - PubMed
    1. Barthel FP et al. Longitudinal molecular trajectories of diffuse glioma in adults. Nature 576, 112–120 (2019). - PMC - PubMed

MeSH terms

Substances