. 2020 Apr;580(7804):511-516.
doi: 10.1038/s41586-020-2199-7. Epub 2020 Apr 15.

The gut-brain axis mediates sugar preference

Affiliations

The gut-brain axis mediates sugar preference

Hwei-Ee Tan et al. Nature. 2020 Apr.

Abstract

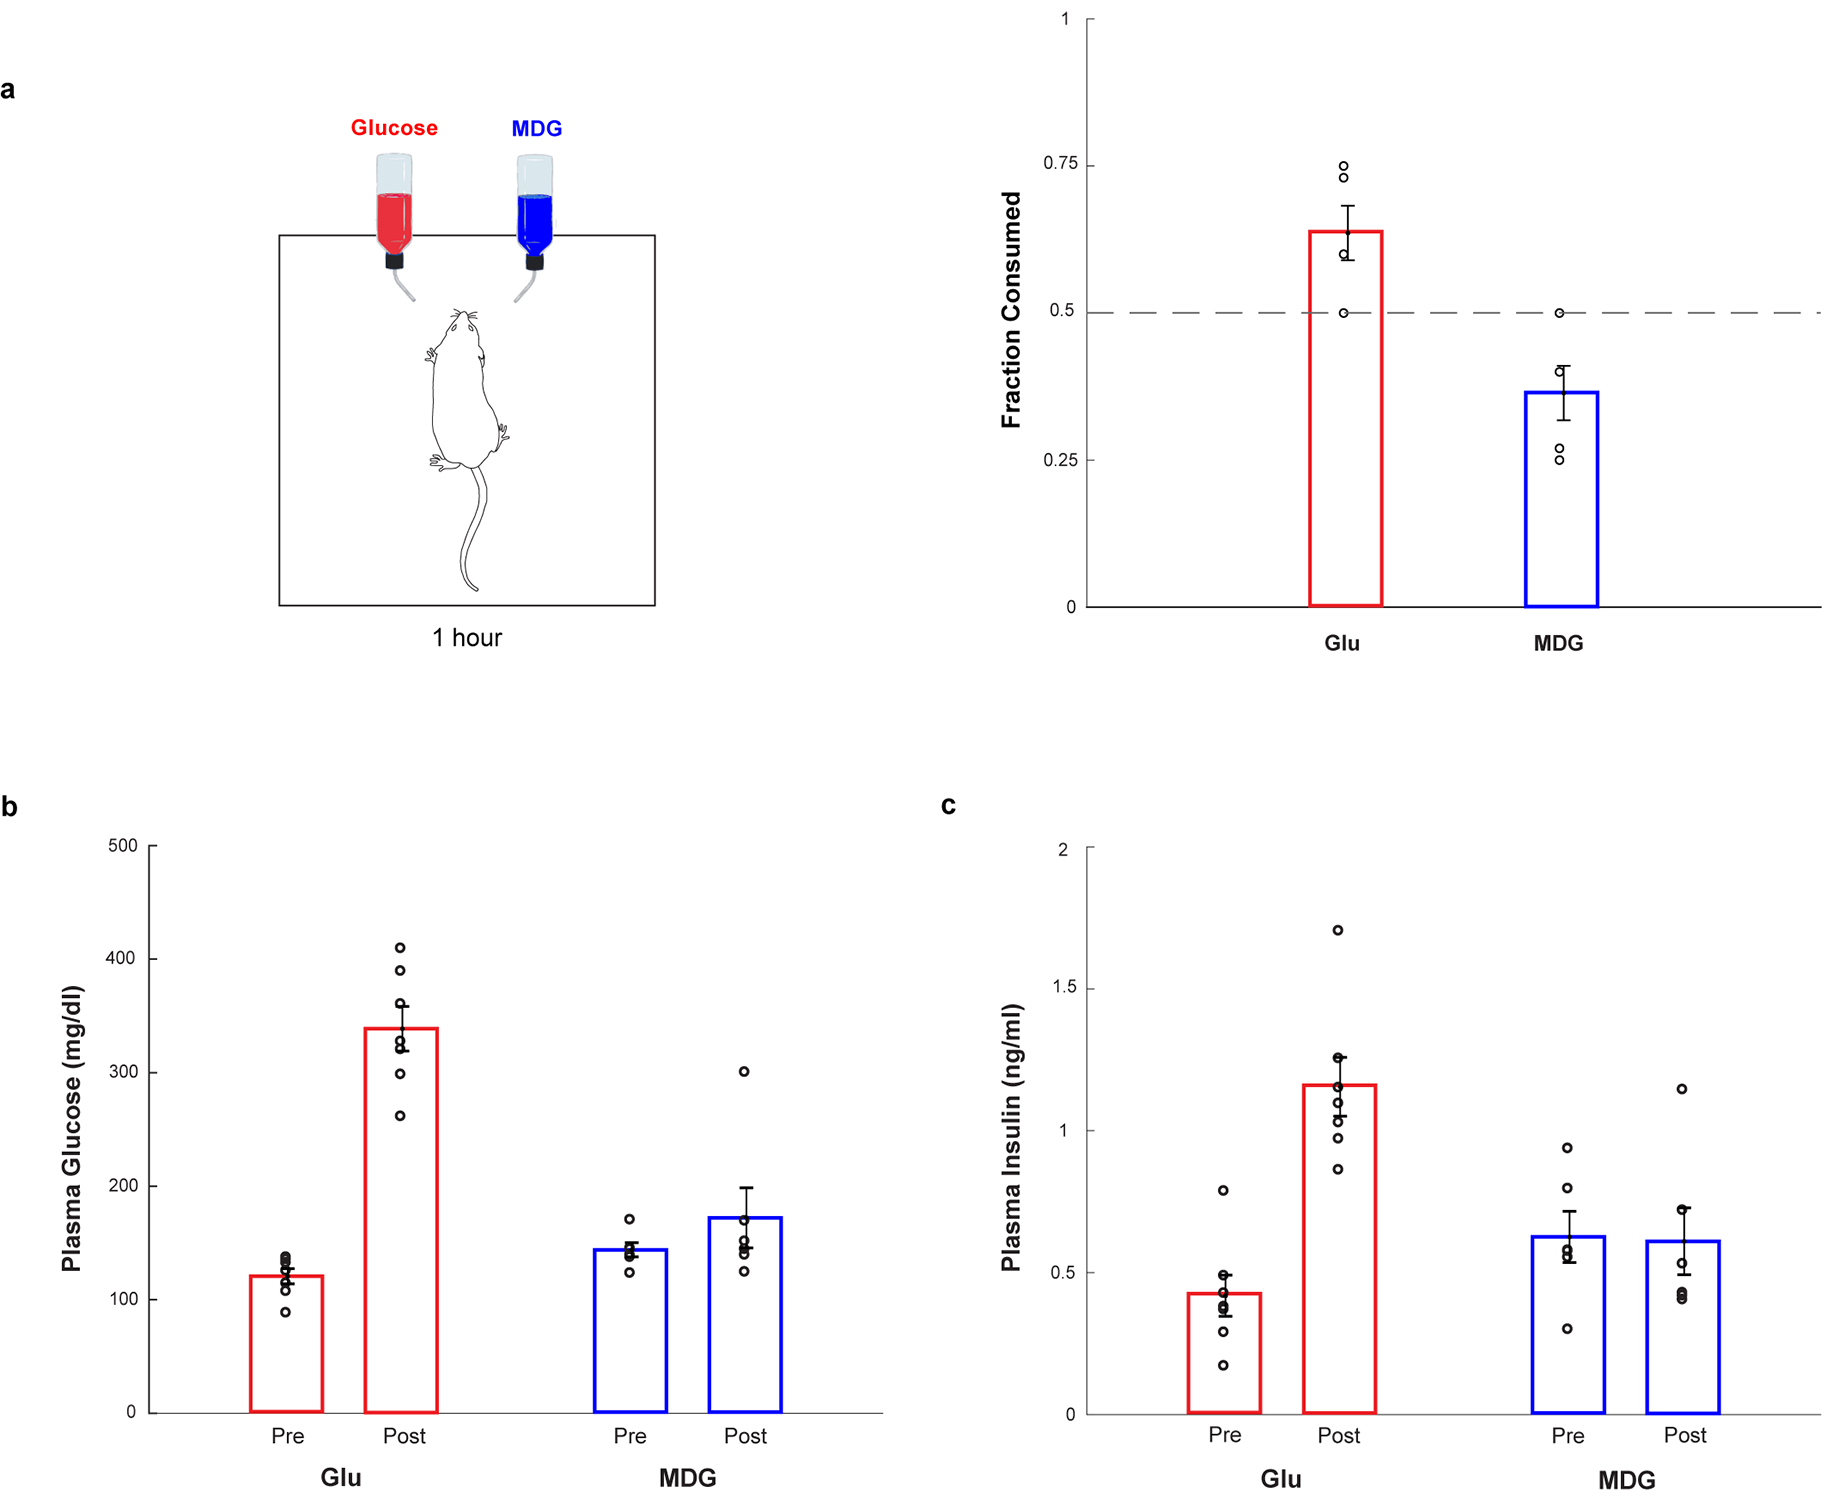
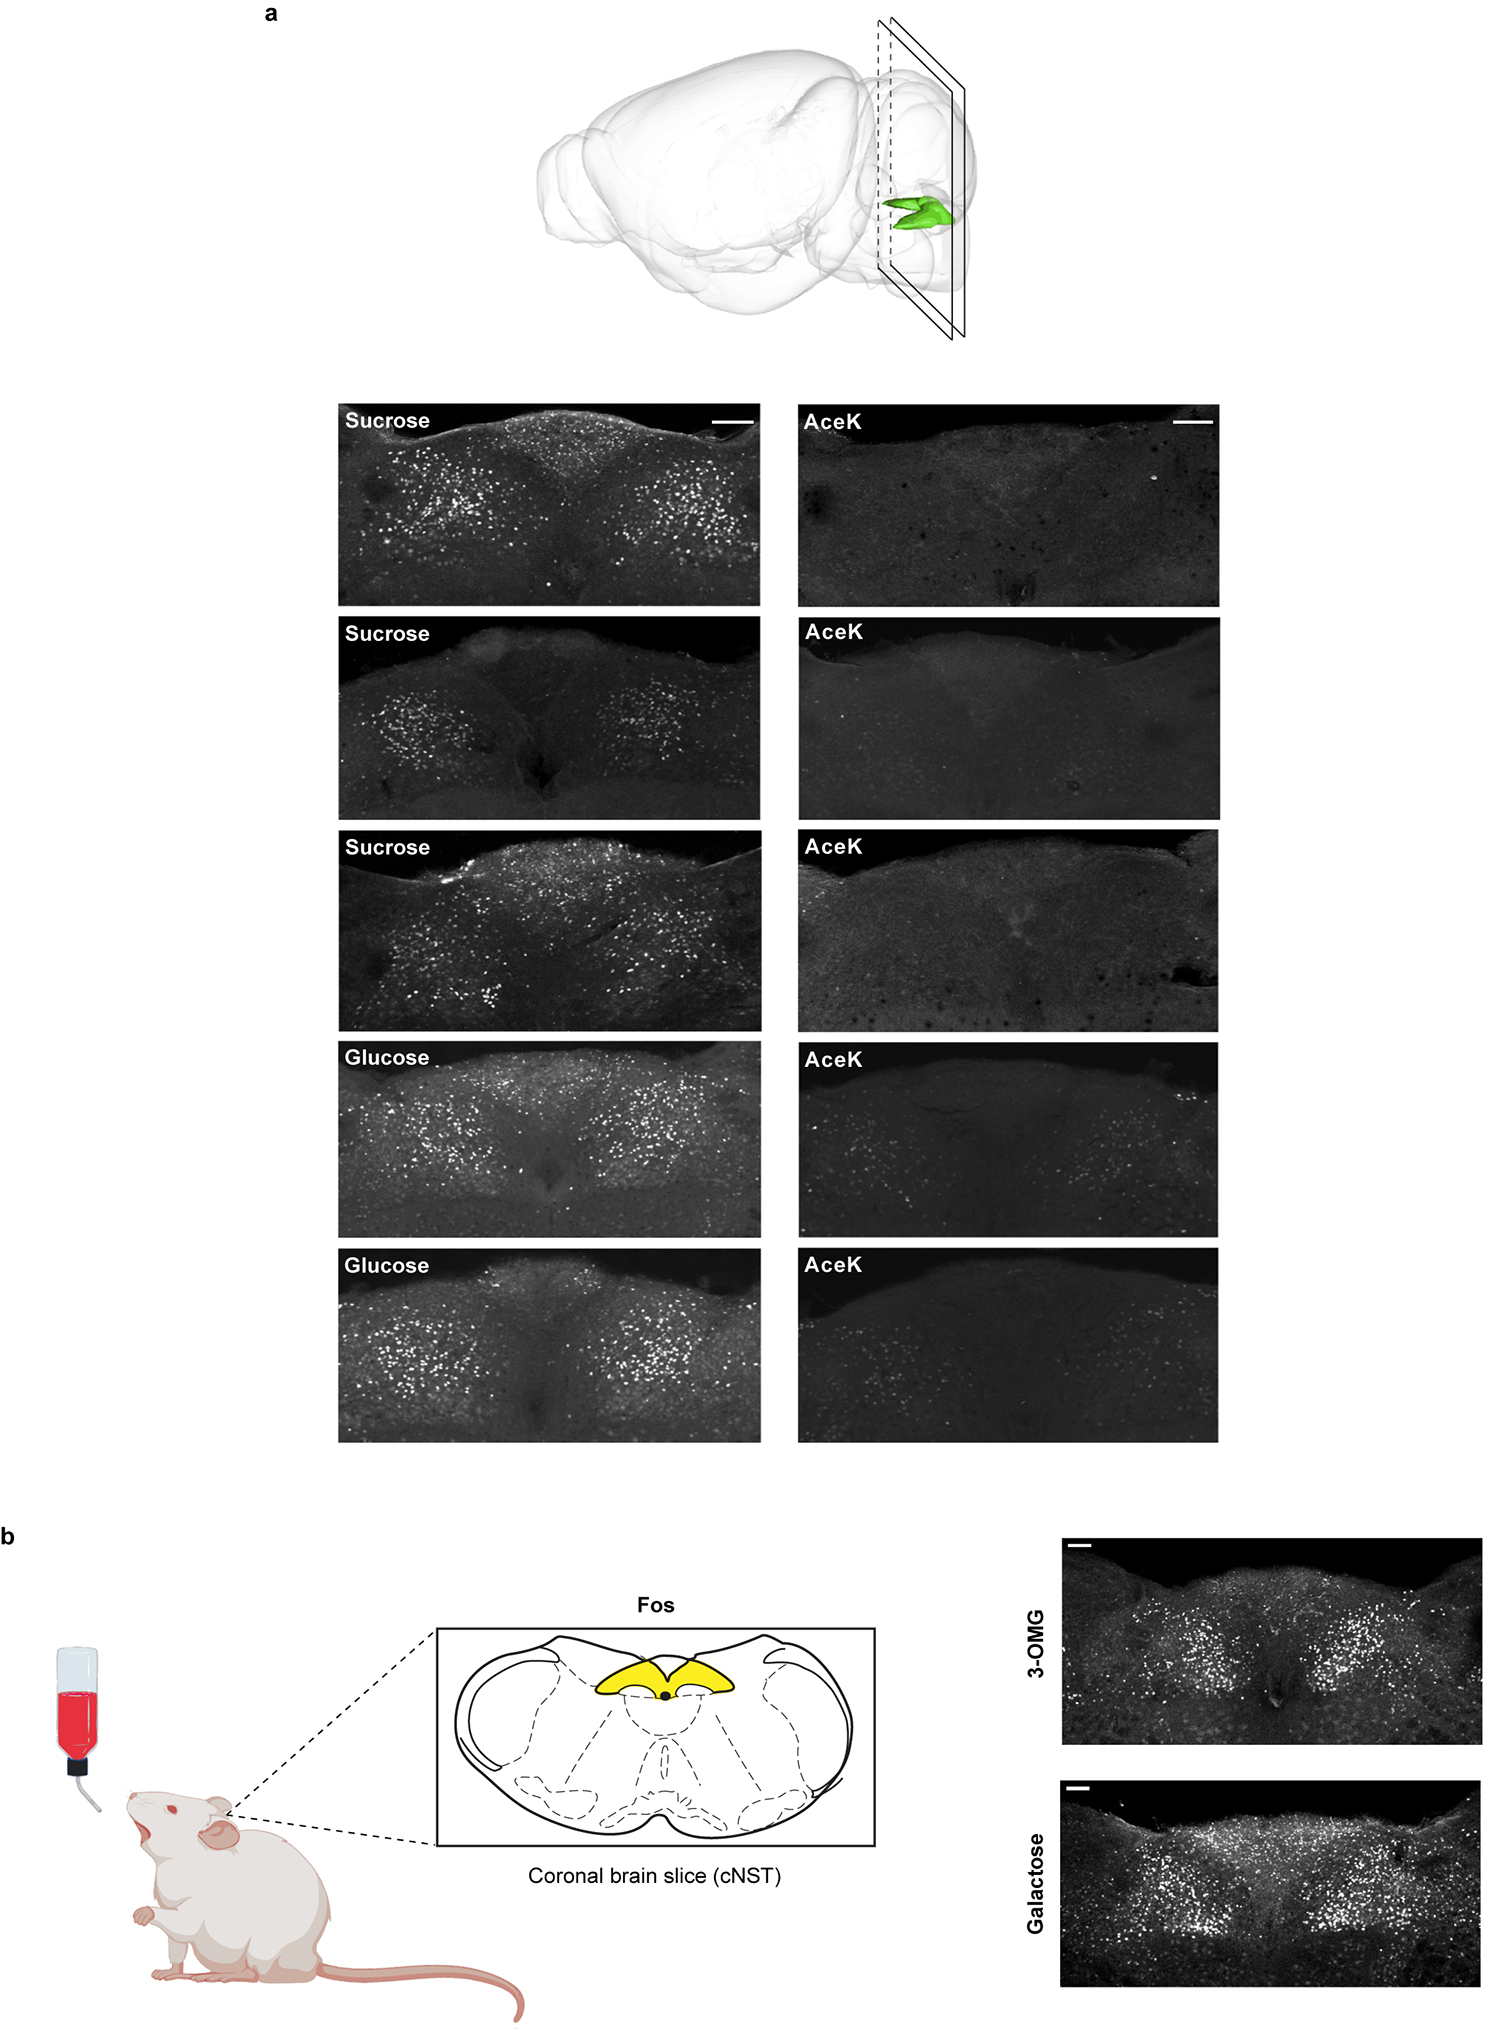
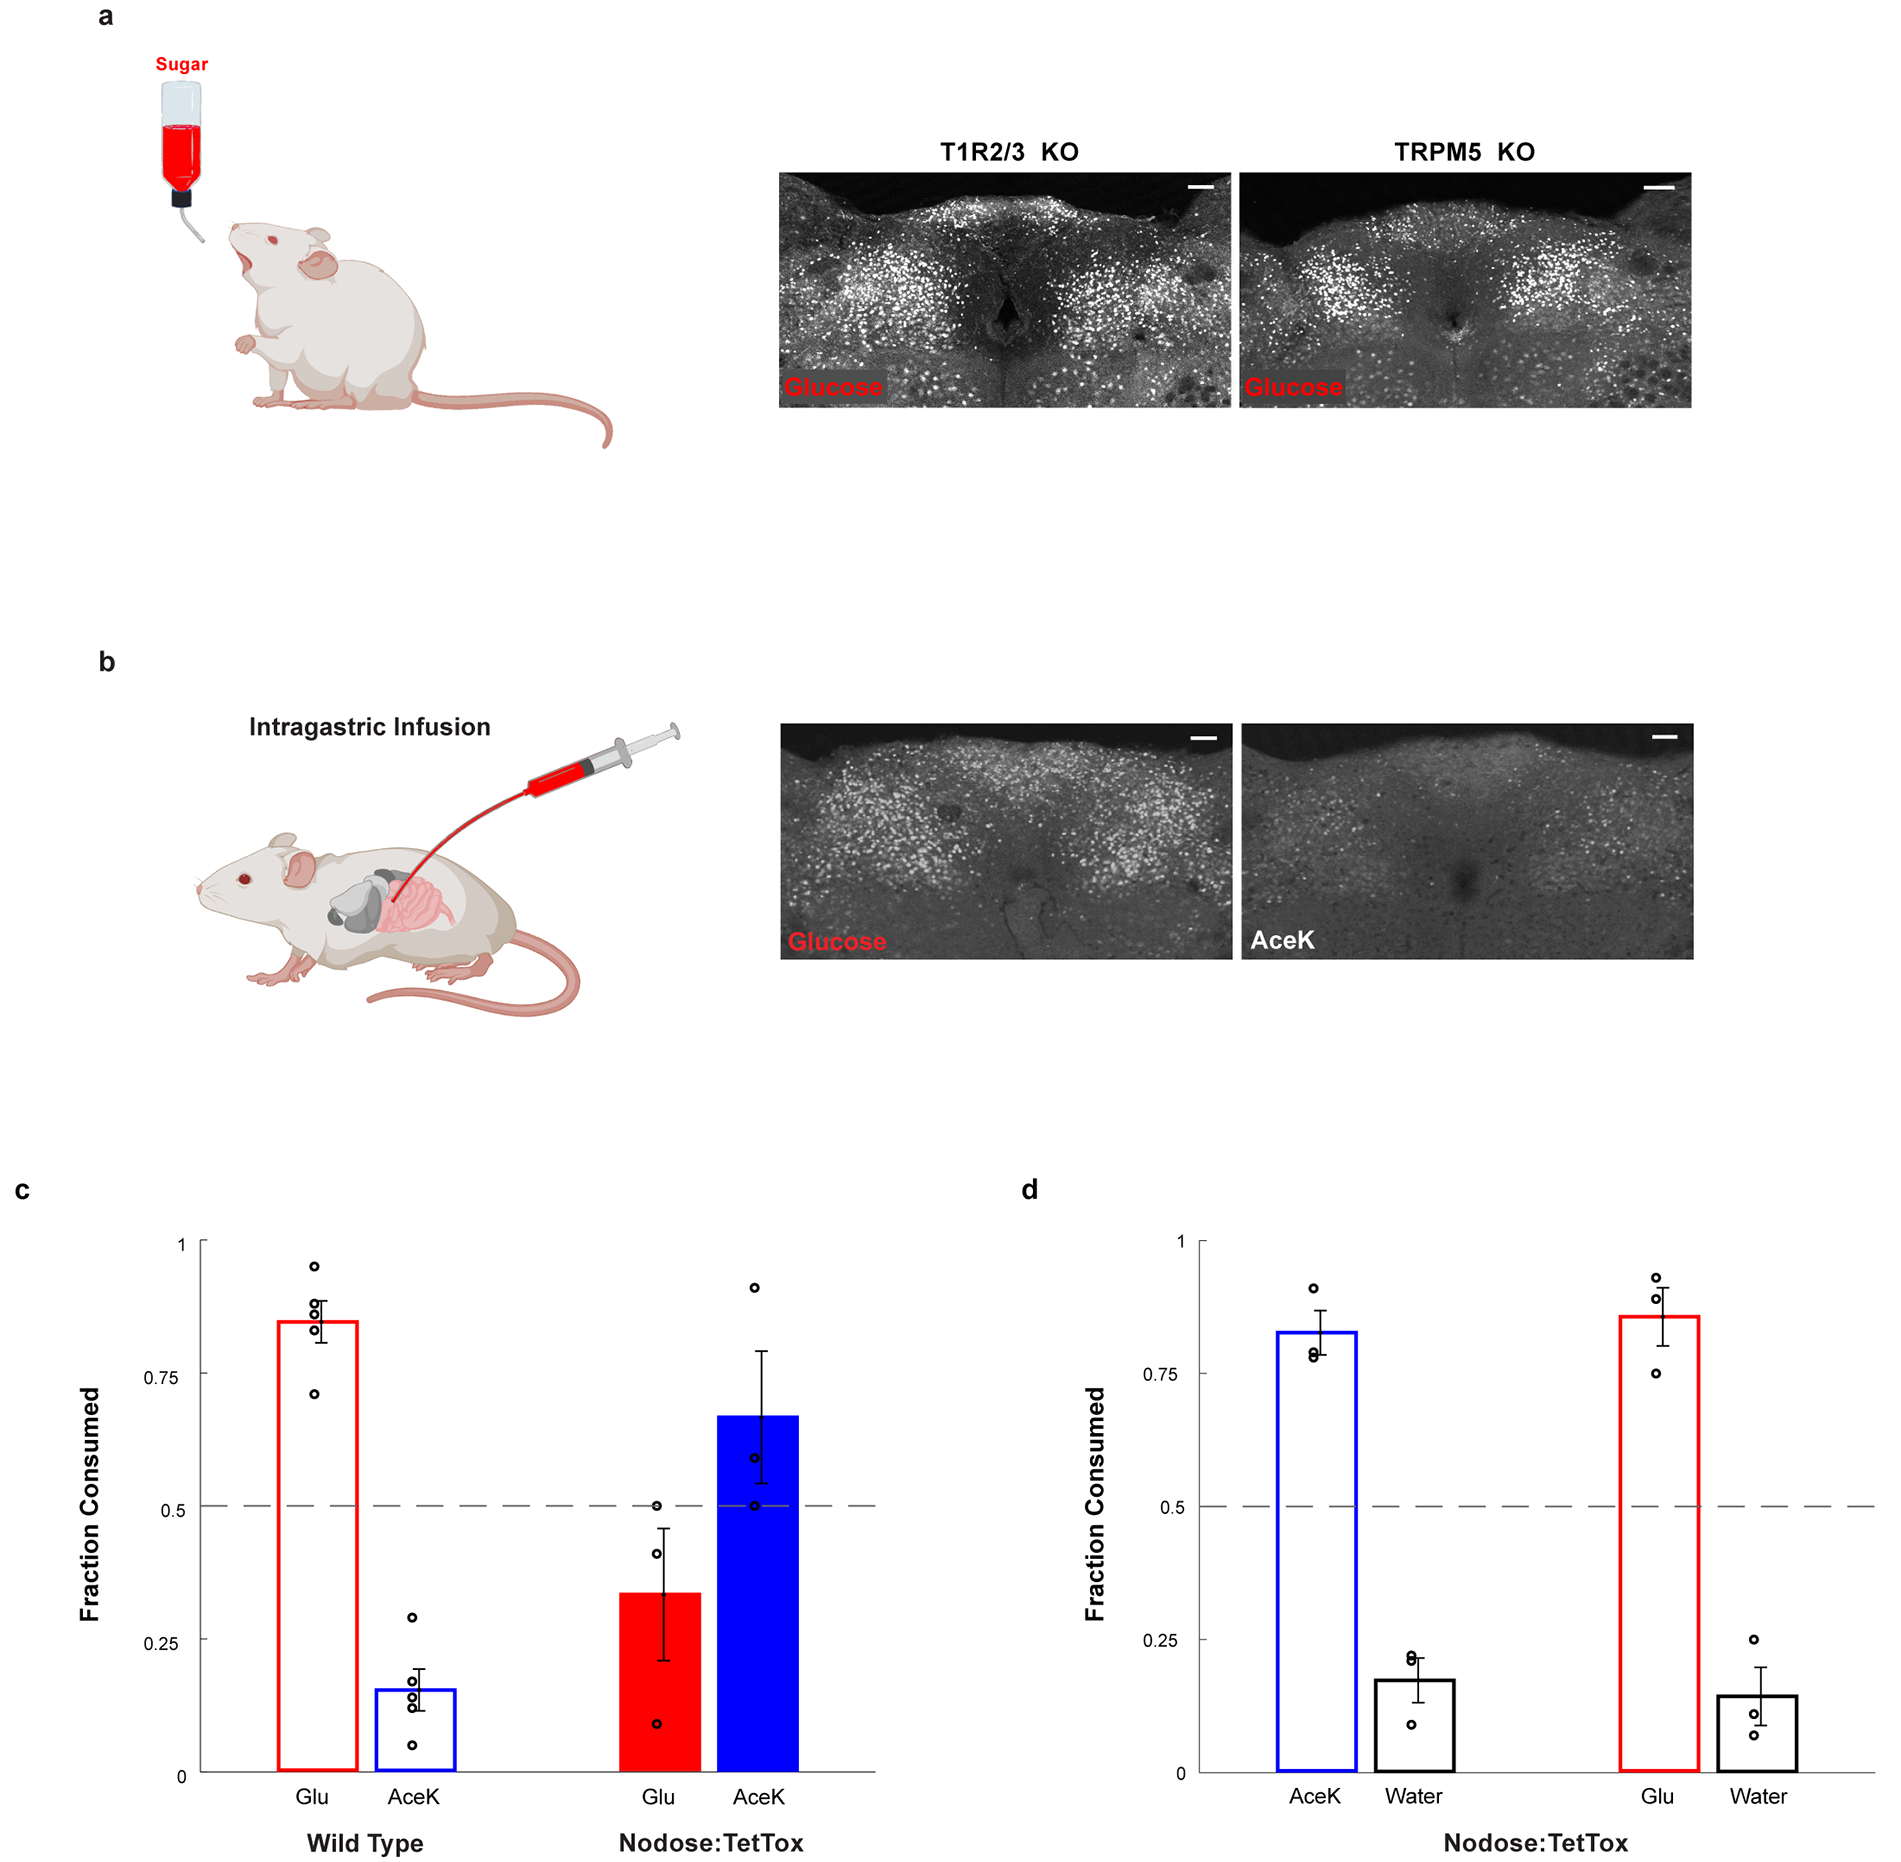
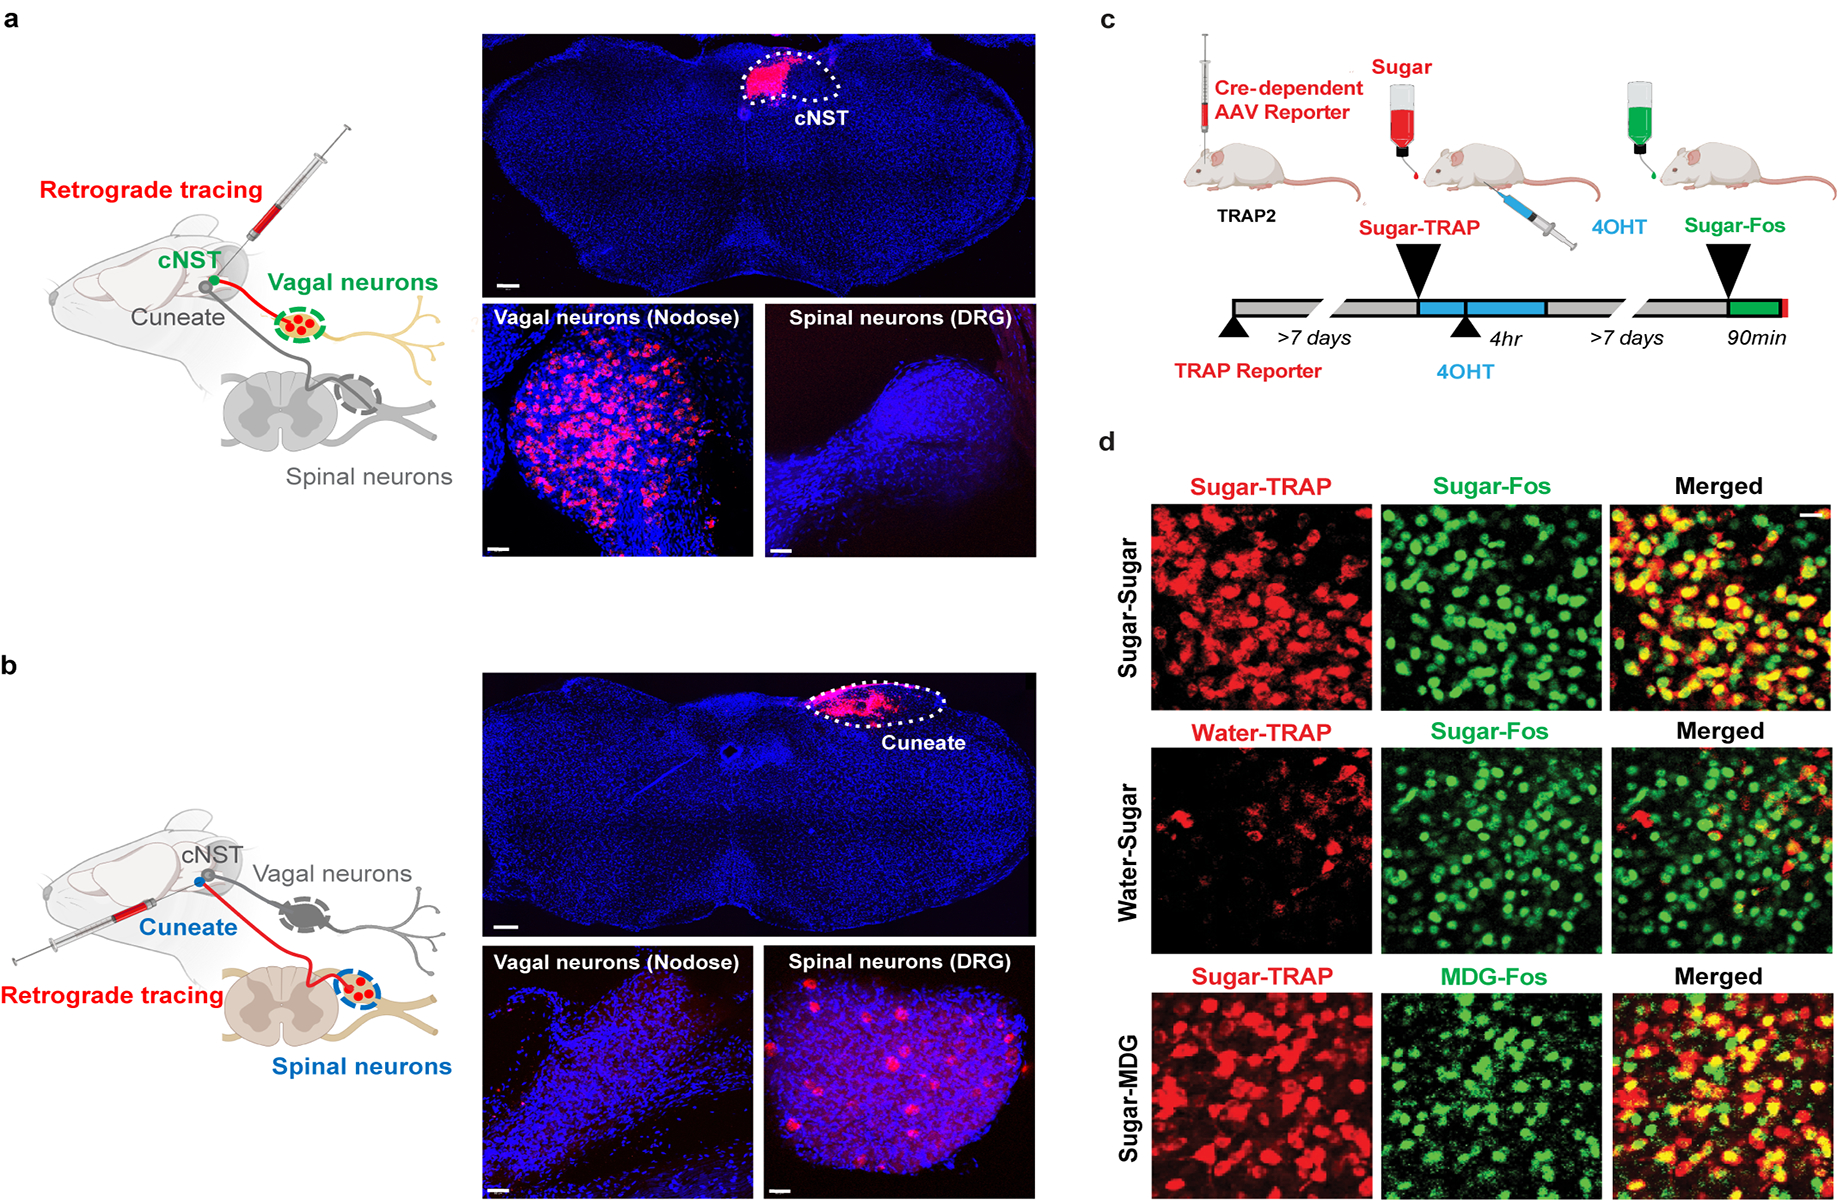
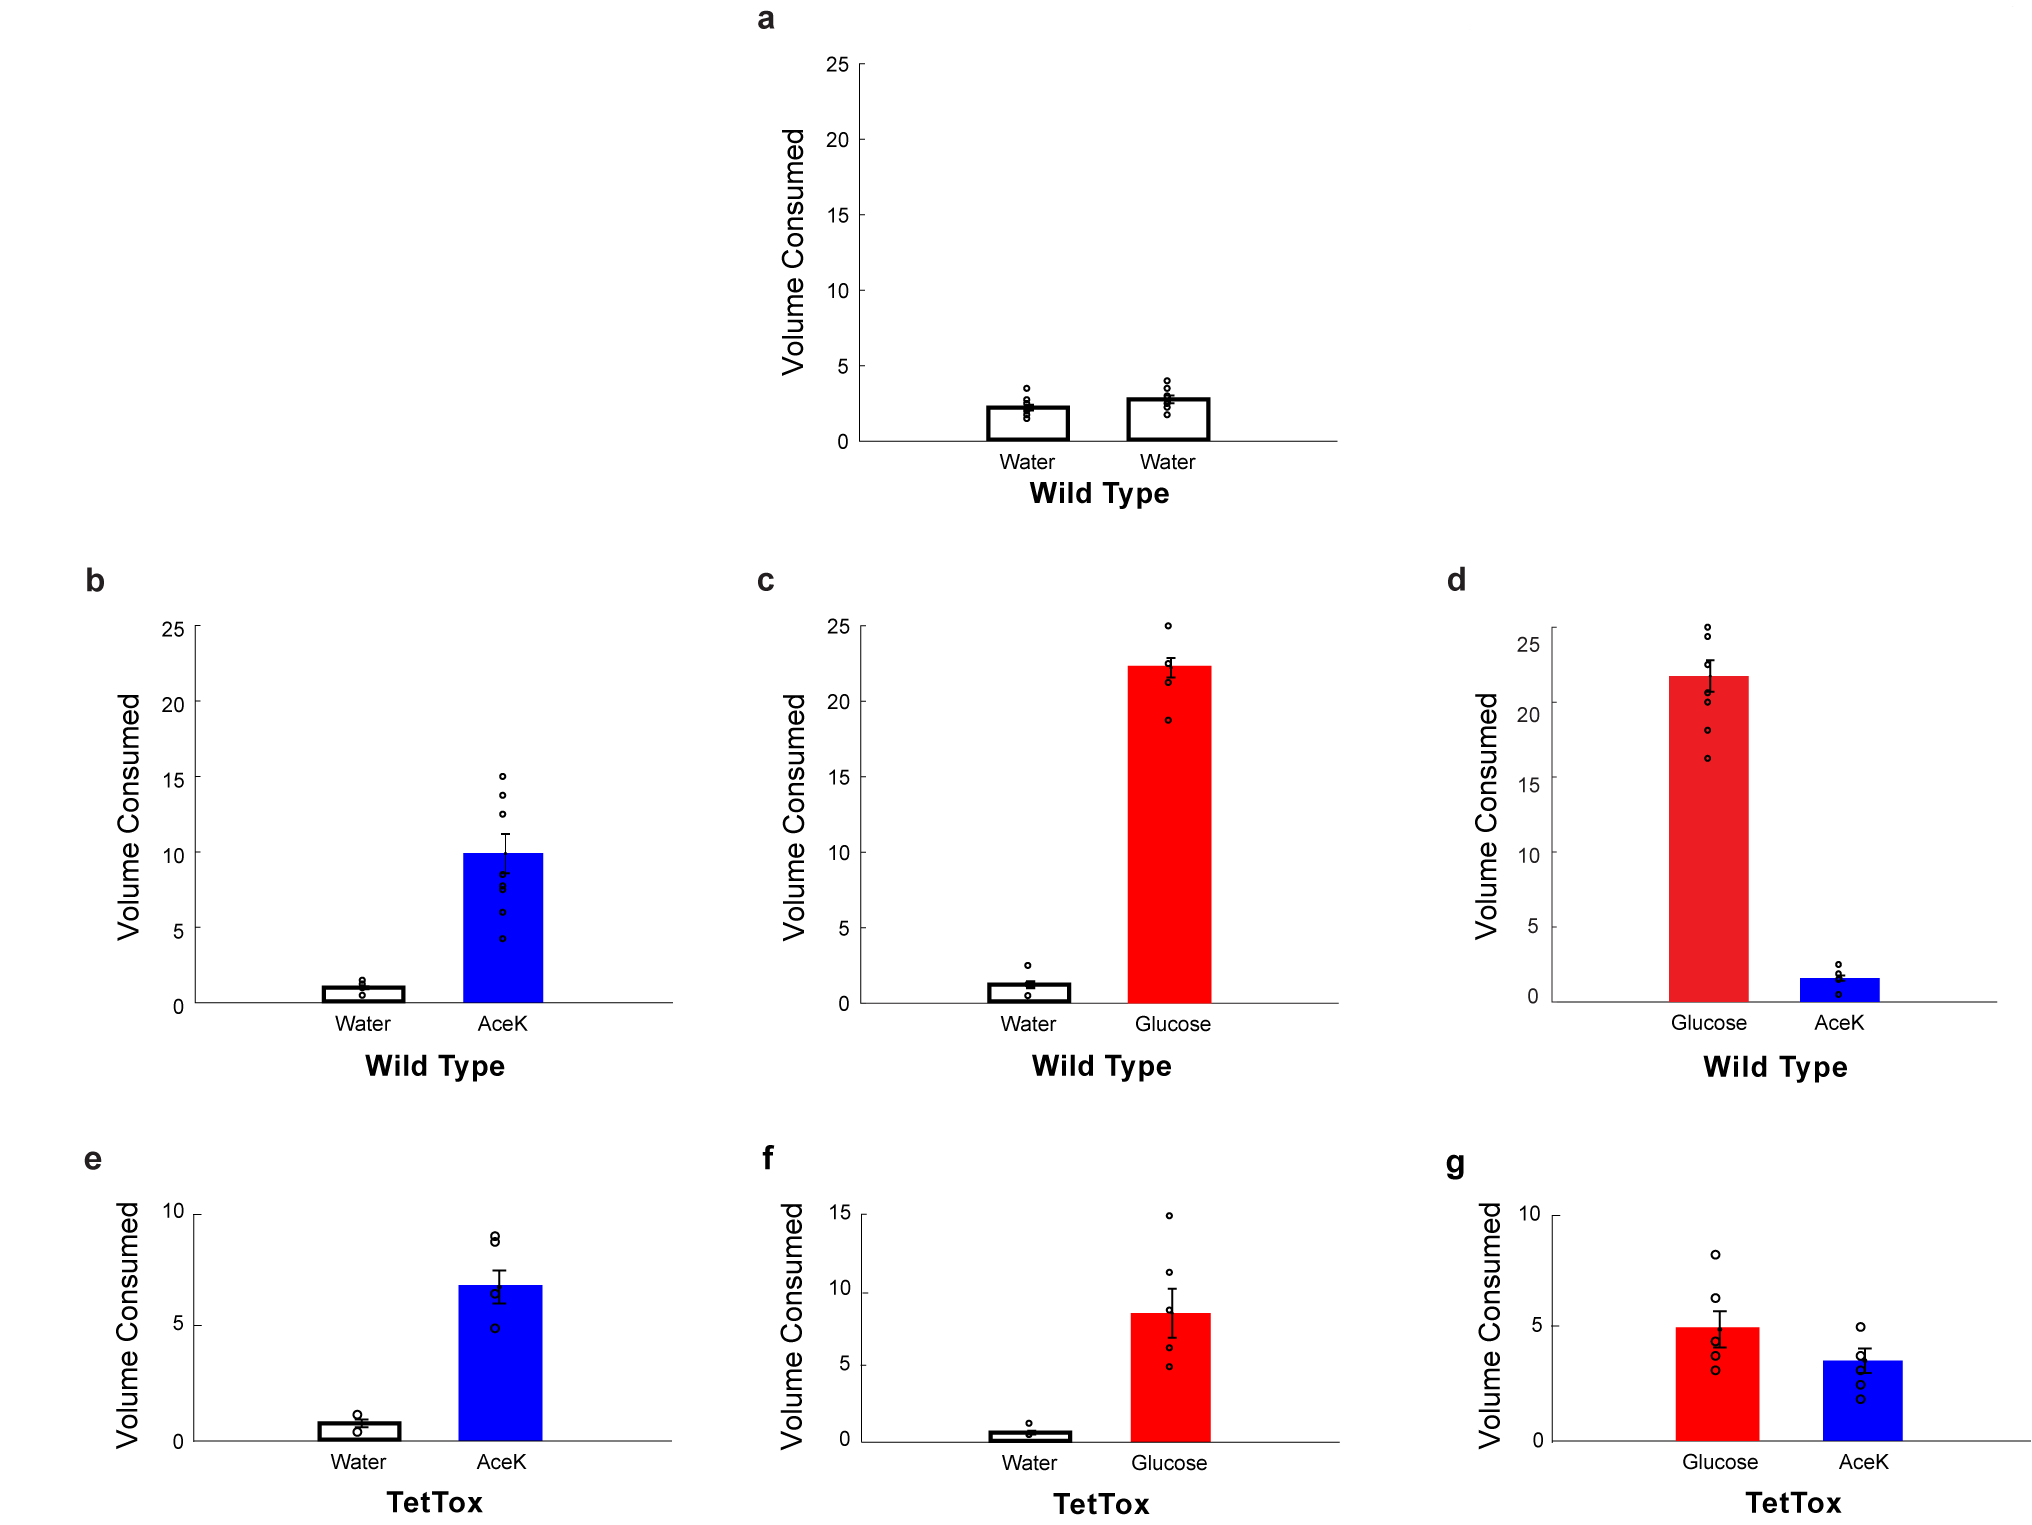
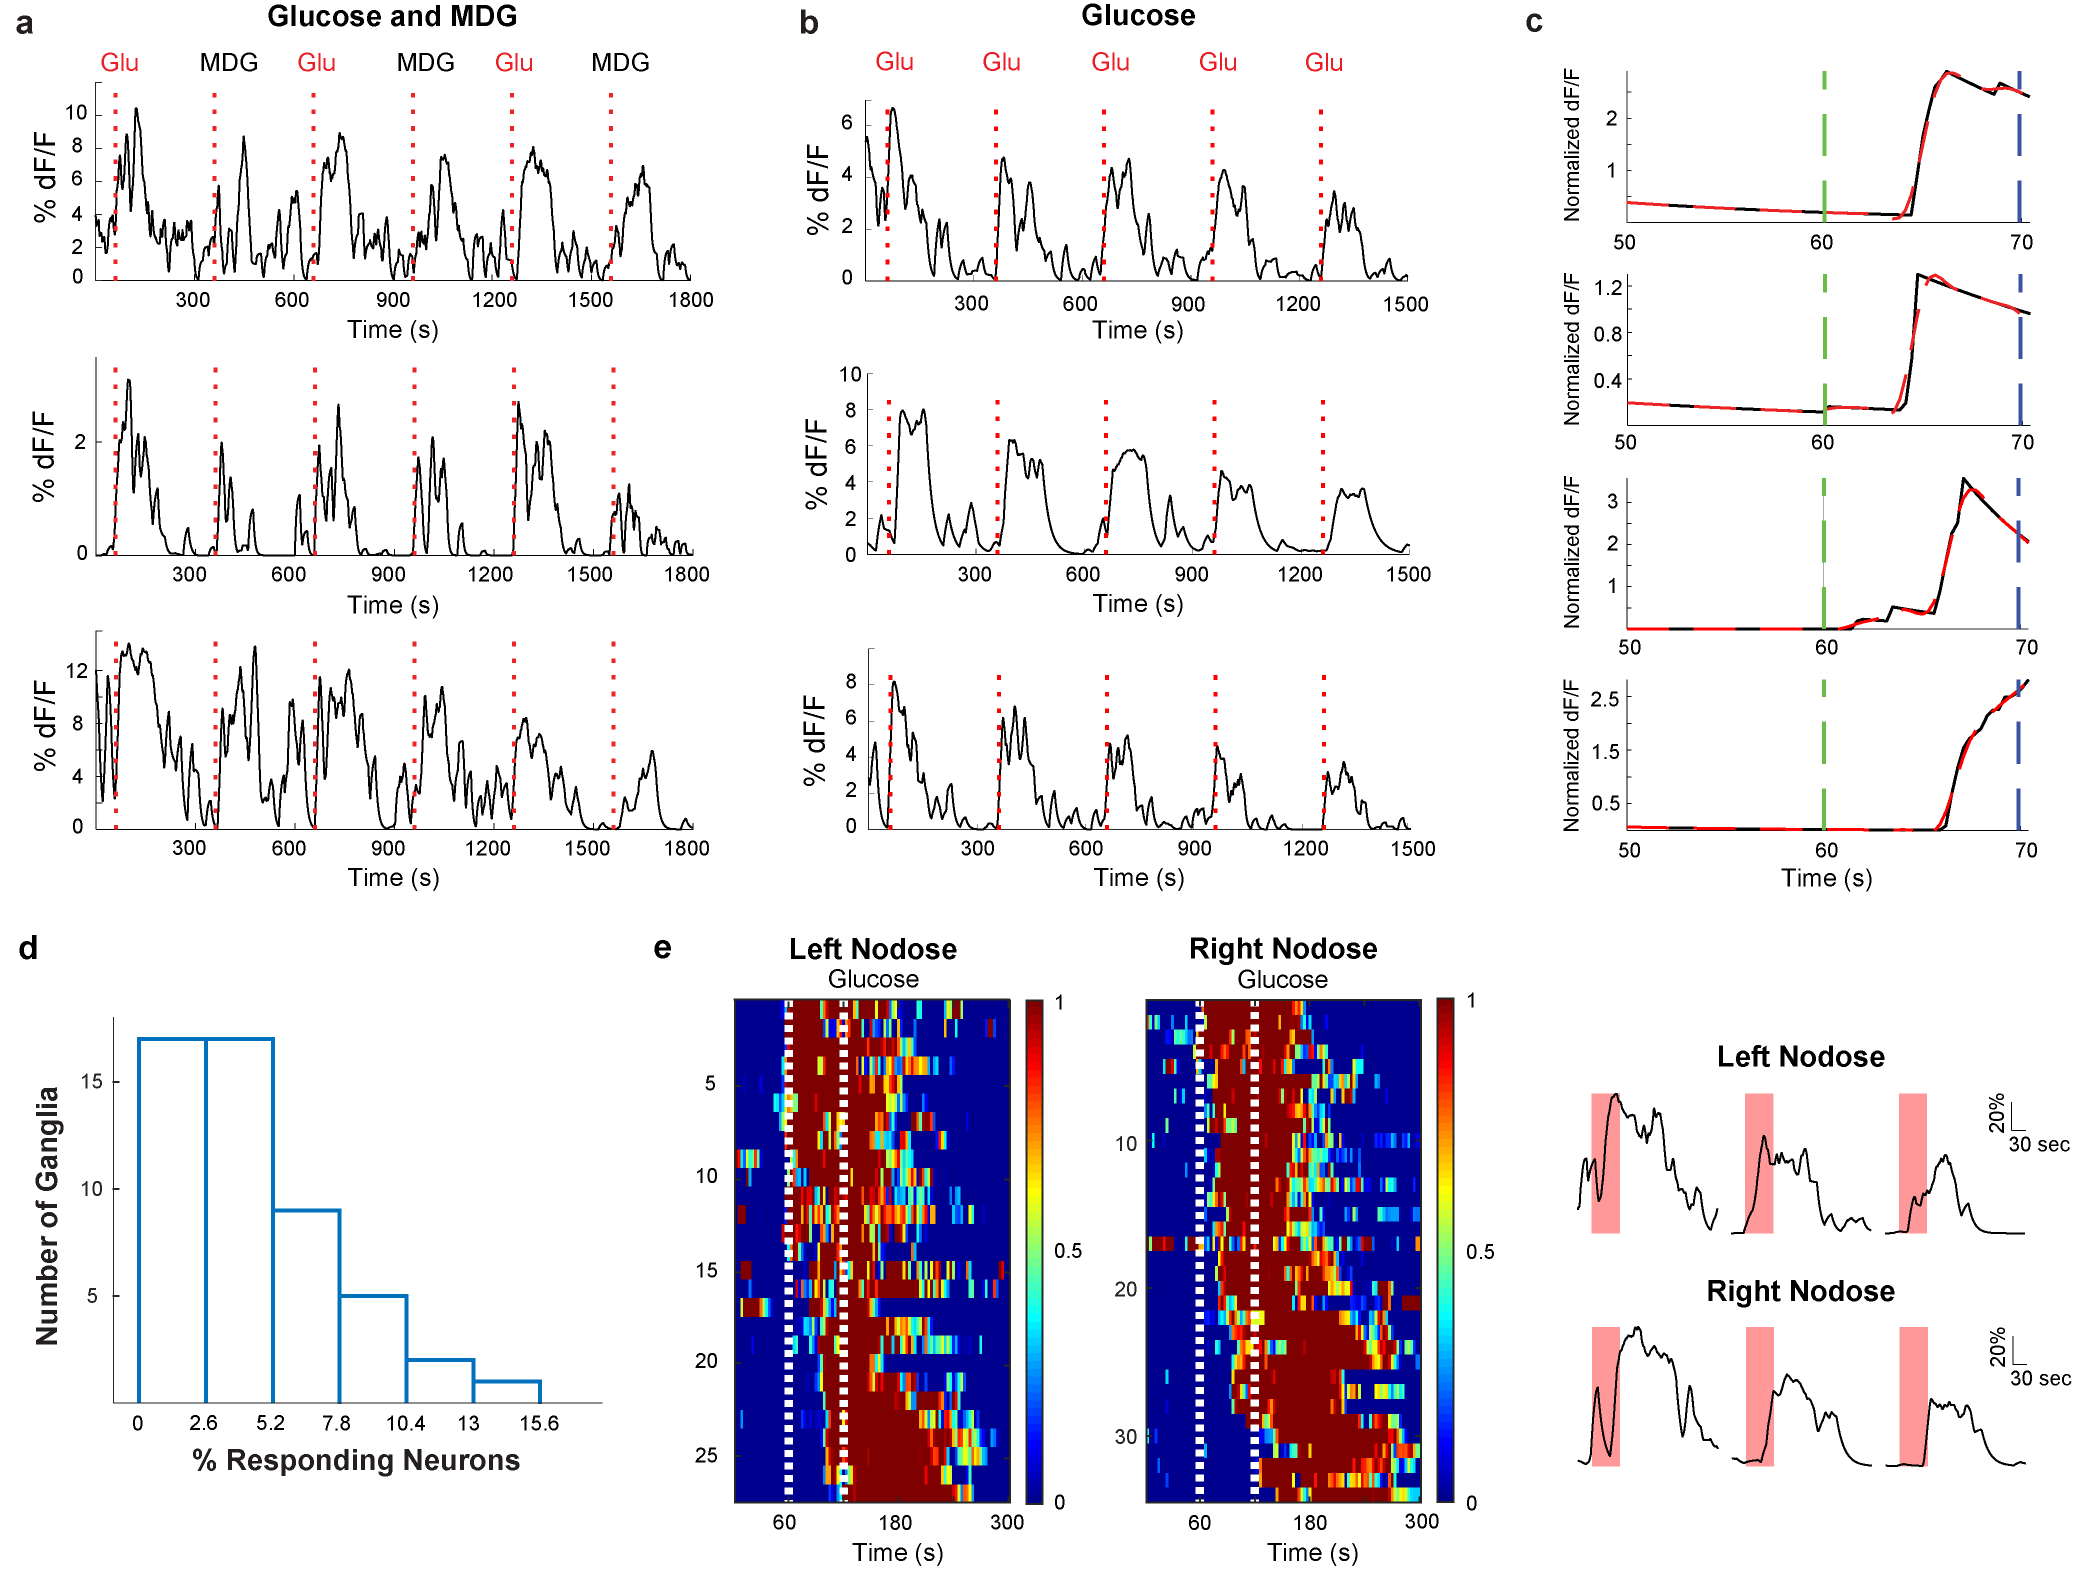
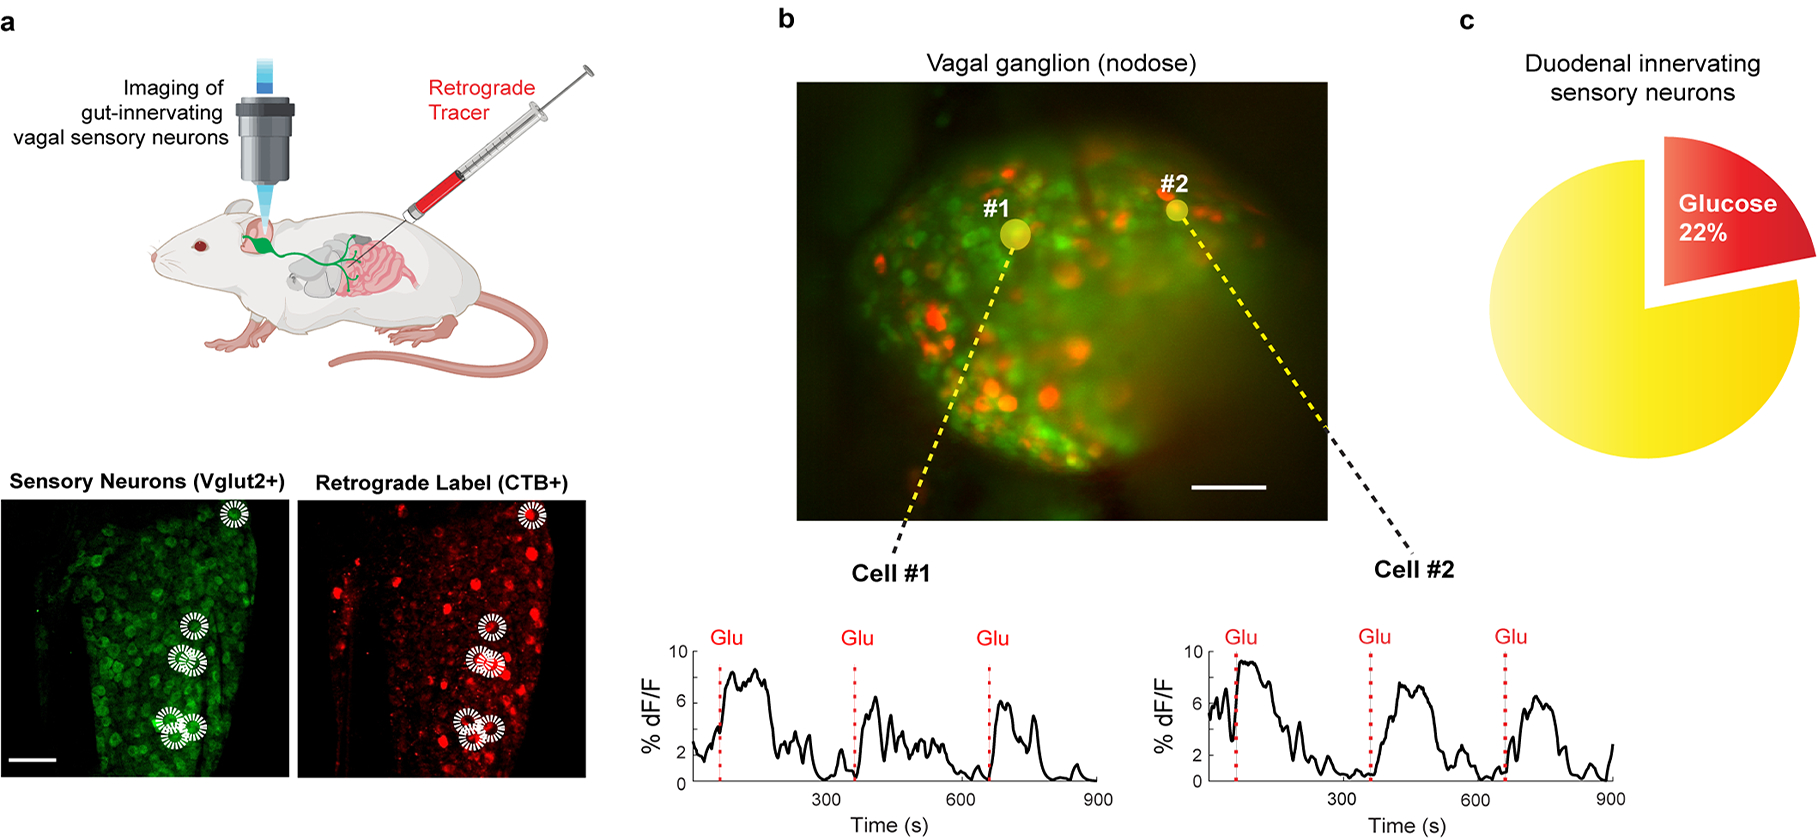
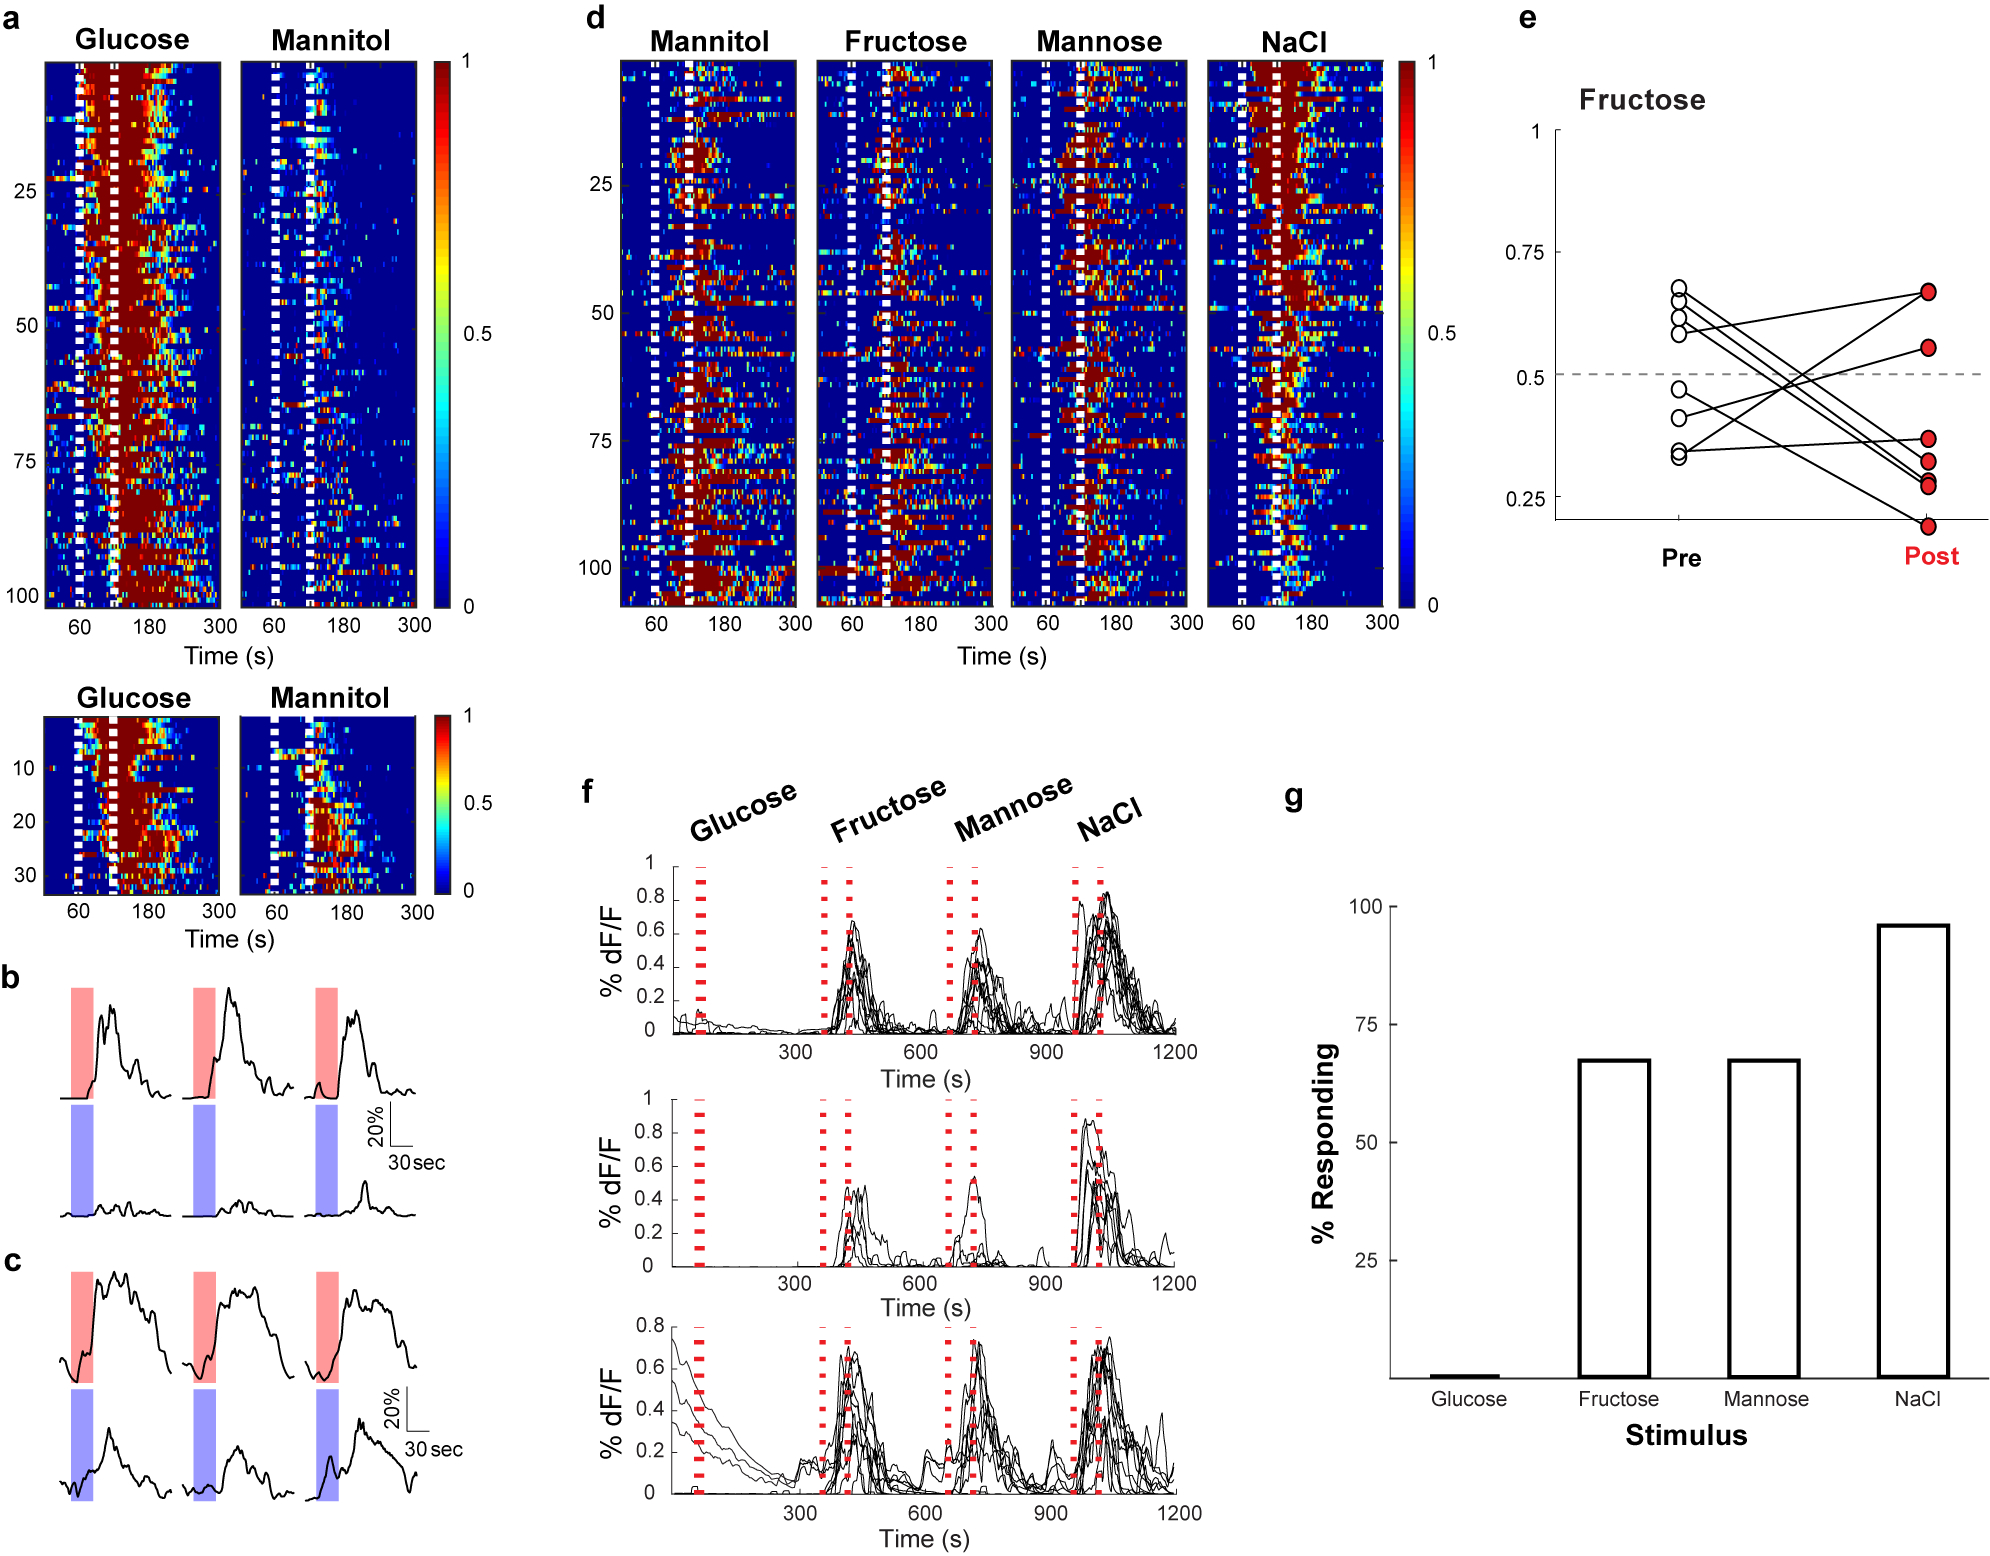
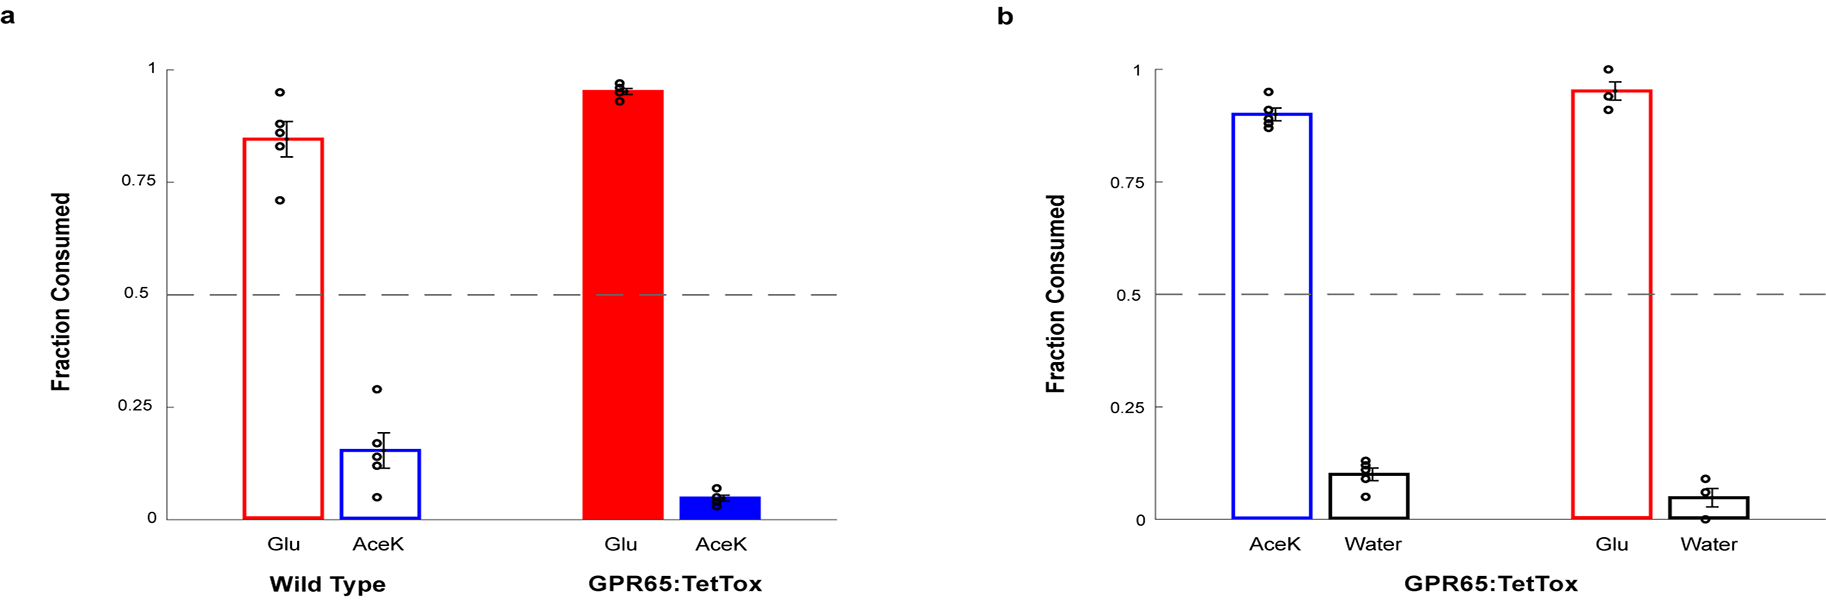
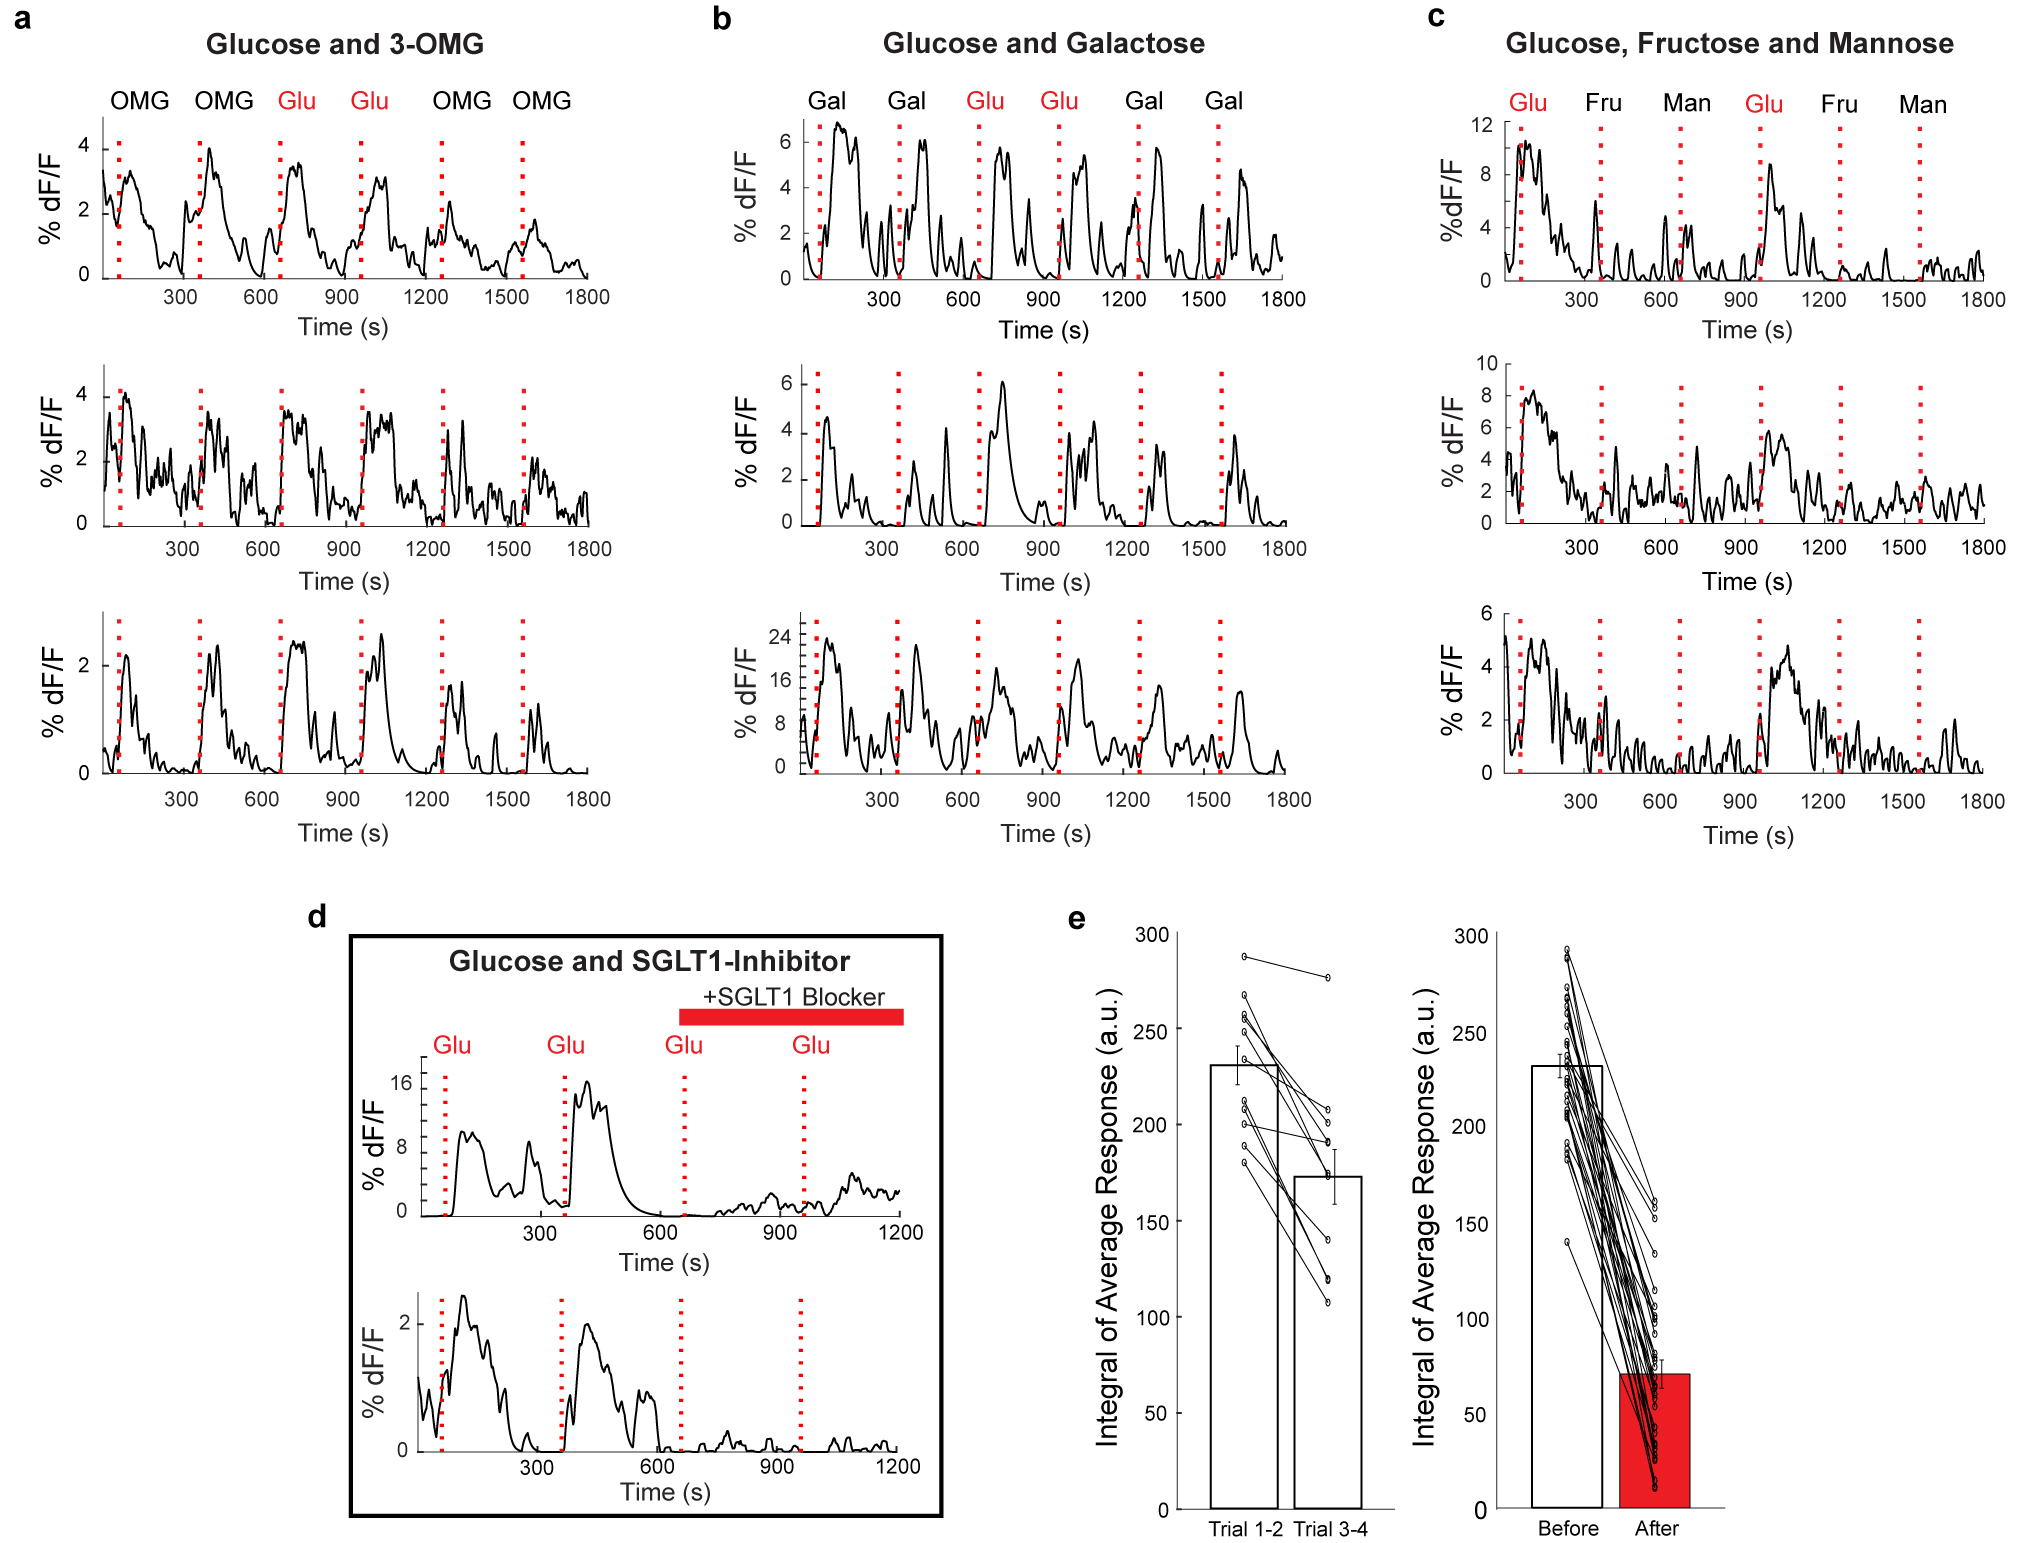
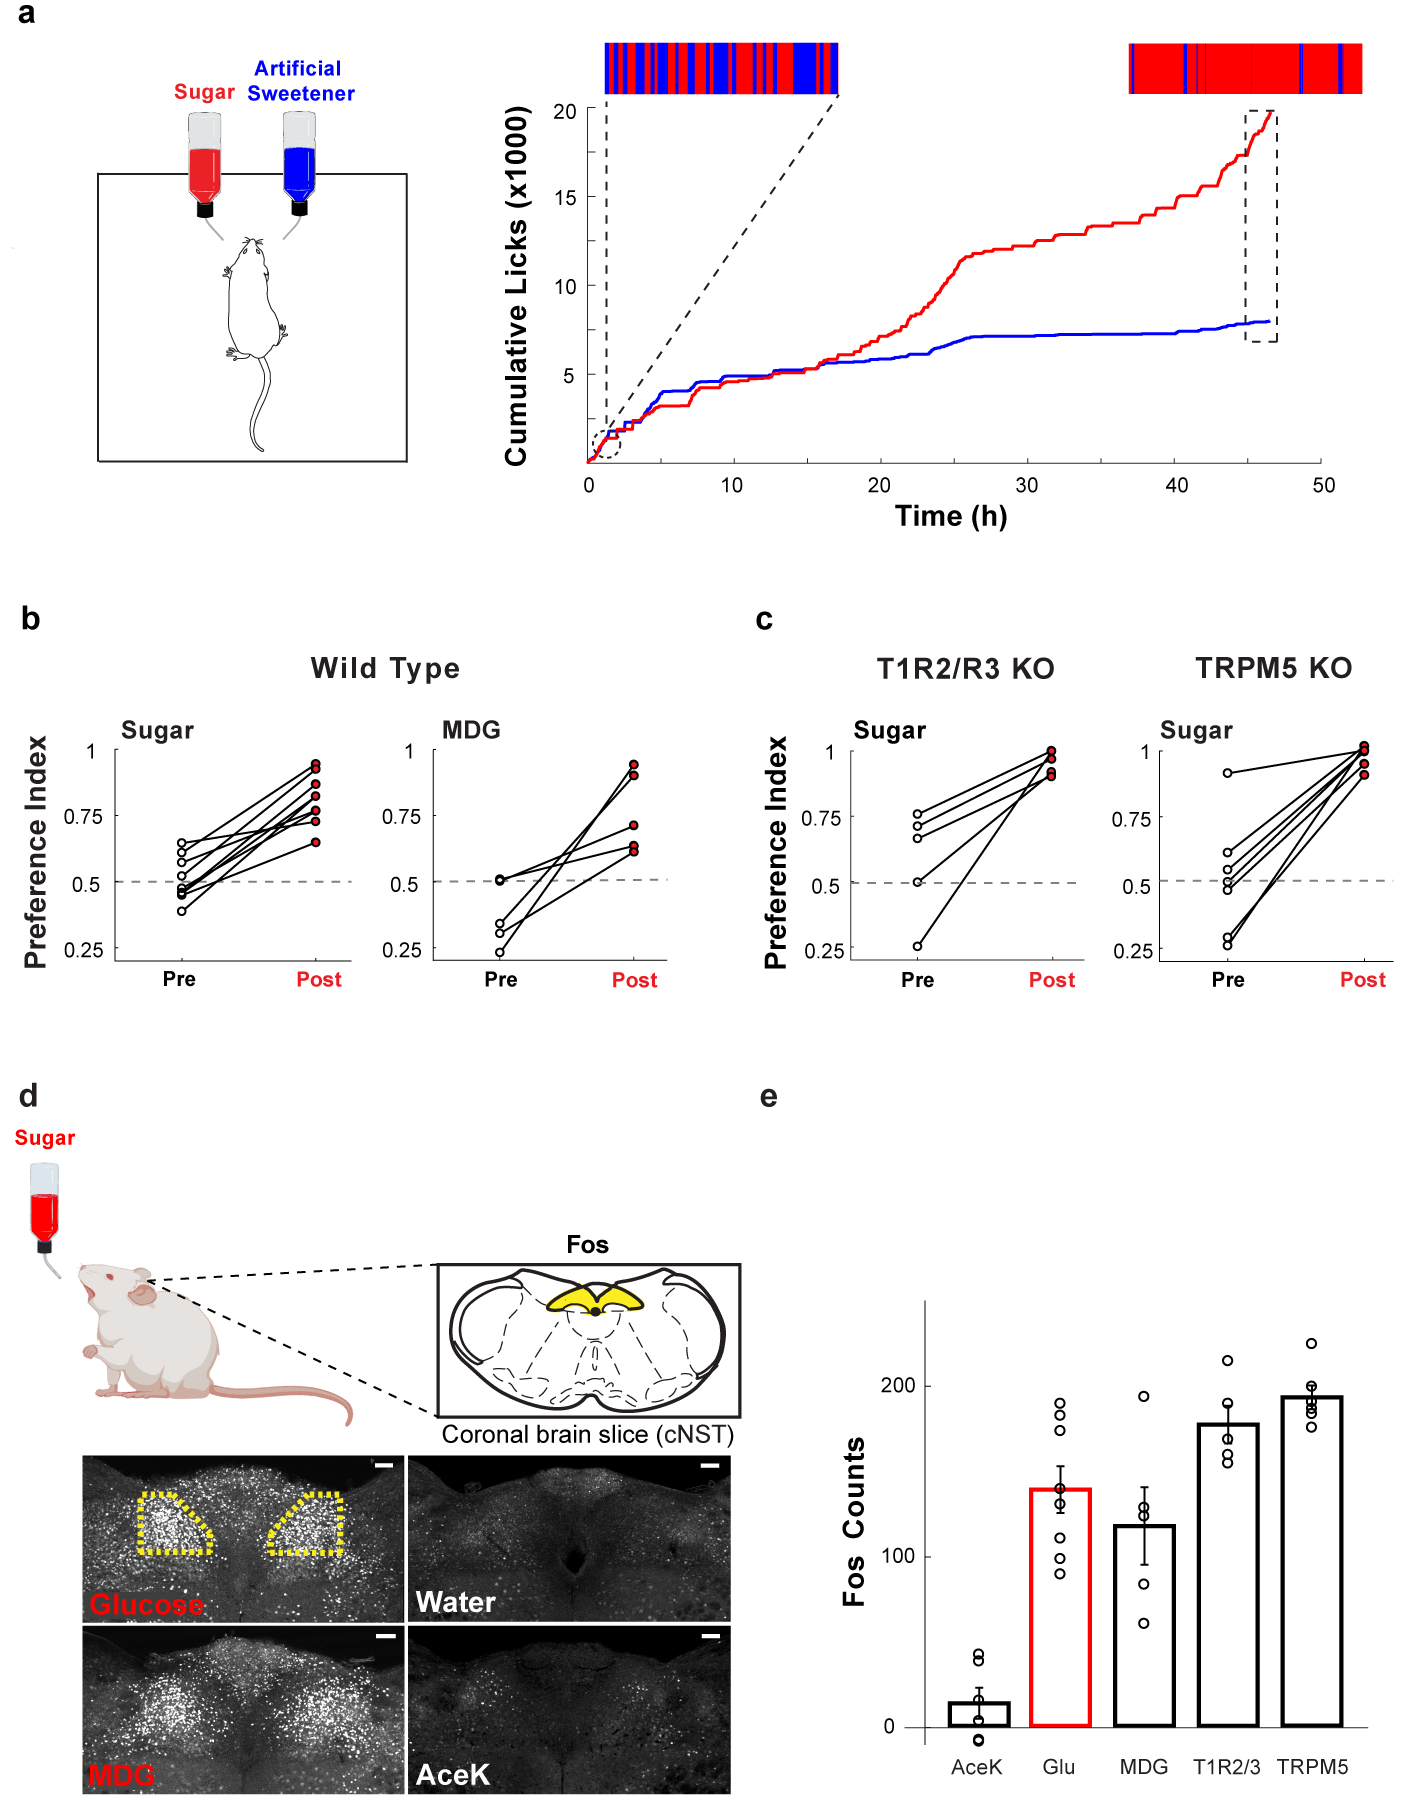
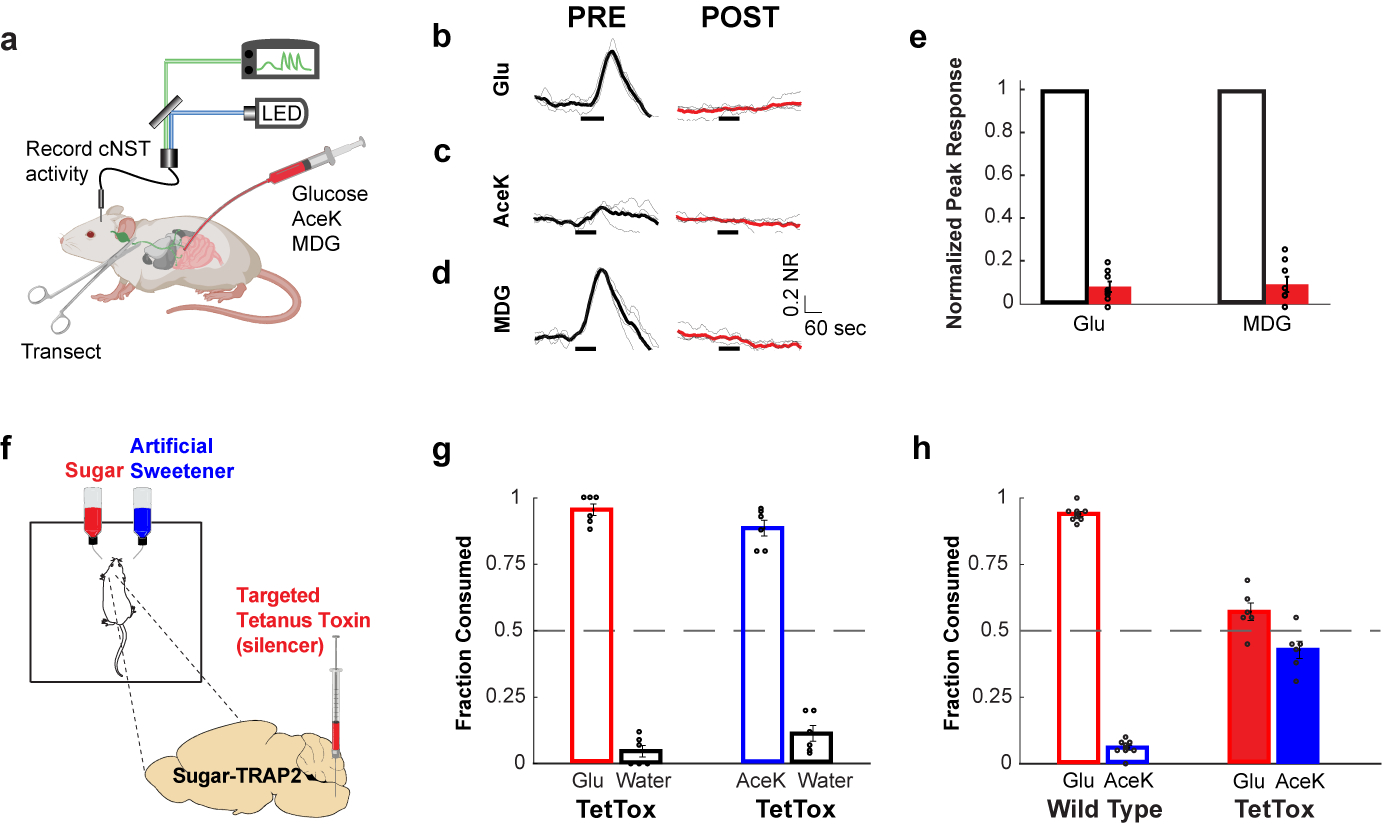
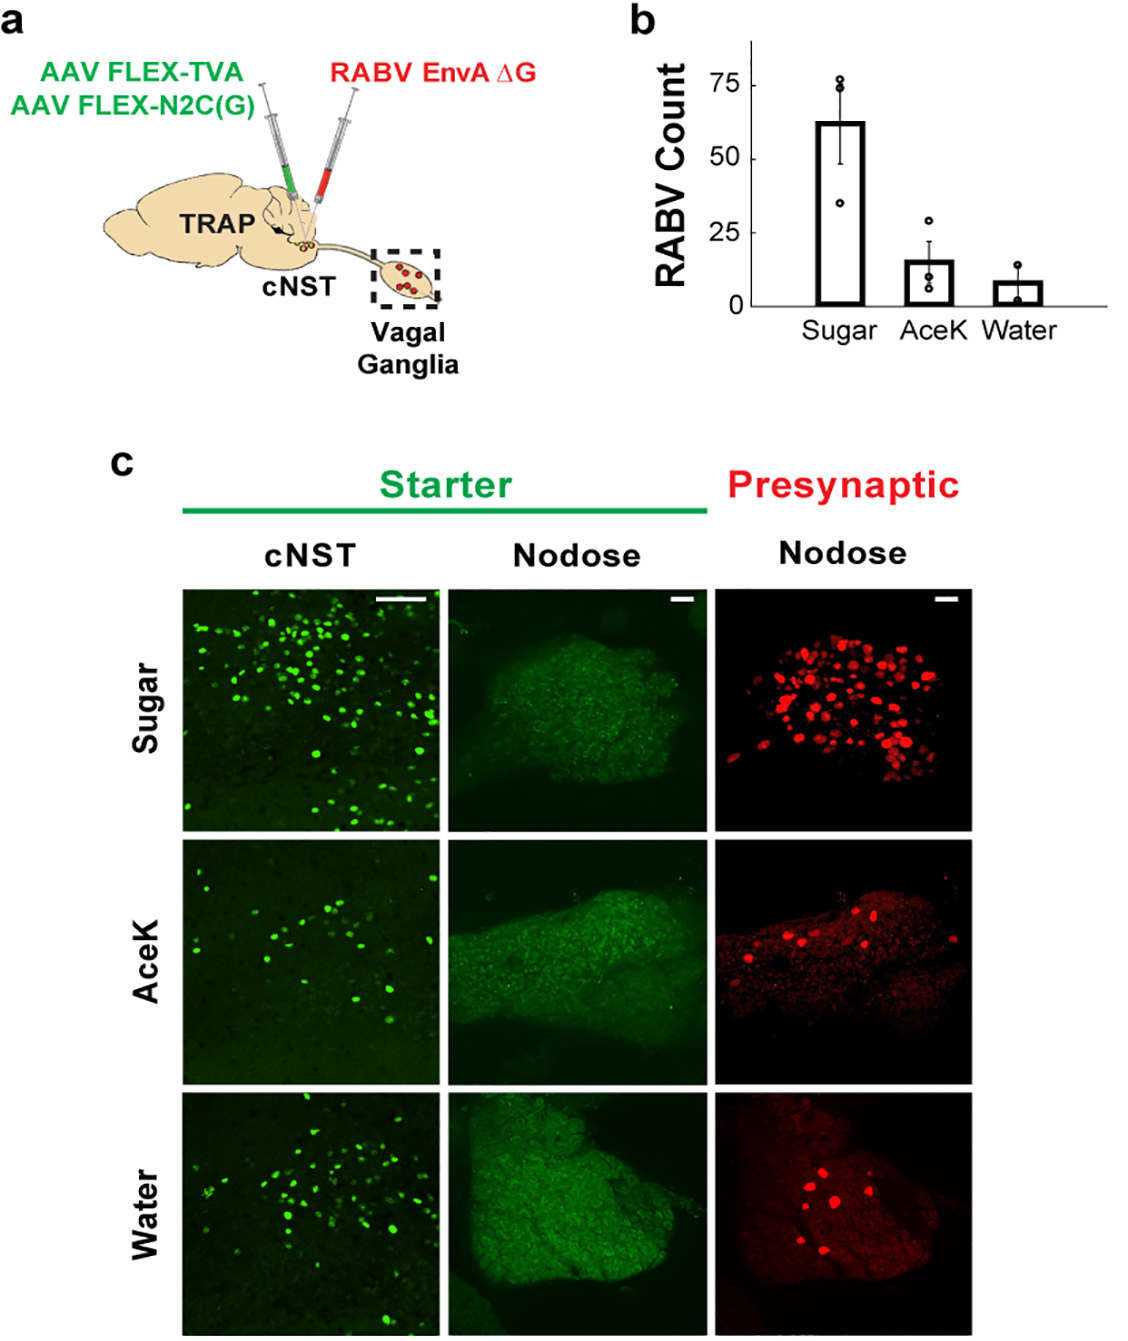
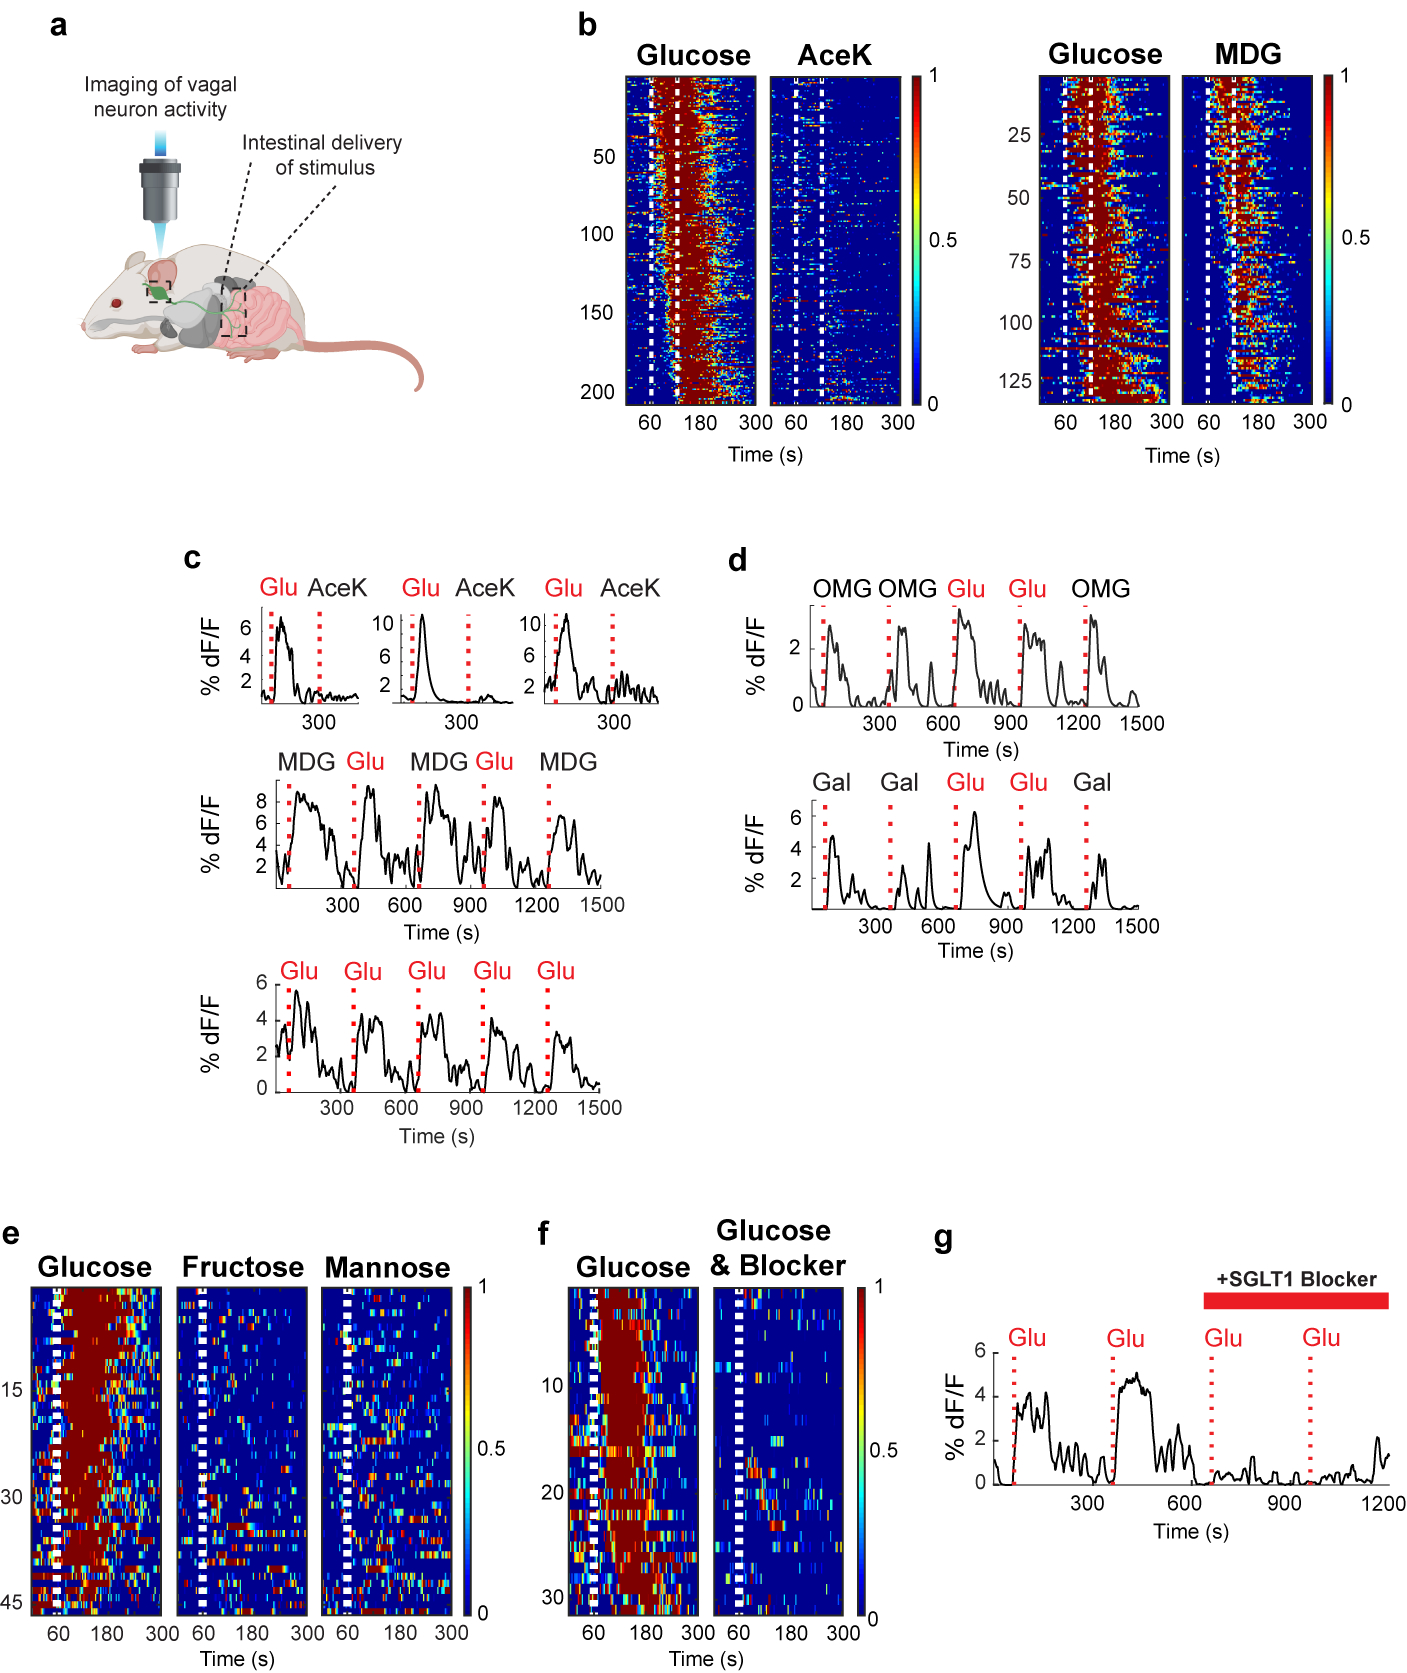
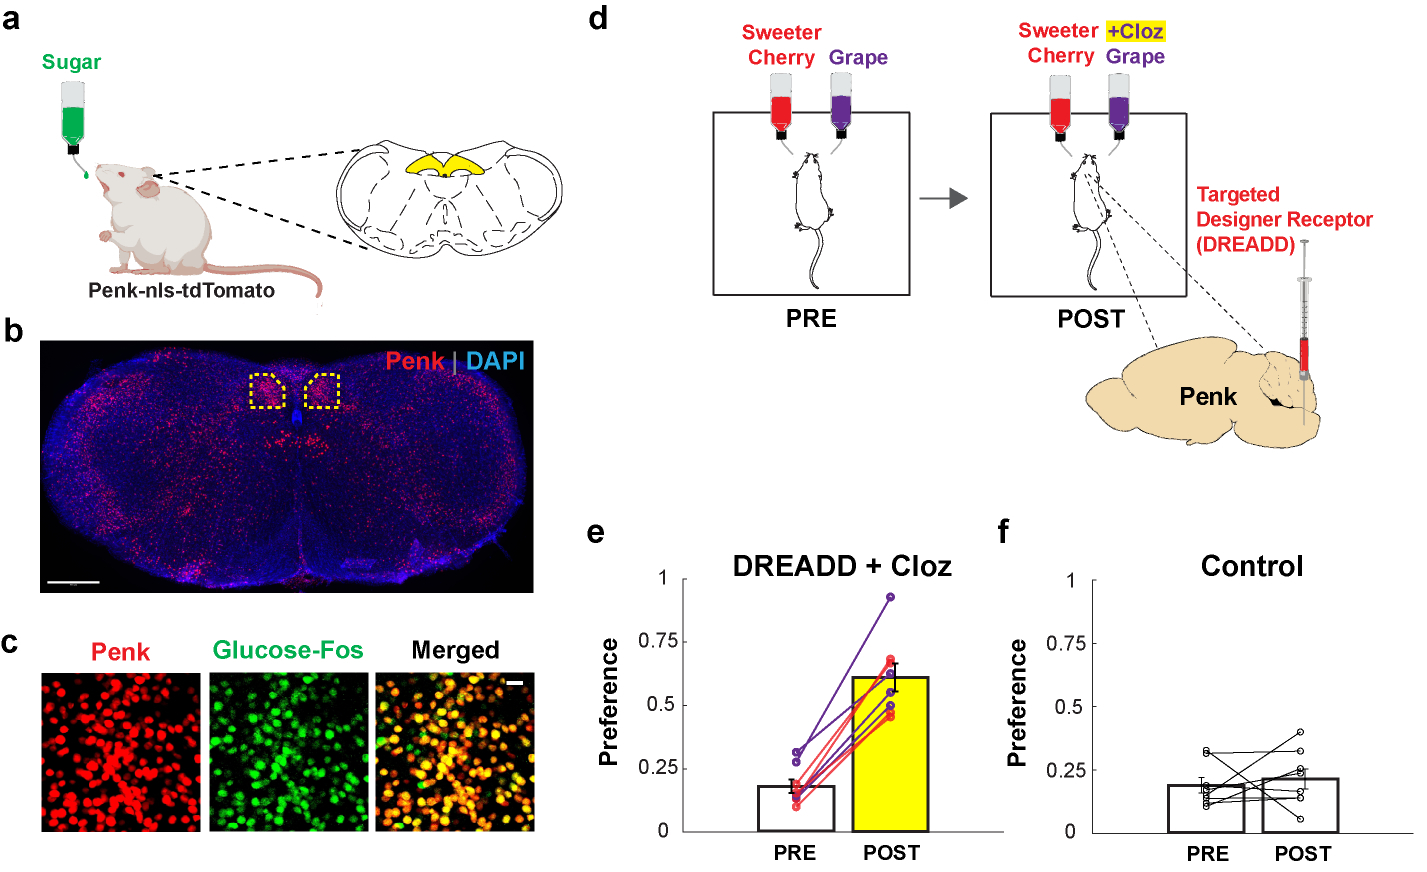
The taste of sugar is one of the most basic sensory percepts for humans and other animals. Animals can develop a strong preference for sugar even if they lack sweet taste receptors, indicating a mechanism independent of taste1-3. Here we examined the neural basis for sugar preference and demonstrate that a population of neurons in the vagal ganglia and brainstem are activated via the gut-brain axis to create preference for sugar. These neurons are stimulated in response to sugar but not artificial sweeteners, and are activated by direct delivery of sugar to the gut. Using functional imaging we monitored activity of the gut-brain axis, and identified the vagal neurons activated by intestinal delivery of glucose. Next, we engineered mice in which synaptic activity in this gut-to-brain circuit was genetically silenced, and prevented the development of behavioural preference for sugar. Moreover, we show that co-opting this circuit by chemogenetic activation can create preferences to otherwise less-preferred stimuli. Together, these findings reveal a gut-to-brain post-ingestive sugar-sensing pathway critical for the development of sugar preference. In addition, they explain the neural basis for differences in the behavioural effects of sweeteners versus sugar, and uncover an essential circuit underlying the highly appetitive effects of sugar.


Conflict of interest statement

Competing Interests

C.S.Z. is a scientific co-founder and advisor of Kallyope.

Figures

Extended Data Figure 1:
Extended Data Figure 1:. Glucose and MDG Preference
a, When mice are given a choice between 600 mM glucose or 600 mM MDG, using a brief-access (1 hour) test, naive animals display a small preference for glucose over MDG (n = 5, two-tailed paired t-test, p = 0.0406), likely because MDG is slightly less sweet and thus not as attractive. Values are mean ± s.e.m. b-c, Although the non-caloric sugar analogue MDG is very effective in causing a preference switch (see Fig. 1), it does not cause increases in plasma glucose or release of insulin. Mice were gavaged with glucose or MDG, and plasma glucose and insulin levels were sampled before (“Pre”), and at 15 min after the gavage (“Post”). Panel b, plasma glucose after glucose gavage (red bars), n = 7, two-tailed paired t-test, p = 4 × 10⁻⁵. Plasma glucose after MDG gavage (blue bars), n = 6, two-tailed paired t-test, p = 0.36. Panel c, plasma insulin levels after glucose gavage (red bars), n = 7, two-tailed paired t-test, p = 7 × 10⁻⁶. Plasma insulin levels after MDG gavage (blue), n = 6, two-tailed paired t-test, p = 0.94. Values are mean ± s.e.m.
Extended Data Figure 2:
Extended Data Figure 2:. Fos responses are robust and reliable
a, The brain diagram illustrates the position of the NST and the plane of the sectioning. Shown are cNST sections stained with Fos antibodies after exposing the animals to 90 min of 600 mM sucrose, 600 mM glucose or 30 mM AceK. Each panel is a confocal maximal projection image from Bregma −7.5 mm consisting of 3 sections 15 μm apart. Each panel (sucrose, glucose or AceK) represents a different animal, n = 3 independent experiments. Note the robustness of the signals across animals. See Methods for details. b, Mice were stimulated with 600 mM 3-O-Methyl-D-glucopyranose (3-OMG) (n = 6 animals) or 600 mM galactose (n = 3 animals) (see also Fig. 4 and Extended Data Fig. 10). Note strong Fos signals in cNST neurons, n = 2 independent experiments (total of 9 mice). Scale bars, 100 μm.
Extended Data Figure 3:
Extended Data Figure 3:. The development of sugar preference
a, Glucose stimulates cNST neurons in animals lacking the sweet taste receptor (T1R2/T1R3−/−), or in animals lacking the TRPM5 ion channel (TRPM5−/−). See Fig. 1e for quantitation: T1R2/T1R3−/−, n = 5 mice, ANOVA followed by Tukey’s HSD post hoc test, p < 0.0001; TRPM5−/−, n = 7 mice, ANOVA followed by Tukey’s HSD post hoc test, p < 0.0001. Values are mean ± s.e.m. Scale bar, 100 μm. b, Direct intragastric infusion of glucose, but not AceK, robustly activates the cNST. n = 2 independent experiments. Scale bar, 100 μm. c-d, Genetic silencing of vagal sensory neurons. c, Sugar-preference graphs for Wild Type mice (n = 5 mice), demonstrating the robust development of preference for sugar versus artificial sweetener (see also Fig. 1). In contrast, silencing of the sensory neurons in the nodose ganglia, by bilateral injection of AAV DIO-TetTox injections into the nodose ganglia of VGlut2-Cre animals (see Methods), abolishes the development of sugar preference; n = 3 animals, two-sided Mann-Whitney U-Test, p = 0.035. Values are mean ± s.e.m. d, However, silencing vagal sensory neurons does not impair the innate attraction to “sweet” solutions; shown are behavioural responses to AceK versus water, and glucose versus water (n = 3 animals, preference index for AceK = 0.82, preference index for glucose = 0.85). Values are mean ± s.e.m.
Extended Data Figure 4:
Extended Data Figure 4:. Retrograde Labeling from cNST
a, A fluorescent retrograde tracer (red RetroBeads, Lumafluor) was stereotaxically injected into the cNST to label its inputs. The nodose ganglia and dorsal root ganglia were checked for transfer of the fluorescent label after 6–7 days. The nodose ganglion (vagal neurons), but not the dorsal root ganglion (spinal neurons), was robustly labelled, n = 2 independent experiments. b, RetroBeads were also injected into the Cuneate nucleus, a brainstem area near but distinct from the cNST. Vagal neurons were not labelled. In contrast, note robust labelling of spinal neurons (n = 2 independent experiments). DAPI nuclear counterstain is also shown (blue). Scale bars: 200 μm (Brainstem), 50 μm (Nodose, DRG). c, Validation of TRAPing procedure. To confirm that the sugar-activated cNST neurons marked by the expression of Fos are the same as the ones labelled by Cre-recombinase in the genetic TRAPing experiments. We genetically labelled the sugar-induced TRAPed neurons with a Cre-dependent fluorescent reporter, and then performed a second cycle of sugar stimulation followed by Fos antibody labelling. d, Top row, neurons labelled by the Cre-dependent reporter after sugar TRAPing (‘Sugar-TRAP’, pseudo-coloured red) are the same as the ones labelled by Fos after a second cycle of sugar stimulation (‘Sugar-Fos’, marked in green; see Methods and text for details), >80% of Sugar-Fos are Sugar-TRAP (n = 7 animals); middle row, note that the few neurons labelled after Water-TRAP in response to water do not overlap with those labelled with Fos antibodies after sugar stimulation; bottom row, the sugar-TRAP neurons are also activated by the non-caloric sugar analogue MDG, >80% of MDG-Fos are Sugar-TRAP. Scale bar, 20 μm.
Extended Data Figure 5:
Extended Data Figure 5:. Animals with the sugar-preference circuit silenced behave as normal mice drinking artificial sweeteners
a, A normal, non-thirsty mouse drinks ~5ml of water during a 24 h window, n = 11 animals. Values are mean ± s.e.m. b, If presented with a “sweet” option (but not sugar, so as to not create a preference) they show a small but significant increase in total volume consumed, but now most of the total consumption is from the sweet choice rather than water (n = 9 animals, two-tailed paired t-test, p = 1 × 10⁻⁴). Values are mean ± s.e.m. c, In contrast, if the options are water versus sugar, so that it creates a preference, they massively increase total volume consumed, and nearly all is from the sugar solution (n = 9 animals, two-tailed paired t-test, p = 3 × 10⁻¹⁰). Values are mean ± s.e.m. d, As expected, wild type controls develop strong preference for sugar versus AceK (n = 9 animals, two-tailed paired t-test, p = 3 × 10⁻⁸). Values are mean ± s.e.m. e-f, Animals with the preference circuit silenced now behave as control animals presented with a sweet, non-preference creating choice (compare panels e-f to panel b) (n = 6 animals, two-tailed paired t-test, p = 6 × 10⁻⁴ for AceK, p = 4 × 10⁻³ for glucose). Values are mean ± s.e.m. g, Silenced animals consumed nearly equal volumes of sugar and artificial sweetener (n = 6 animals, two-tailed paired t-test, p = 0.1). Values are mean ± s.e.m.
Extended Data Figure 6:
Extended Data Figure 6:. Vagal neuron responses to sugar and MDG are highly reproducible and timed-locked to the stimulus
a, Shown are vagal neuron responses to 6 consecutive 10 s intestinal stimuli of alternating trials with 500 mM glucose and 500 mM MDG (stimulus delivery and timings are as described in Methods). Each of the sample traces depict the response from a different neuron. b, Shown are vagal neuron responses to 5 consecutive 10 s intestinal stimuli with 500 mM glucose (stimulus delivery and timings are as described in Methods). Each of the sample traces depict the response from a different neuron. c, Expanded time scale of responses to the 10 s 500 mM glucose stimulus from 10 s before to 10 s after termination of the stimulus. The green dash lines indicate the initiation of the stimulus, and the blue dash lines denote termination of the 10 s stimulus. Shown in solid black are the calcium responses, and shown in red are exponential fits to the response latency and kinetics. Note responses time-locked to stimulus delivery; top 2 traces depict 2 cells from 2 different mice in response to glucose, and bottom 2 traces depict 2 cells from 2 different mice in response to MDG; latencies varied between 3–6 s, and were within the 10 s stimulation window. Some cells exhibited longer latencies (see for example heat maps in Fig. 4 and Extended Data Fig. 8). We believe the cells with longer response “latencies” may represent intestinal glucose responders located farther down the intestinal segment, and thus would be expected to demonstrate longer latencies. d, On the average, approximately 5% of vagal neurons respond reliably to a 10s 500 mM glucose stimulus. The histogram shows the percentage of GCaMP-expressing vagal neurons responding to the 10s glucose stimulus Average= 4.6 ± 0.05% (n= 4803 neurons from 51 ganglia, mean ± s.e.m.). e, Recent findings have suggested that appetitive behavioural responses are elicited through stimulation of vagal terminals originating from the right nodose ganglion. Shown are heat maps depicting z-score normalized average calcium responses of individual ganglion neurons after a 60 s pulse of 500 mM glucose. We observe no differences in responses to intestinal glucose from either the left or right vagal ganglia. Also shown are example traces from different neurons from the left and right Nodose ganglion; red bars indicate the 60 s stimulus; scale bars indicate % maximal response.
Extended Data Figure 7:
Extended Data Figure 7:. Vagal neurons innervating duodenal segment sense sugar
a, Schematic of retrograde tracing experiment. Fluorescently-conjugated cholera toxin subunit B (CTB) was injected into the proximal duodenum to back fill, and label, the cell bodies of duodenum-projecting vagal neurons (z-projection of n = 22 confocal planes from a representative ganglion, see Methods for details). The two panels below show a sample retrogradely labelled ganglion with sensory neurons (VGlut2-Cre driving the GCaMP reporter) marked in green (left) and those labelled by CTB marked by red fluorescence (right). Double-positive neurons are highlighted by the white circles. Scale bar, 100 μm. b, Representative field of a vagal imaging session showing the overlay of CTB and GCaMP. The 2 yellow circled neurons (denoted as #1 and #2) were labelled by retrogradely applied CTB in the duodenal segment, and exhibited strong responses to glucose (n = 16 ganglia from 10 mice). Scale bar, 100 μm. c, A total of 12/55 double-positive neurons responded to the 10 s glucose stimulus (see Extended Data Fig. 6d for a comparison with un-injected animals); n = 16 ganglia from 10 mice. Note the substantial enrichment in the number of responders when pre-tagged by retrograde labelling: ~20% in the duodenal tagged vs 4–5% in the whole population.
Extended Data Figure 8:
Extended Data Figure 8:. Glucose responders are not sensing osmolarity.
Recently, Williams et al. (2016) identified vagal neurons that indiscriminately responded to high concentrations of several stimuli delivered in very large stimulus volume for hundreds of seconds. We believe these responses, largely independent of the quality of the stimulus, are intestinal osmolarity signals. a, Shown are heat maps summarizing responses to interleaved 60s stimuli of 500 mM glucose and 500 mM mannitol. Each row represents the average activity of a single cell during 3 interspersed exposures to the stimulus. Stimulus window is indicated by the dashed white lines. Of 134 neurons that responded to intestinal application of 500 mM glucose for 60 s, 101 did not exhibit statistically significant responses to mannitol (upper panel). However, 33 (~25%) showed responses to both 500 mM glucose and 500 mM mannitol (lower panel). N = 5 mice. When the intestinal stimulus consisted of a short pulse (i.e. 10 s; 33 μl volume) no responses were detected to 500 mM mannitol (data not shown). b, Sample traces (3 trials each) of a neuron responding to glucose (red) but not mannitol (blue). c, Sample traces (3 trials each) of a neuron responding to glucose and mannitol. Scale bars indicate % maximal response. d, Heat maps showing responses to a 60s stimuli of 1 M mannitol, 1 M fructose, 1 M mannose, and 1 M NaCl. Note that the same cells respond indiscriminately to the various stimulus (n = 4 mice). e, The graph shows preference plots for Fructose versus AceK (n = 8 mice, two-tailed paired t-test, p = 0.27). Note that Fructose, a caloric sugar, does not create preference, but activates osmolarity responses. f, Williams et al. (2016) suggested GPR65-expressing vagal neurons function as the nutrient sensors. We generated mice where GCaMP6s expression was targeted to GPR65-expressing vagal neurons, and examined their responses to a 10s stimulus of 500 mM glucose or osmolarity signals (i.e. 1 M each of fructose, mannose, and NaCl for 60 s). Shown are normalized responses of from 3 different mice to the 4 stimuli; each trace represents a different responding neuron. Note that 500 mM glucose for 10 s does not activate GPR65 neurons. In contrast, they are activated by 60 s 1 M fructose, mannose and NaCl (see also Figure 4). g, Summary histogram of GPR65 tuning profile to 10s 500 mM glucose, and 60s 1 M fructose, 60s 1 M mannose, and 60s 1 M NaCl; n = 4 mice.
Extended Data Figure 9:
Extended Data Figure 9:. Genetic silencing of GPR65 neurons does not affect the development of sugar preference
a, Global silencing of the GPR65 neurons was achieved by generating GPR65-IRES-Cre; R26-TeNT double transgenic animals expressing TetTox in GPR65 neurons. Sugar-preference graphs demonstrating the robust development of preference for sugar versus artificial sweetener for both Wild Type (n = 5 mice, two-tailed paired t-test, p = 0.0047) and GPR65:TetTox mice (n = 5 mice, two-tailed paired t-test, p = 0.0033). The Wild Type controls shown here are the same animals used in Extended Data Fig. 3c as both sets of silencing experiments were carried out as part of the same series of studies. Values are mean ± s.e.m. b, Silencing of GPR65 neurons does not impair the innate attraction to sweet solutions. Shown are behavioural responses to AceK versus water and glucose versus water (n = 5, two-tailed paired t-test, p = 0.0040 for consumed volumes of AceK vs water, p = 0.0023 for consumed volumes of glucose vs water). Values are mean ± s.e.m.
Extended Data Figure 10:
Extended Data Figure 10:. Vagal neurons responding to intestinal glucose are also activated by SGLT-1 agonists
a, Traces of vagal neurons responding to a 10 s pulse of 500 mM intestinal glucose, also challenged with a 10 s pulse of 500 mM 3-OMG. Shown are sample neurons from 2 animals. b, Traces of vagal neurons responding to a 10 s pulse of 500 mM intestinal glucose, also challenged with a 10 s pulse of 500 mM galactose. Shown are sample neurons from 2 animals. c, Traces of vagal neurons responding to a 10 s pulse of 500 mM intestinal glucose, also challenged with a 10s pulse of 500 mM fructose and 500 mM mannose. Shown are sample neurons from 3 mice. d, Traces of vagal neurons responding to two consecutive 10 s pulses of 500 mM intestinal glucose, before and after treating the intestinal segment with 8 mM Phlorizin for 5 min. Note the loss of responses. e, Because responses, in general, show some decay during the time of the experiment (in part due to desensitizing and bleaching of the fluorescent signals), we also analysed the average decay of corresponding glucose responses in the absence of any blocker. The graphs compare the loss of responses during normal decay, and in response to the blocker. For normal decay (left), n = 11 neurons, Pre = 230.8 a.u., Post = 172.8 a.u.; for blocker (right), n = 31 neurons, Pre = 229.7 a.u., Post = 67.0 a.u. All values are mean ± s.e.m. Scale indicates average integral of the responses to the two trials before and after inhibition (a.u. = arbitrary units).
Figure 1:
Figure 1:. Sugar activates the gut-brain axis
a, Mice are given a choice between 600 mM glucose or 30 mM AceK (sweetener). The animal’s preference is tracked by electronic lick counters in each port. The upper insets show lick-rasters for glucose (red) versus AceK (blue) from the first and last 2000 licks of the behavioural test. Note that by 48 h the animals drink almost exclusively from the sugar bottle. b, Preference plots for sugar versus AceK (n = 9 mice, two-tailed paired t-test, p = 2.39 × 10⁻⁶), and MDG versus AceK (n = 5 mice, two-tailed paired t-test, p = 0.0024; Extended Data Fig. 1). Note that animals may begin the behavioural preference test exhibiting no preference for sugar (preference index ~0.5), some preference for sugar (preference index >0.5), or with an initial preference for the sweetener (preference index <0.5). However, in all cases they switched (or dramatically increased) their preference to sugar. c, Mice lacking the sweet taste receptor (T1R2/T1R3−/−), n = 5 mice, two-tailed paired t-test, p = 0.0038, and mice lacking TRPM5 (TRPM5−/−), n = 7 mice, two-tailed paired t-test, p = 0.0001, switched their preference to sugar even though they cannot taste it. d, Schematic of sugar stimulation for Fos induction. Strong Fos labelling is observed in neurons of the cNST (highlighted yellow). Scale bars, 100 μm. Similar results were obtained in multiple animals for each experiment (Extended Data Fig. 2). e, Quantitation of Fos-positive neurons. The equivalent area of the cNST (Bregma −7.5 mm) was processed and counted for the different stimuli. The signal present in water alone was subtracted prior to plotting; ANOVA with Tukey’s HSD post hoc test against AceK (n = 6 mice): p = 4.68 × 10⁻⁵ (glucose, n = 8 mice), p = 0.001 (MDG, n = 5 mice). Values are mean ± s.e.m.
Figure 2:
Figure 2:. Silencing the sugar-activated circuit abolishes sugar preference
a, Fibre photometry monitoring glucose-evoked responses of cNST neurons. The excitatory neurons in the cNST were targeted with GCaMP6s using VGlut2-Cre animals. b-d, Shown are neural responses following intestinal delivery of glucose, AceK and MDG. Note strong responses to sugar (panel b) and MDG (panel d). The light traces denote normalized 2-trial averages from individual animals, and the dark trace the average of all trials (NR = Normalized Responses). Black bars below traces indicate the time and duration of stimuli. In red are the average responses after bilateral vagotomy (see Methods). Stimuli, 500 mM glucose, 30 mM AceK, 500 mM MDG; n = 4 animals. e, Quantification of neural responses after vagotomy. Two-tailed paired t-test, p = 3 × 10⁻¹⁵ (glucose), p = 5 × 10⁻¹³ (MDG), n = 4 animals. Values are mean ± s.e.m. f, Schematic of silencing strategy. TRAP2 animals were stimulated with 600 mM glucose to induce expression of Cre-recombinase in the cNST. AAV-DIO-TetTox was then targeted bilaterally to the cNST for silencing. g, Silencing the sugar-preference neurons in the cNST does not impair the innate attraction to sugar or sweeteners. The graph shows preference for 600 mM glucose versus water, and preference for 30 mM AceK versus water, n = 6 animals. Values are mean ± s.e.m. h, Sugar-preference graphs (48 h tests) for wildtype mice, demonstrating the robust development of preference for sugar versus sweetener (see also Fig. 1). In contrast, silencing the sugar-activated neurons in the cNST abolishes the development of sugar preference, n = 6 mice, two-sided Mann-Whitney U-Test, p = 4 × 10⁻⁴; TetTox-silenced animals consumed as much of the AceK sweetener as they do sugar (see also Extended Data Fig. 5). Values are mean ± s.e.m.
Figure 3:
Figure 3:. Vagal ganglion neurons transmit sugar signals to the brain
a, Strategy for targeting a red-fluorescently labelled retrograde transsynaptic rabies reporter (RABV-dsRed), to the cNST. Sugar-TRAP neurons in the cNST (defined as “starter”), were infected with the RABV-dsRed virus; the monosynaptic inputs of the sugar-activated cNST neurons are revealed by the retrogradely transsynaptic transfer of the RABV-dsRed virus. b, Quantification of retrogradely-labelled RABV-dsRed neurons in the nodose ganglion. Sugar- versus AceK-TRAPing (n = 3 animals), ANOVA Tukey’s HSD post hoc test, p = 0.0449. We also performed control TRAPing with water (n = 2 animals); Sugar- versus water-TRAPing, ANOVA Tukey’s HSD post hoc test, p = 0.0407; AceK versus water-TRAPing, p = 0.9. Values are mean ± s.e.m. c, Sugar-TRAPed cNST neurons (“starter”, green) receive monosynaptic input from vagal neurons (RABV, red). Note the absence of starter cells in the nodose, confirming that the RABV (red) cells represent retrogradely-labelled neurons,. Scale bars, 100 μm.
Figure 4:
Figure 4:. Imaging the gut-brain axis
a, We imaged calcium responses in vagal sensory neurons expressing the fluorescent calcium indicator GCaMP6s while stimulating the intestines. b, Heat maps depicting z-score normalized fluorescence traces, from vagal neurons identified as glucose responders. Each row represents the average activity of a single cell to 3 trials. Stimulus window shown by dashed white lines. The left panels are responses of n = 206 vagal neurons to a 60 s intestinal infusion of 500 mM glucose; note lack of responses to 30 mM AceK. The right heatmaps depict n = 133 vagal neurons that responded to 60 s 500 mM glucose, and tested for their responses to 500 mM MDG; heatmaps were normalized across stimuli; responses to glucose and MDG were similar (two-tailed paired t-test, p = 0.06). c, Sample traces of vagal neuron responses to intestinal stimulation with 60 s pulses of 30 mM AceK and 500 mM glucose from 3 mice (upper traces), or to 10 s pulses of 500 mM glucose and 500 mM MDG (lower traces). Note the reliability and rapid onset of responses to the 10 s stimulus (Extended Data Fig. 6c). When using a 10 s stimulus, to minimize potential osmolarity responses (Extended Data Fig. 8), approximately 5% of imaged neurons show statistically significant responses to glucose (Extended Data Fig. 6d). We compared imaging sessions with both the right and left ganglia and did not observe any meaningful difference in the proportion of glucose-responding neurons (Extended Data Fig. 6e). d, Vagal neuron responses to 3-OMG (top traces) and galactose (lower traces), n = 3 independent experiments each. These agonists activate vagal neurons in a similar manner to glucose (Extended Data Fig. 2b and 10a–b). e, The monosaccharides fructose and mannose, which are not substrates for SGLT-1, do not activate glucose-responsive neurons. Shown are heat maps of 46 glucose-responding neurons to 500 mM fructose and 500 mM mannose (n = 5 ganglia). Fewer than 10% of glucose responders were activated by either fructose or mannose. f-g, Summary of responses to a 10 s stimulus of 500 mM glucose for 33 neurons before and after intestinal application 8 mM Phlorizin for 5 min (n = 4 mice). Responses are severely diminished after blocker application (see Extended Data Fig. 10d–e and Methods).
Figure 5:
Figure 5:. Activation of sugar-responsive cNST neurons confers novel flavour preference
a-c, Penk-Cre mice were stimulated with 600 mM glucose, and brain slices were analysed for Fos and Penk labelling. Penk neurons were marked by expression of nuclear-localized tdTomato (Ai75D). b, Low-magnification section of the brainstem (Bregma −7.5 mm) showing Penk expression (red); tissue was counterstained with DAPI (blue), n = 2 independent experiments. Scale bar, 500 μm; cNST, highlighted yellow. c, Sugar-preference neurons are Penk-expressing. Penk neurons labelled with tdTomato (from panel b) and glucose-activated neurons (Fos-labelled) marked green. Note the high degree of overlap in the merged image. Approximately 85% of sugar-activated cNST neurons are marked by Penk, and ~90% of cNST Penk neurons have sugar-Fos labelling (n = 3 mice). Scale bar, 20 μm. d, The activating DREADD receptor, AAV-DIO-hM3Dq was targeted bilaterally to the cNST of Penk-Cre animals. Mice were then tested for their preference between two flavours for 48 h (PRE). The diagram shows an example using cherry (containing 2 mM AceK) versus grape (with 1 mM AceK). Animals were conditioned and tested using the un-preferred flavour plus the DREADD agonist Clozapine (POST; see Methods). e, Penk-hM3Dq animals initially prefer the sweeter solution. Remarkably, after associating Clozapine-mediated activation of Penk cNST neurons with the un-preferred flavour, all the Penk-hM3Dq mice significantly switched their preference (PRE = 18.1 ± 2.7 %, POST = 61.1 ± 5.5 %; n = 8 mice, two-sided Mann-Whitney U-Test, p = 1 × 10⁻⁴). The experiment was carried out using grape (purple lines) or cherry (red lines) as the initially un-preferred stimuli. f, Mice not expressing the DREADD receptor are unaffected by the presence of Clozapine (PRE = 19.0 ± 3.0 %, POST = 21.4 ± 4.0 %, n = 8 mice); control animals were subjected to the same conditioning and testing as the experimental cohort. Values are mean ± s.e.m.

Comment in

References

    1. Sclafani A, Marambaud P & Ackroff K Conditioned flavor preferences in sweet ageusic T1r3 and Calhm1 knockout mice. Physiology & Behavior 126, 25–29 (2014). - PMC - PubMed
    1. de Araujo IE et al. Food Reward in the Absence of Taste Receptor Signaling. Neuron 57, 930–941 (2008). - PubMed
    1. Yarmolinsky DA, Zuker CS & Ryba NJP Common Sense about Taste: From Mammals to Insects. Cell 139, 234–244 (2009). - PMC - PubMed
    1. Zuker CS Food for the brain. (2015). doi: 10.1016/j.cell.2015.03.016. - DOI - PubMed
    1. Elliott Perry. & Elliott P. Production of sugar in the United States and foreign countries. (U.S. Dept. of Agriculture, 1917).

MeSH terms