. 2020 Jun;16(6):843-852.
doi: 10.1002/alz.12079. Epub 2020 Apr 22.

Contribution of mixed pathology to medial temporal lobe atrophy in Alzheimer's disease

Affiliations

Contribution of mixed pathology to medial temporal lobe atrophy in Alzheimer's disease

Robin de Flores et al. Alzheimers Dement. 2020 Jun.

Abstract

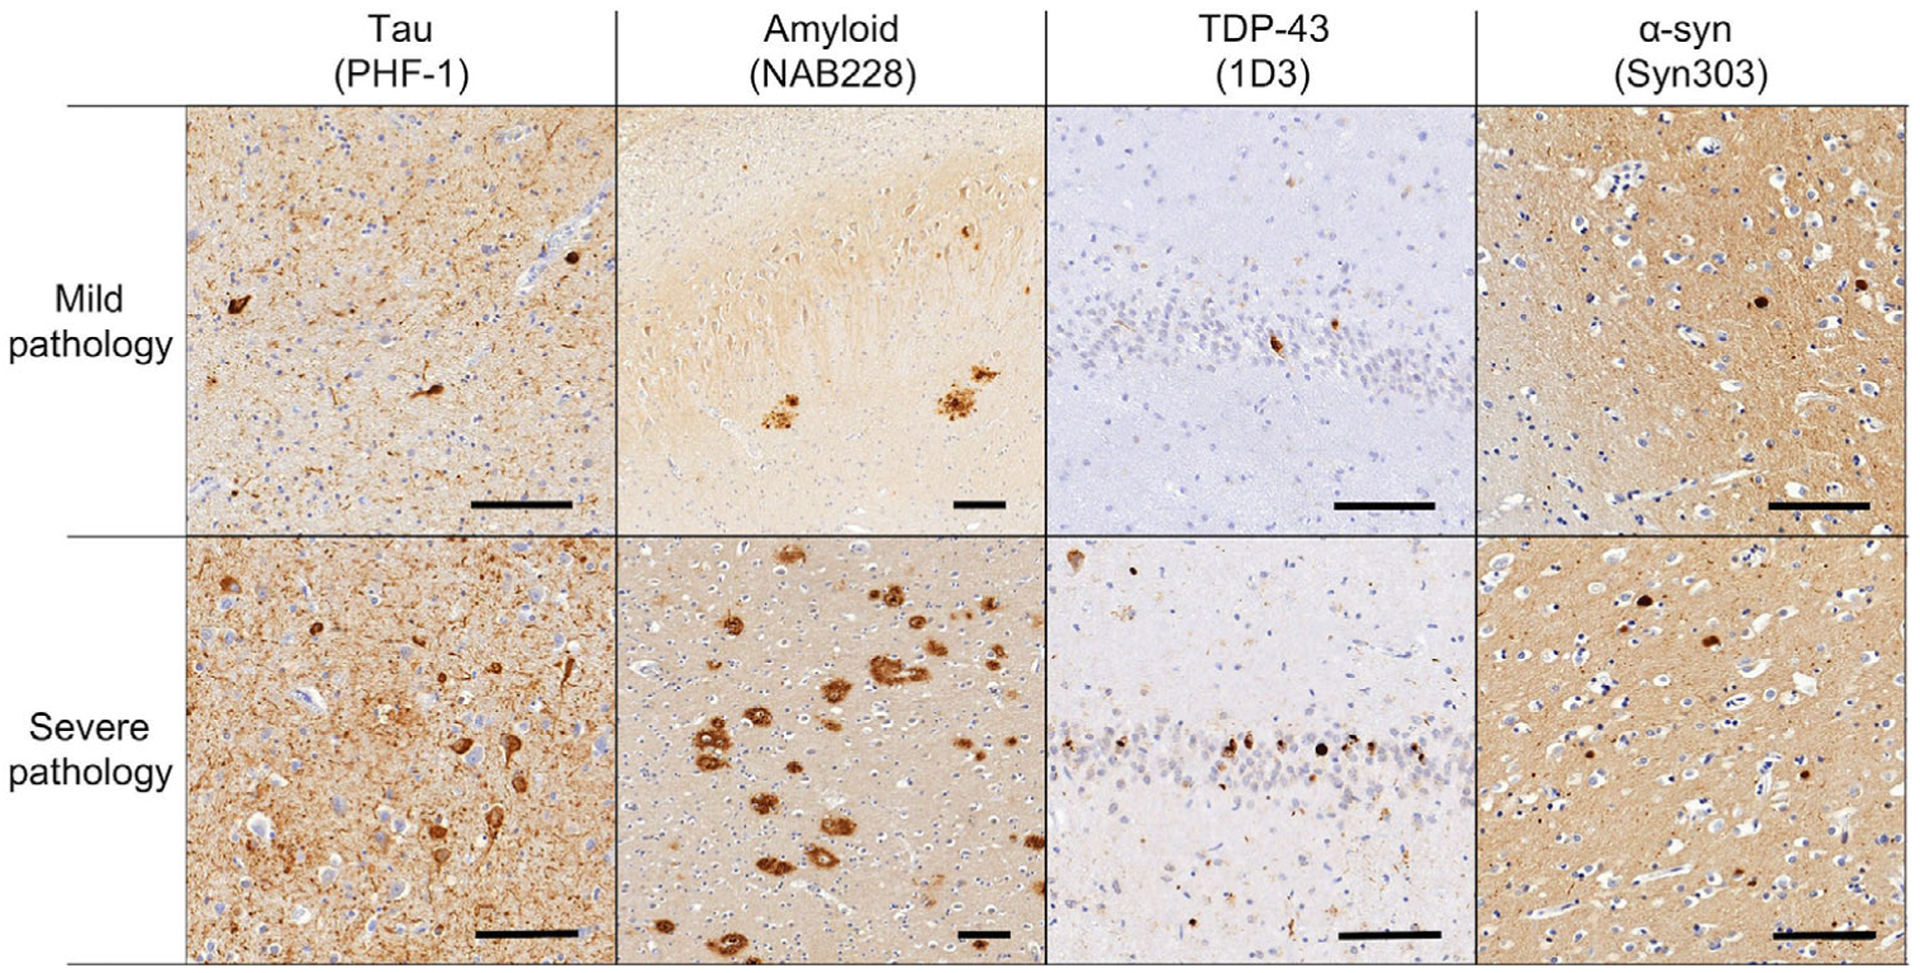
Introduction: It is unclear how different proteinopathies (tau, transactive response DNA-binding protein 43 [TDP-43], amyloid β [Aβ], and α-synuclein) contribute to atrophy within medial temporal lobe (MTL) subregions in Alzheimer's disease (AD).

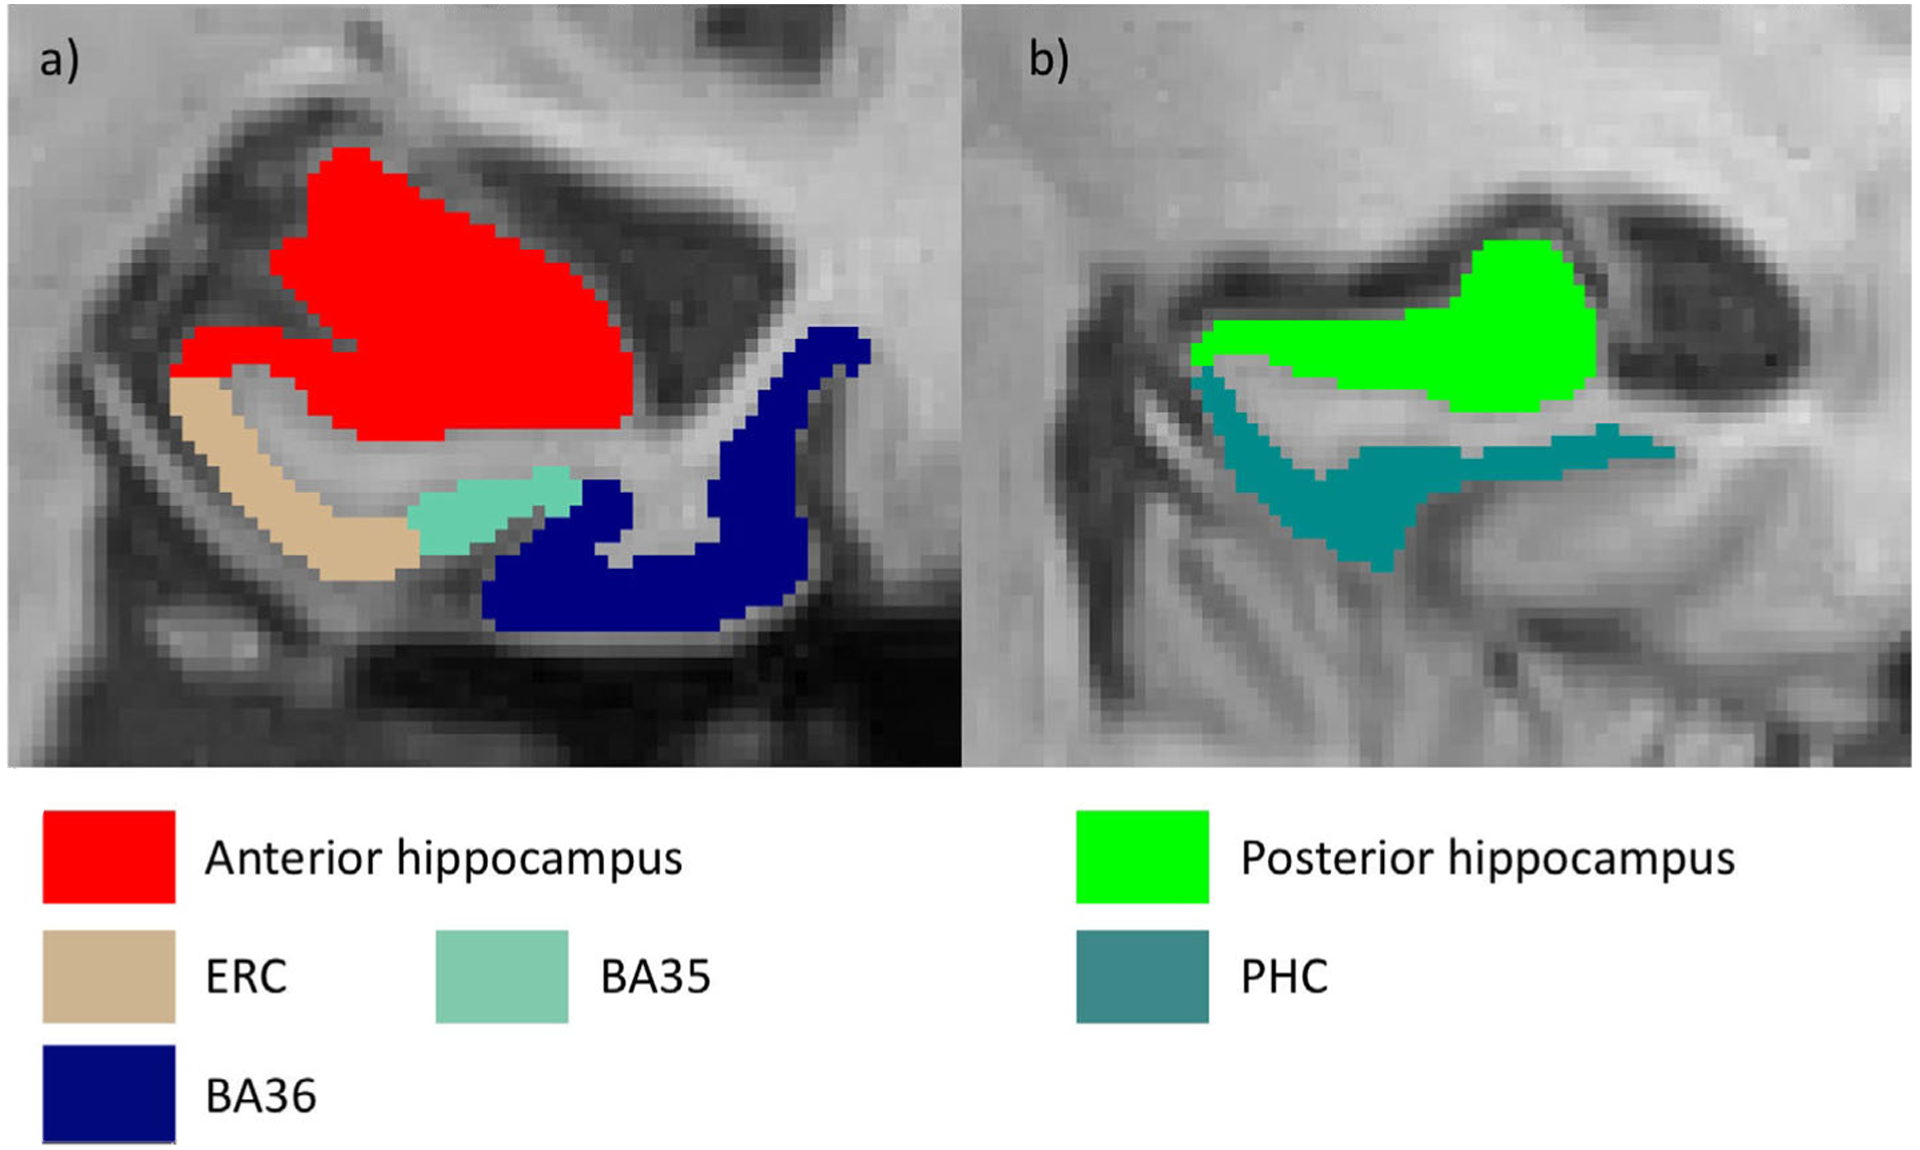
Methods: We utilized antemortem structural magnetic resonance imaging (MRI) data to measure MTL substructures and examined the relative contribution of tau, TDP-43, Aβ, and α-synuclein measured in post-mortem tissue from 92 individuals with intermediate to high AD neuropathology. Receiver-operating characteristic (ROC) curves were analyzed for each subregion in order to discriminate TDP-43-negative and TDP-43-positive patients.

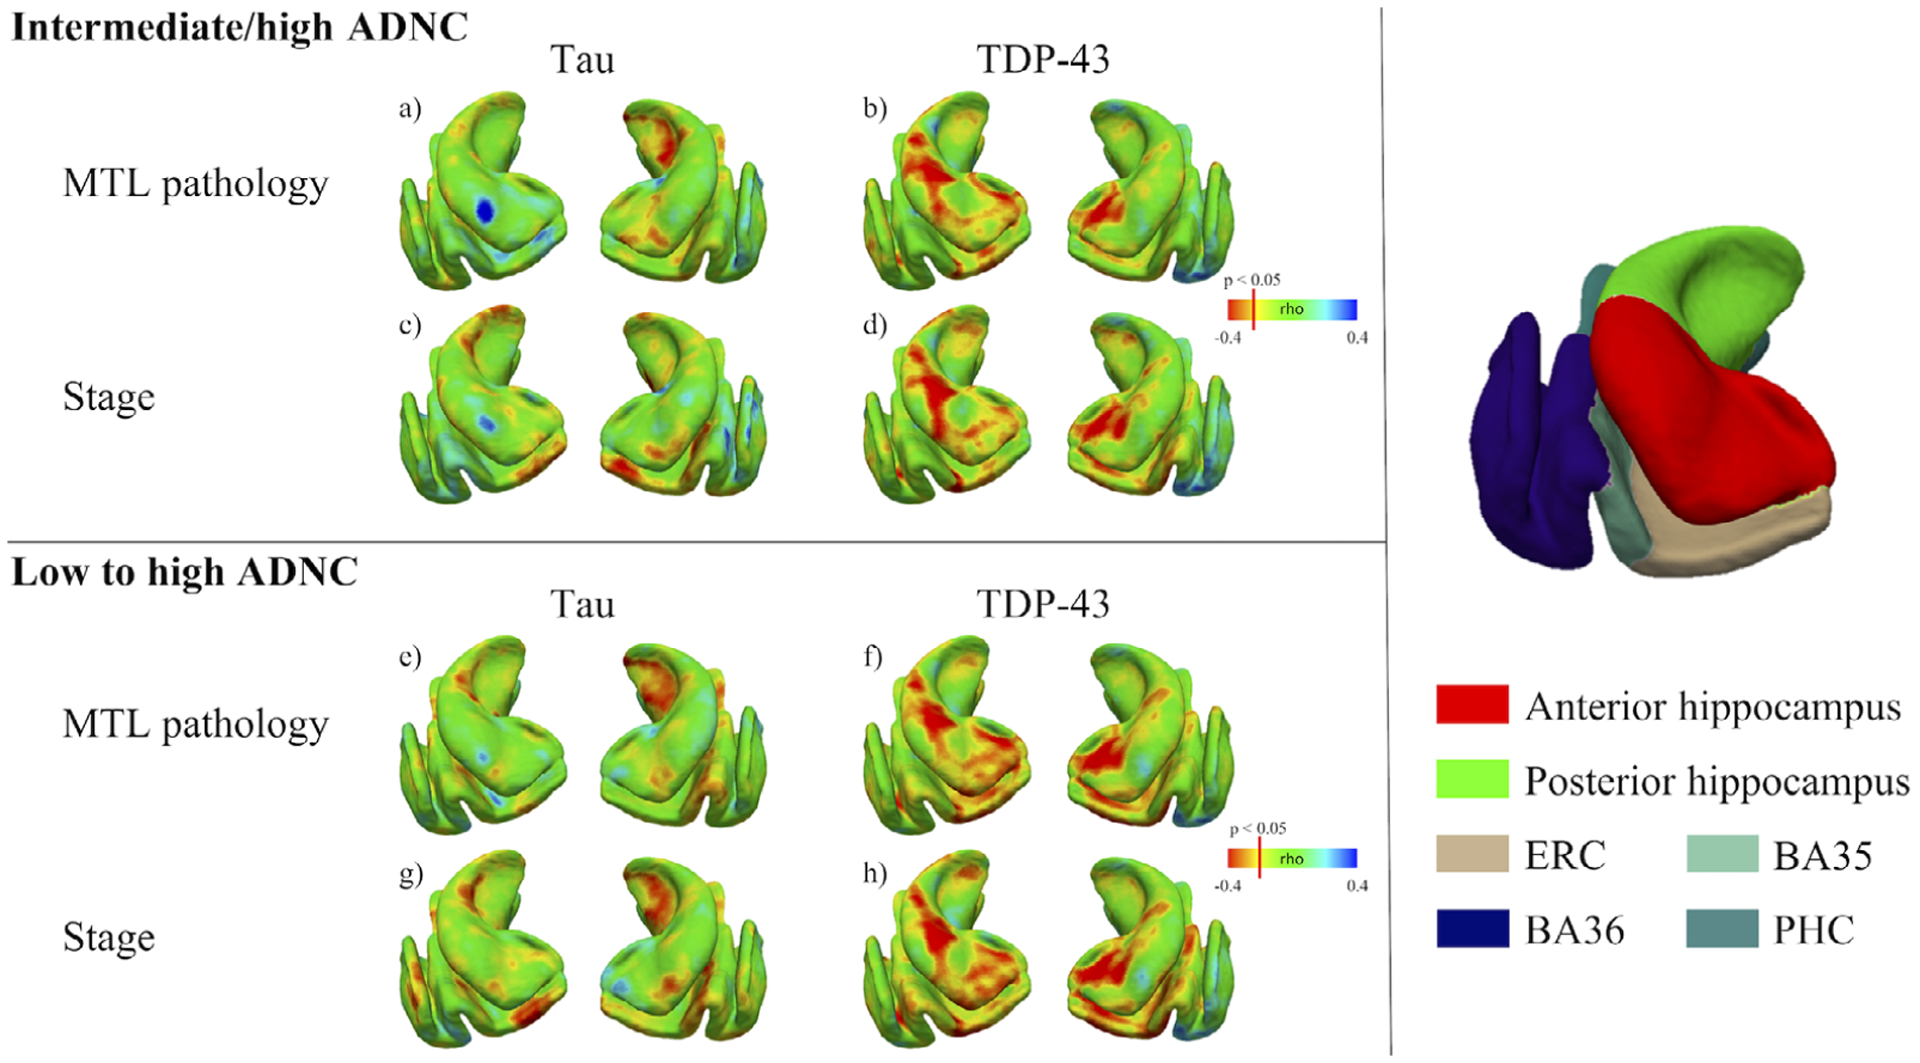
Results: TDP-43 was strongly associated with anterior MTL regions, whereas tau was relatively more associated with the posterior hippocampus. Among the MTL regions, the anterior hippocampus showed the highest area under the ROC curve (AUC).

Discussion: We found specific contributions of different pathologies on MTL substructure in this population with AD neuropathology. The anterior hippocampus may be a relevant region to detect concomitant TDP-43 pathology in the MTL of patients with AD.

Keywords: Alzheimer's disease; TDP-43; atrophy; medial temporal lobe; neuropathology; tau.


Conflict of interest statement

DISCLOSURE/CONFLICTS OF INTEREST

David A. Wolk received consultation fees from Eli Lilly, Janssen, and Merck. David A. Wolk receives grant support from Avid Radiopharmaceuticals/Eli Lilly, Biogen, Functional Neuromodulation, and Merck. John Q. Trojanowski has received research support from Eli Lilly. John Q. Trojanowski may accrue revenue in the future on patents submitted by the University of Pennsylvania wherein he is co-inventor, and he received revenue from the sale of Avid to Eli Lilly as co-inventor on imaging-related patents submitted by the University of Pennsylvania. Corey T. McMillan receives research funding from Biogen, Inc, and provides consulting services for Invicro and Axon Advisors on behalf of Translational Bioinformatics, LLC. He also receives an honorarium as Associate Editor of NeuroImage: Clinical. Long Xie received personal consulting fees from Galileo CDS, Inc.

Figures

FIGURE 1
FIGURE 1
Examples of pathological assessment for each pathological lesion in the medial temporal lobe. The upper panel shows mild ratings for inclusions and the lower panel shows severe ratings. The first column shows tau pathology from the entorhinal cortex (PHF-1 antibody), the second column shows amyloid plaques in CA1 (NAB228 antibody), the third column shows TDP-43 inclusions in the dentate gyrus (pS409/410 antibody), and the fourth column shows Lewy bodies (Syn303 antibody) in the entorhinal cortex. Scale bar is 100 μm
FIGURE 2
FIGURE 2
Segmentation of the medial temporal lobe using ASHS-T1 (Xie et al., 2019). An anterior (A) and posterior (B) slice from the same subject are displayed. BA, Brodmann area; ERC, entorhinal cortex; PHC, parahippocampal cortex
FIGURE 3
FIGURE 3
Receiver-operating characteristic (ROC) curves for the discrimination of TDP-43-positive (n = 14) versus TDP-43-negative (n = 61) patients with Alzheimer’s disease (AD). Patients were defined as TDP-43 positive with an MTL score ≥1. The two most discriminant (ratio between aH and PHC [blue]; ratio between ERC and PHC [red]) and the two least discriminant (PHC [green]; BA36 [black]) ROC curves are displayed. A higher area under the curve (AUC) reflects better group discrimination. True positive rate: Proportion of positive patients correctly classified as positive (also corresponding to sensitivity). False positive rate: Proportion of negative patients incorrectly classified as positive (also corresponding to 1 - specificity, where specificity is the proportion of negative patients correctly classified as negative). BA, Brodmann area; ERC, entorhinal cortex; PHC, parahippocampal cortex
FIGURE 4
FIGURE 4
Relationship between post-mortem data and ante-mortem medial temporal lobe measures—Pointwise analyses. For tau and TDP-43 pathologies, Spearman rank correlation models, with time between magnetic resonance imaging (MRI) and autopsy and age as covariates, were employed to evaluate the local association between the MTL structure and (1) the amount of pathology in the medial temporal lobe (MTL) (A, B, E, F) and (2) pathological stages (C, D, G, H). These analyses were performed both in the intermediate to high AD neuropathologic change (ADNC) group (upper panel) as well as in the low to high ADNC group (lower panel). The three-dimensional (3D) representation of the MTL on the right panel can be used for anatomical reference. Note that NFT pathology was negatively associated with posterior hippocampal thickness and, to some extent, ERC and BA35 (A, C, E, G), whereas TDP-43 was correlated specifically with the anterior part of the hippocampus, ERC and, to some extent, BA35 (B, D, F, H). BA, Brodmann area; ERC, entorhinal cortex; PHC, parahippocampal cortex

References

    1. Pini L, Pievani M, Bocchetta M, et al. Brain atrophy in Alzheimer’s Disease and aging. Ageing Res Rev. 2016;30:1–24. - PubMed
    1. Jagust W Imaging the evolution and pathophysiology of Alzheimer disease. Nat Rev Neurosci. 2018;19:687–700. - PMC - PubMed
    1. Tondelli M, Wilcock GK, Nichelli P, De Jager CA, Jenkinson M, Zamboni G. Structural MRI changes detectable up to ten years before clinical Alzheimer’s disease. Neurobiol Aging. 2012;33(4): 825.e25–36. - PubMed
    1. Smith CD, Andersen AH, Gold BT. Structural brain alterations before mild cognitive impairment in ADNI: validation of volume. J Alzheimers Dis. 2012;l(Suppl 3):S49–S58. - PMC - PubMed
    1. Whitwell JL, Przybelski SA, Weigand SD, et al. 3D maps from multiple MRI illustrate changing atrophy patterns as subjects progress from mild cognitive impairment to Alzheimer’s disease. Brain. 2007;130:1777–1786. - PMC - PubMed

Publication types

MeSH terms