. 2020 May;19(5):e13119.
doi: 10.1111/acel.13119. Epub 2020 Apr 23.

Systematic age-, organ-, and diet-associated ionome remodeling and the development of ionomic aging clocks

Affiliations

Systematic age-, organ-, and diet-associated ionome remodeling and the development of ionomic aging clocks

Bohan Zhang et al. Aging Cell. 2020 May.

Abstract

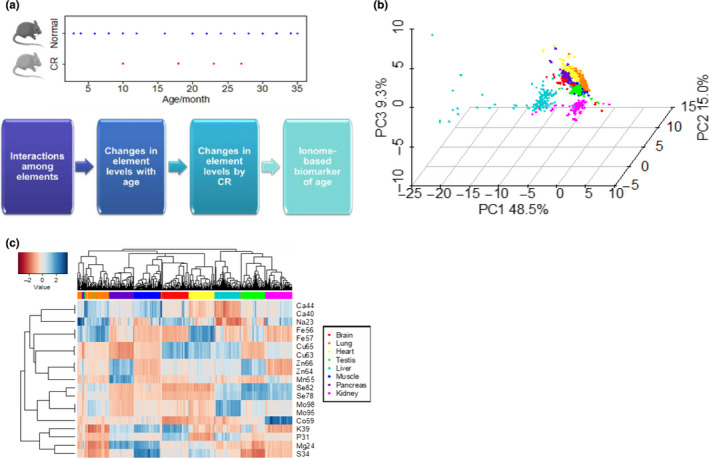
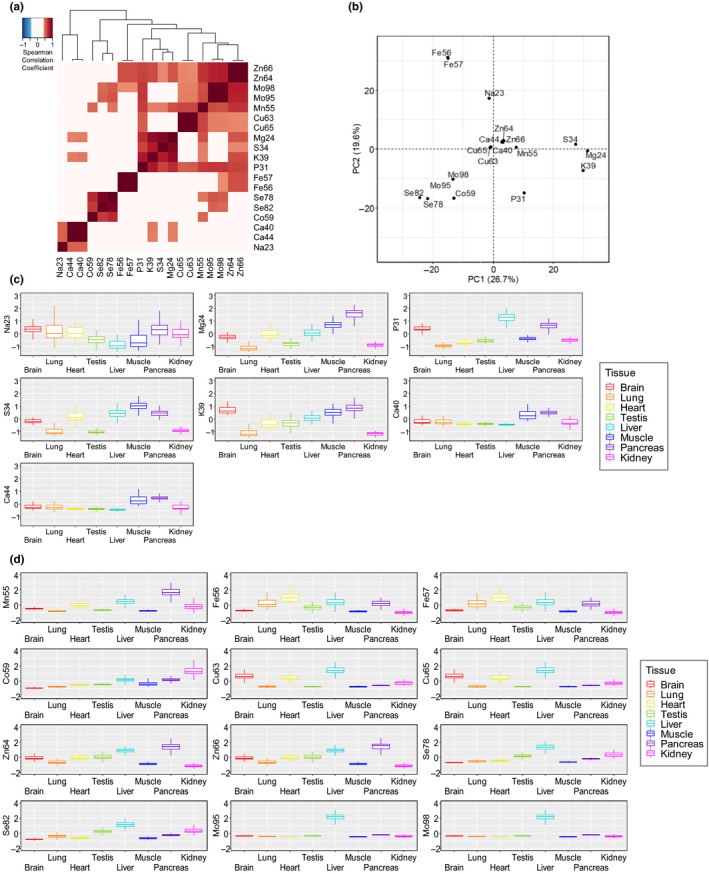
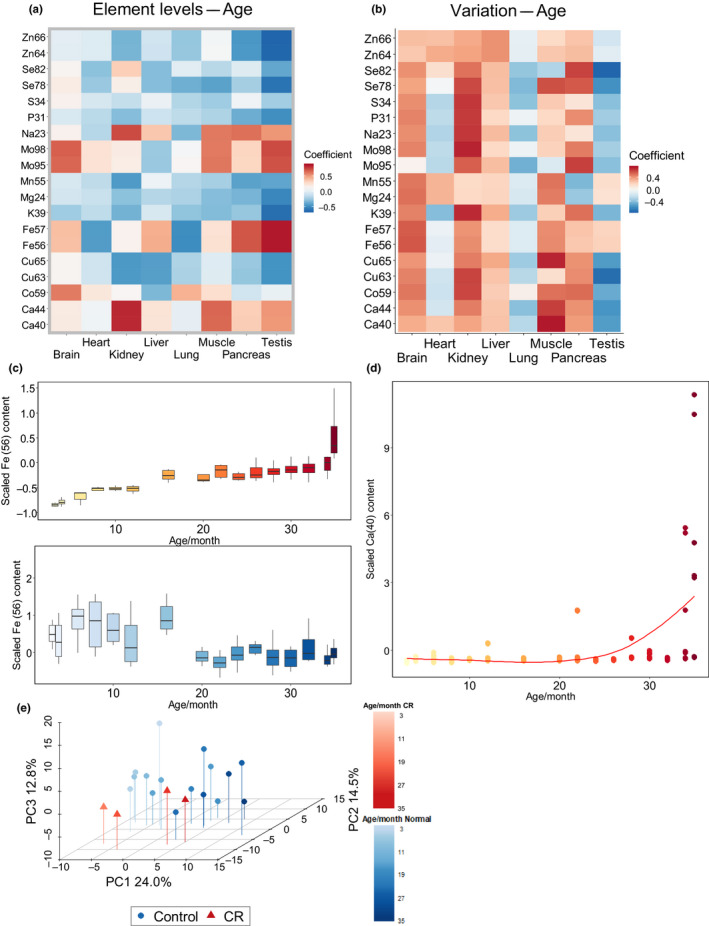
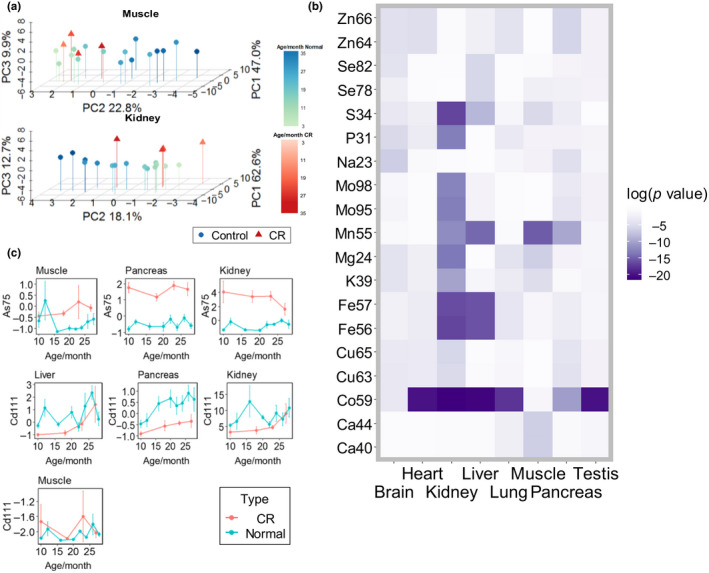
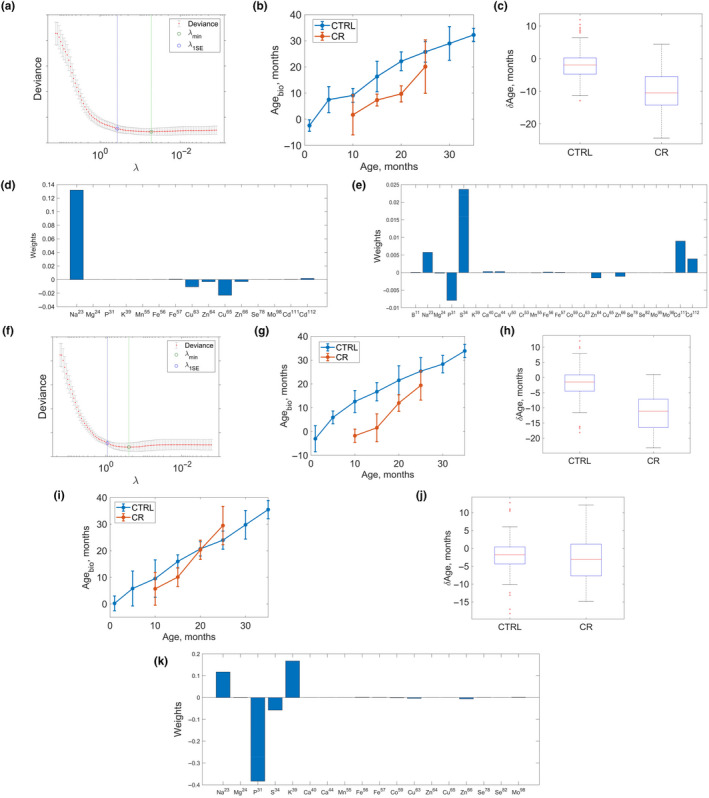
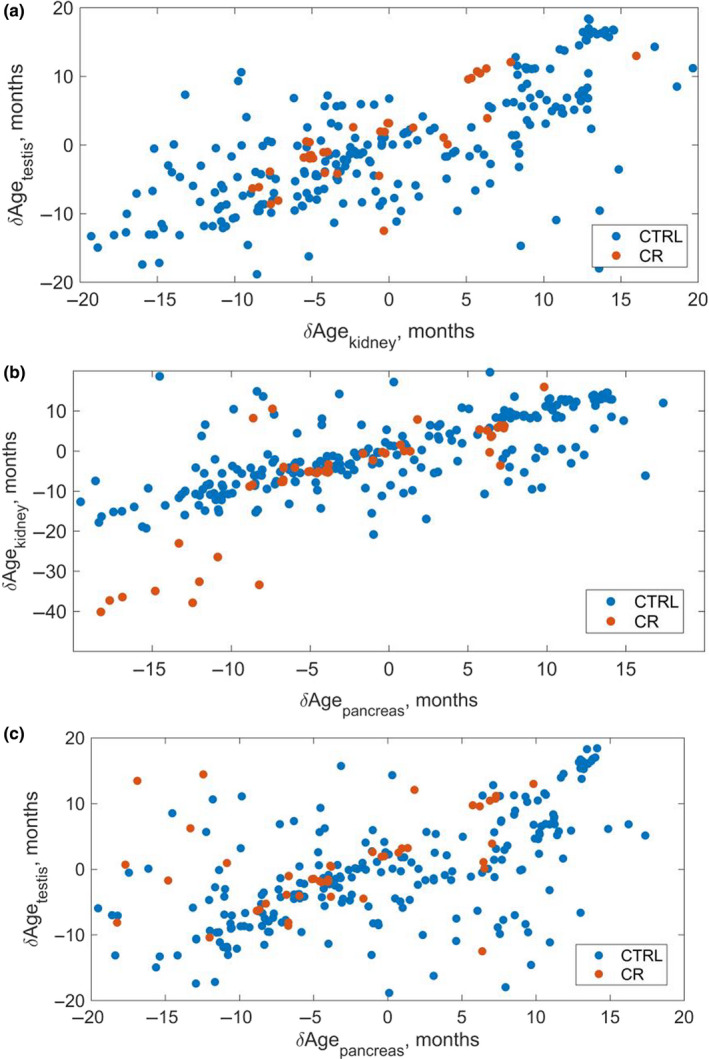
Aging involves coordinated yet distinct changes in organs and systems throughout life, including changes in essential trace elements. However, how aging affects tissue element composition (ionome) and how these changes lead to dysfunction and disease remain unclear. Here, we quantified changes in the ionome across eight organs and 16 age groups of mice. This global profiling revealed novel interactions between elements at the level of tissue, age, and diet, and allowed us to achieve a broader, organismal view of the aging process. We found that while the entire ionome steadily transitions along the young-to-old trajectory, individual organs are characterized by distinct element changes. The ionome of mice on calorie restriction (CR) moved along a similar but shifted trajectory, pointing that at the organismal level this dietary regimen changes metabolism in order to slow down aging. However, in some tissues CR mimicked a younger state of control mice. Even though some elements changed with age differently in different tissues, in general aging was characterized by the reduced levels of elements as well as their increased variance. The dataset we prepared also allowed to develop organ-specific, ionome-based markers of aging that could help monitor the rate of aging. In some tissues, these markers reported the lifespan-extending effect of CR. These aging biomarkers have the potential to become an accessible tool to test the age-modulating effects of interventions.

Keywords: aging; biomarkers of aging; calorie restriction; chemical elements; ionome.


Conflict of interest statement

None declared.

Figures

Figure 1
Figure 1
Overview of mouse organ ionomes. (a) Age distribution of mouse samples and schematic of analyses in the study. Sixteen age groups (3–36 months old) of mice on a standard diet and four age groups (10–27 months old) of mice on calorie restriction were analyzed. All mice were C57BL/6 animals. (b) Principal component analysis of samples. Organ origin is shown with different colors. Replicates are presented as individual points. (c) Heatmap view of samples and elements. Each row represents one element or isotope. Each column represents one particular biological sample. Elements with contents lower than noise in certain tissues (e.g., Cd and As) are shown in Figure S2. Clustering was performed using complete‐linkage method with Euclidean distance measure. The same color scheme of organ of origin (shown on the right) is used for panels (b) and (c)
Figure 2
Figure 2
Features of elemental composition across organs. (a) Correlation coefficient matrix of elements across eight organs. Coefficients >0.4 or <−0.4 are highlighted in color. (b) Principal component analysis of elements. The 19 isotopes are projected on the first two PCs. (c) Macroelement composition of different organs. Comparison between the scaled value of element content is performed for eight organs. (d) Trace element composition of different organs. Comparison between the scaled value of element content is performed for eight organs
Figure 3
Figure 3
Changes in element levels with age. (a) Spearman's correlation coefficient between age and element levels. (b) Spearman's correlation coefficient between age and element coefficient of variation. (c) Distinct age‐related changes in iron levels in the testis and lung. A complete representation of element changes is in Figure S4. (d) Age‐related increase in calcium levels in the testis. Calcium increases sharply in the oldest ages. (e) Principal component analysis of samples based on age and diet. Transition across age is indicated with increased color intensity: Blue circles indicate animals on a standard diet, and red triangles indicate animals on a calorie restriction (CR) diet. The figure shows percent variation explained by the first three components
Figure 4
Figure 4
Effect of calorie restriction on the ionome. (a) Principal component analysis of muscle and kidney samples according to age and diet. Older groups are shown by darker color. Blue: animals on a standard diet. Green: animals on a CR diet. Percent variation explained by the first three components is shown in the Figure. Principal component analysis of other organs is in Figure S5. (b) Heatmap of p values calculated according to Wilcoxon sign‐ranked test between control and calorie restriction (CR) groups and adjusted with Benjamini and Hochberg method. (c) Line plots of As and Cd content in the muscle, pancreas, and kidney. The y axis shows the scaled value of the element content, and the x axis shows the age
Figure 5
Figure 5
Ionome‐based biomarkers of age in mice. (a) Building the ionome marker of age for mouse kidney. Marker deviance is a function of Tikhonov regularization parameter λ (see Methods). λ min corresponds to the minimum of deviance as a function of λ. Deviance itself is identified with error which can be determined performing cross‐validation. The value λ 1 SE corresponds to the deviance 1 standard error away from λ min. (b) Pace of the ionome biological marker of age based on mouse kidney. Biological age of control samples is shown in blue and calorie restriction (CR) samples in red. (c) Difference δAge=Agebiological-Agechronological between chronological ages of mice from which the samples were collected and their biological ages as determined by the kidney ionome clock. The biological age of CR mice is lower on average by 10 months than that of control mice, p = .03 (one‐sided two sample t test). (d) Weights of different elements in the linear combination representing the kidney ionome marker of age. (e) The same for the pancreas ionome clock. (f) Building the ionome marker of age for mouse pancreas, deviance is a function of Tikhonov regularization parameter λ. (g) Pace of the pancreas ionome biological marker of age. The biological age of control samples as a function of their chronological age is shown in blue and that of CR mice in red. (h) Same as Figure 5c, but for the pancreas. The biological age of CR mice was lower on average by 8 months, p = .01 (one‐sided two sample t test). (i) Same as (b) and (g), but for the testis. (j) Same as (c) and (h), but for the testis. (k) Same as (d) and (e), but for the testis
Figure 6
Figure 6
Displacement of ionomic age with respect to chronological age in different tissues. (a) Kidney versus testis. δAge is defined as a difference between the ionomic age of a sample as measured by a particular one‐tissue marker (kidney and testis correspondingly) and the chronological age of the sample. While the constructed ionomic markers of age are essentially different in different tissues (Figure 5), samples with higher displacement of the kidney ionomic age with respect to chronological age generally correspond to those with similarly higher displacement of the testis ionomic age with respect to the chronological age pointing toward biological significance of the measured ionomic age. Blue corresponds to mice on control diet, red—to mice on the calorie restriction (CR) diet. (b) The same for pancreas versus kidney. (c) The same for pancreas versus testis

References

    1. Avila, D. S. , Puntel, R. L. , & Aschner, M. (2013). Manganese in health and disease. Metal Ions in Life Sciences, 13, 199–227. 10.1007/978-94-007-7500-8_7 - DOI - PMC - PubMed
    1. Booth, L. N. , & Brunet, A. (2016). The aging epigenome. Molecular Cell, 62(5), 728–744. 10.1016/j.molcel.2016.05.013 - DOI - PMC - PubMed
    1. Bost, M. , Houdart, S. , Oberli, M. , Kalonji, E. , Huneau, J. F. , & Margaritis, I. (2016). Dietary copper and human health: Current evidence and unresolved issues. Journal of Trace Elements in Medicine and Biology, 35, 107–115. 10.1016/j.jtemb.2016.02.006 - DOI - PubMed
    1. Chellan, P. , & Sadler, P. J. (2015). The elements of life and medicines. Philosophical Transactions of the Royal Society A: Mathematical, Physical and Engineering Sciences, 373(2037), 20140182 10.1098/rsta.2014.0182 - DOI - PMC - PubMed
    1. Fallah, A. , Mohammad‐Hasani, A. , & Colagar, A. H. (2018). Zinc is an essential element for male fertility: A review of Zn roles in men's health, germination, sperm quality, and fertilization. Journal of Reproduction & Infertility, 19(2), 69–81. - PMC - PubMed

Publication types