. 2021 May;17(5):1170-1192.
doi: 10.1080/15548627.2020.1752497. Epub 2020 Apr 23.

Autophagy triggers CTSD (cathepsin D) maturation and localization inside cells to promote apoptosis

Affiliations

Autophagy triggers CTSD (cathepsin D) maturation and localization inside cells to promote apoptosis

Yu-Qin Di et al. Autophagy. 2021 May.

Abstract

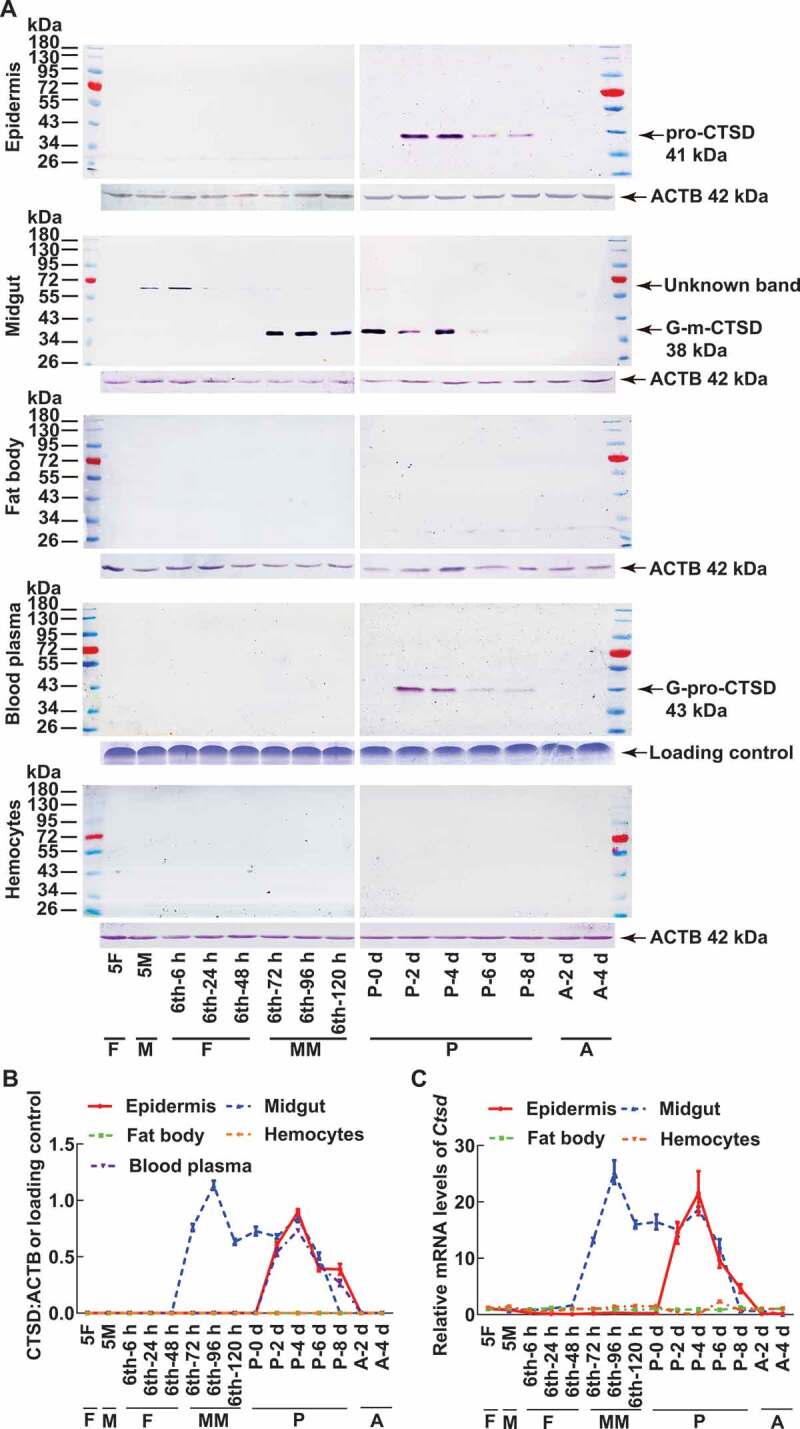
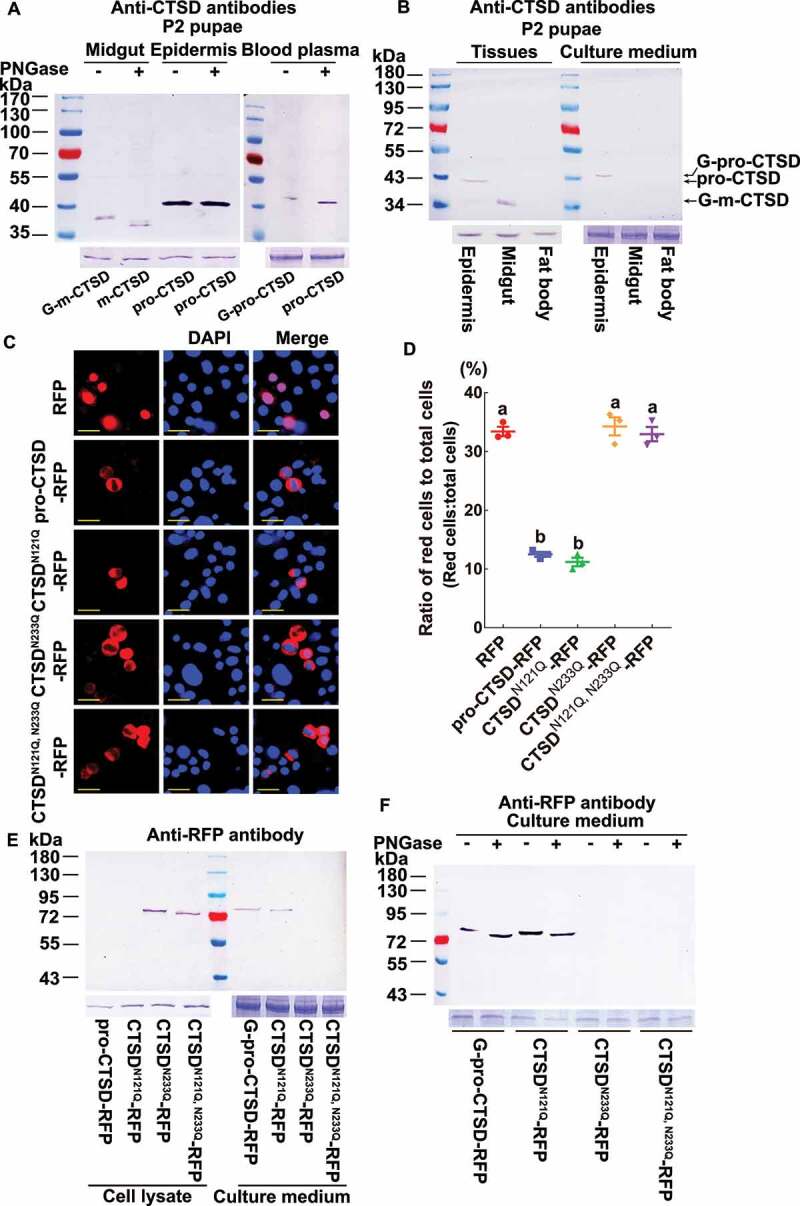
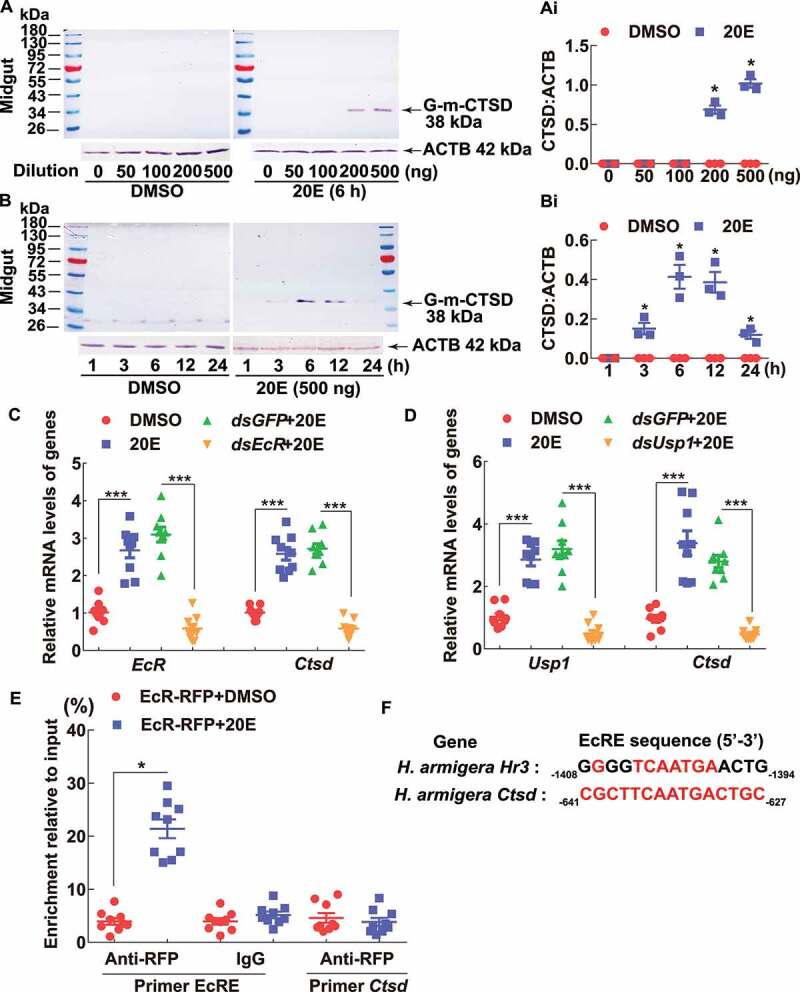
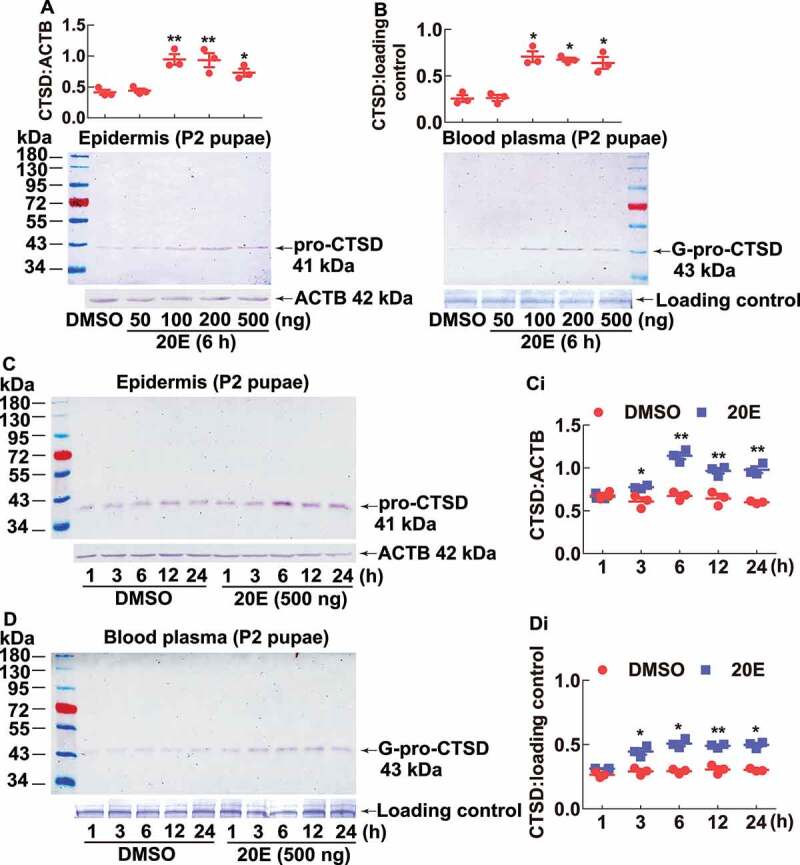
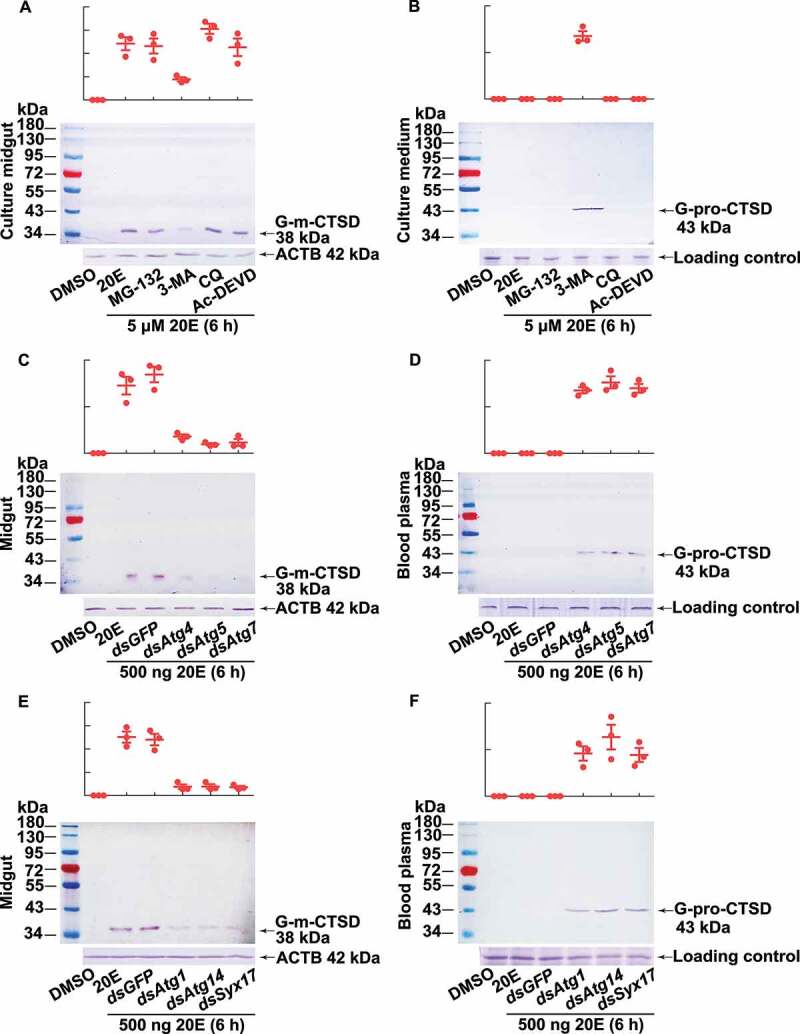
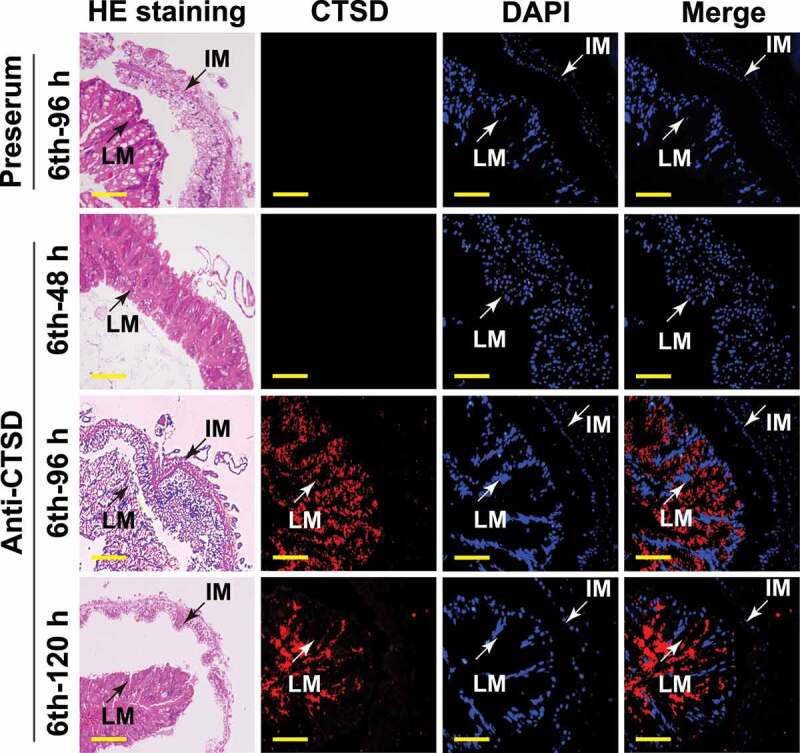
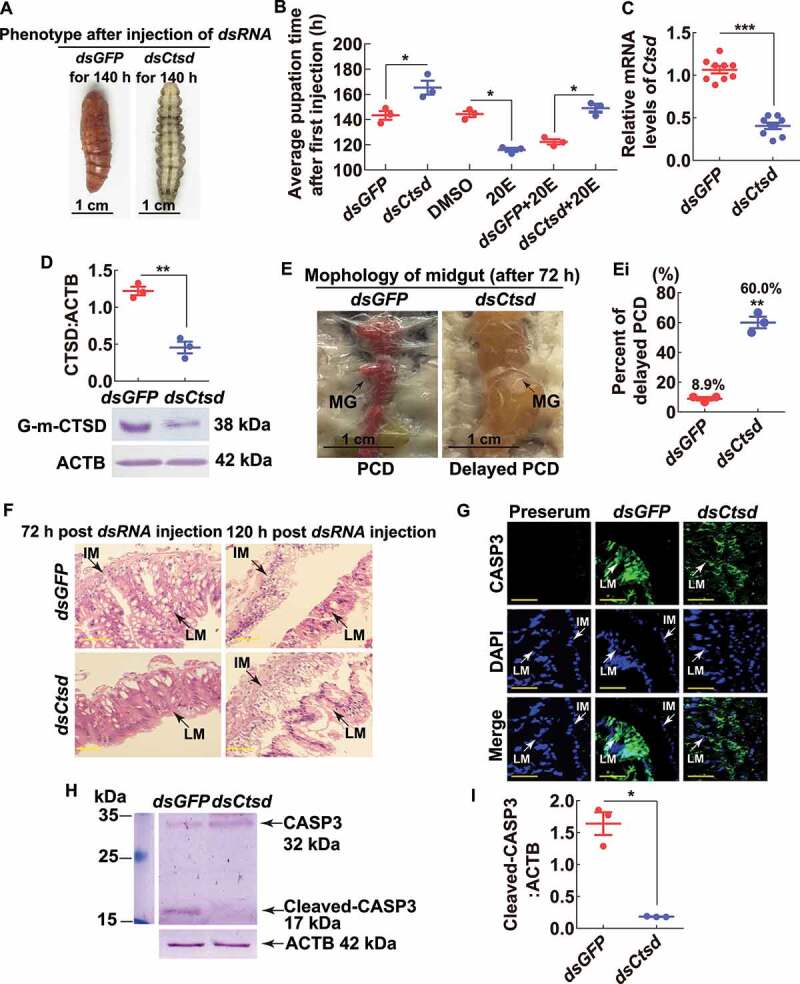
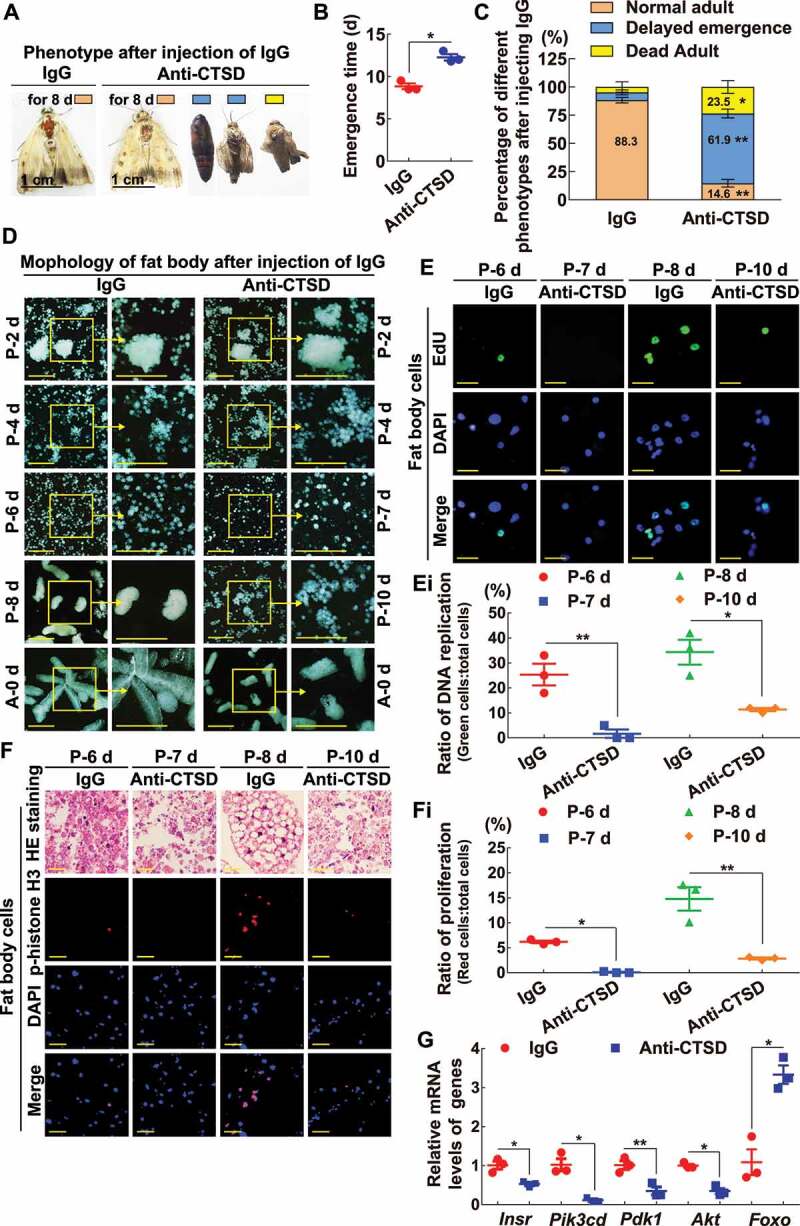
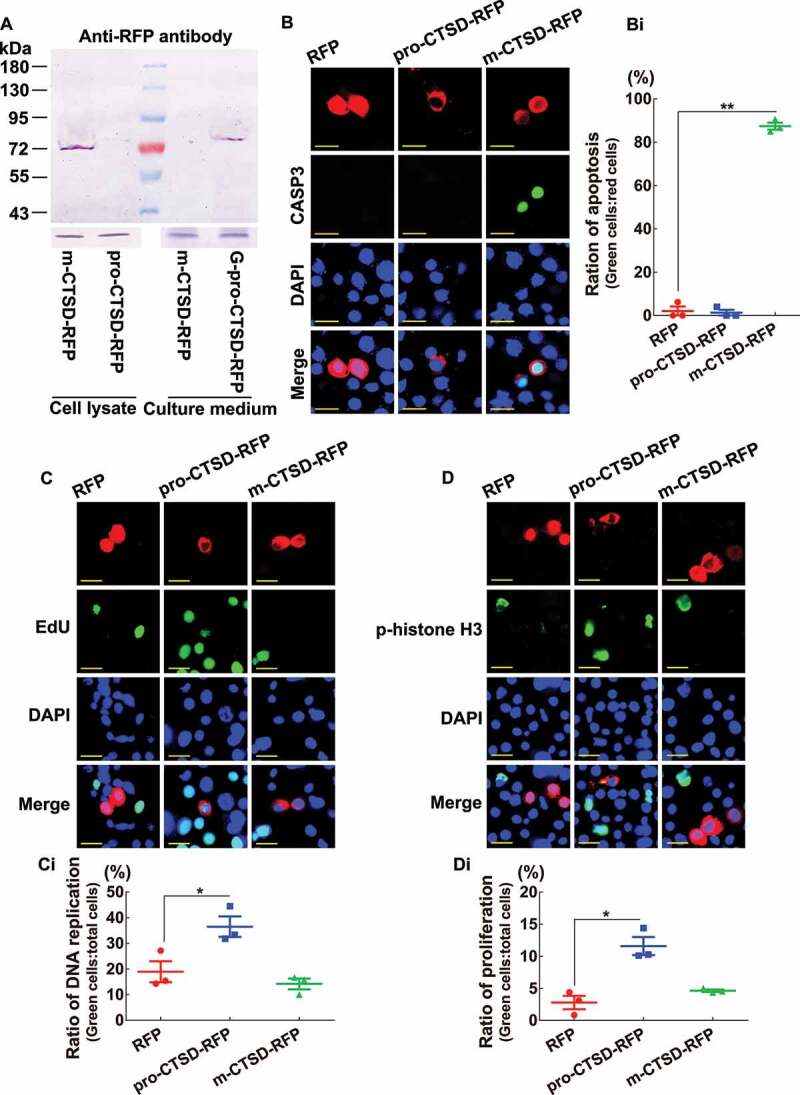
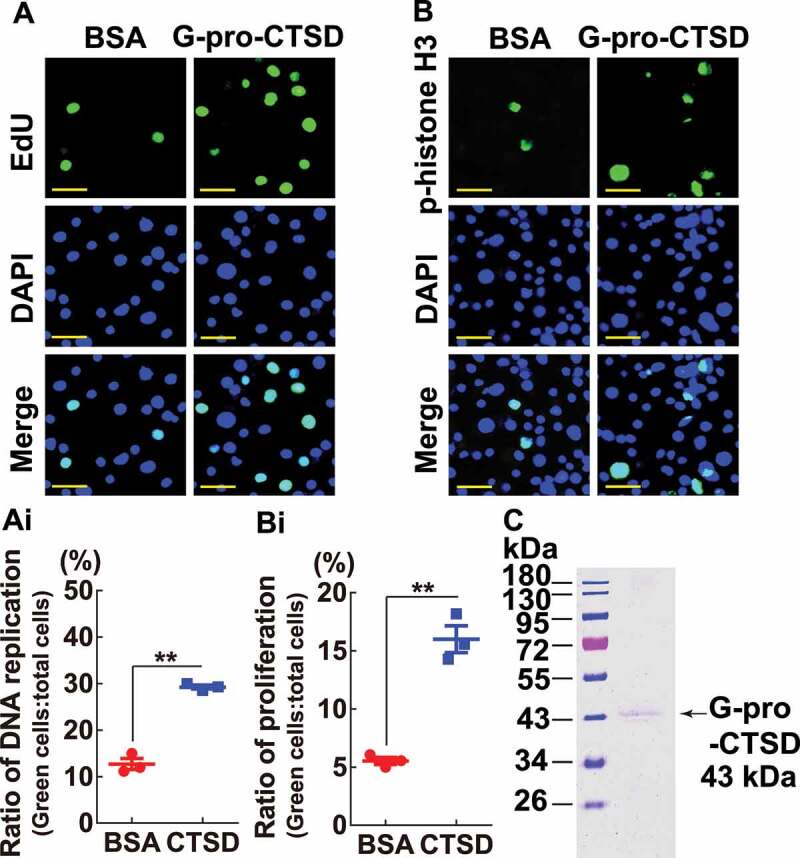
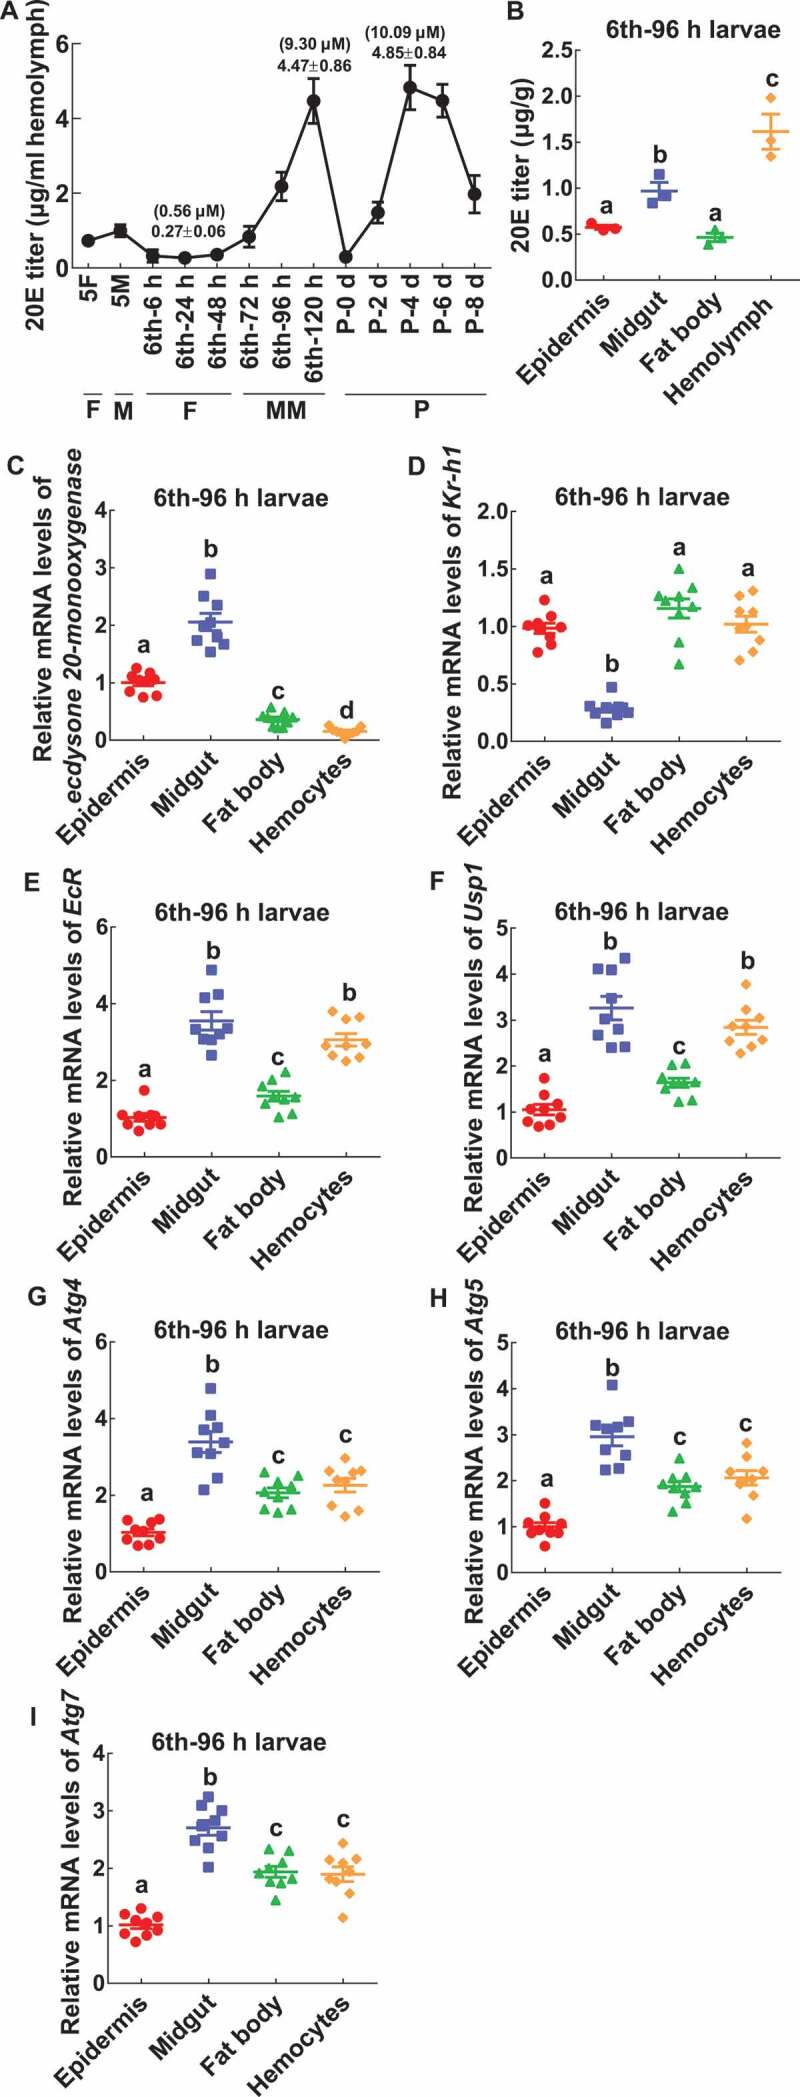
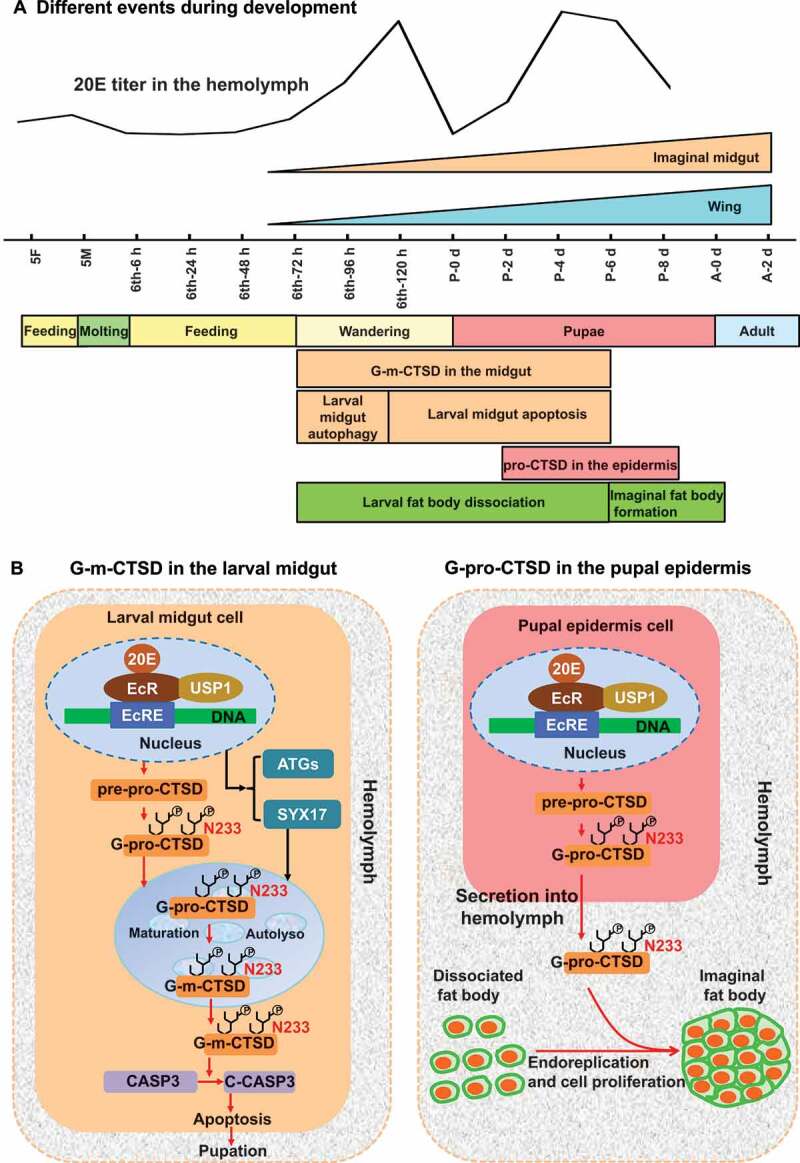
CTSD/CathD/CATD (cathepsin D) is a lysosomal aspartic protease. A distinguishing characteristic of CTSD is its dual functions of promoting cell proliferation via secreting a pro-enzyme outside the cells as a ligand, and promoting apoptosis via the mature form of this enzyme inside cells; however, the regulation of its secretion, expression, and maturation is undetermined. Using the lepidopteran insect Helicoverpa armigera, a serious agricultural pest, as a model, we revealed the dual functions and regulatory mechanisms of CTSD secretion, expression, and maturation. Glycosylation of asparagine 233 (N233) determined pro-CTSD secretion. The steroid hormone 20-hydroxyecdysone (20E) promoted CTSD expression. Macroautophagy/autophagy triggered CTSD maturation and localization inside midgut cells to activate CASP3 (caspase 3) and promote apoptosis. Pro-CTSD was expressed in the pupal epidermis and was secreted into the hemolymph to promote adult fat body endoreplication/endoreduplication, cell proliferation, and association. Our study revealed that the differential expression and autophagy-mediated maturation of CTSD in tissues determine its roles in apoptosis and cell proliferation, thereby determining the cell fates of tissues during lepidopteran metamorphosis.Abbreviations: 20E: 20-hydroxyecdysone; 3-MA: 3-methyladenine; ACTB/β-actin: actin beta; AKT: protein kinase B; ATG1: autophagy-related 1; ATG4: autophagy-related 4; ATG5: autophagy-related 5; ATG7: autophagy-related 7; ATG14: autophagy-related 14; BSA: bovine serum albumin; CASP3: caspase 3; CQ: choroquine; CTSD: cathepsin D; DAPI: 4',6-diamidino-2-phenylindole; DMSO: dimethyl sulfoxide; DPBS: dulbecco's phosphate-buffered saline; DsRNA: double-stranded RNA; EcR: ecdysone receptor; EcRE: ecdysone response element; EdU: 5-ethynyl-2´-deoxyuridine; G-m-CTSD: glycosylated-mautre-CTSD; G-pro-CTSD: glycosylated-pro-CTSD; HaEpi: Helicoverpa armigera epidermal cell line; HE staining: hematoxylin and eosin staining; IgG: immunoglobin G; IM: imaginal midgut; JH: juvenile hormone; Kr-h1: krueppel homologous protein 1; LM: larval midgut; M6P: mannose-6-phosphate; PBS: phosphate-buffered saline; PCD: programmed cell death; PNGase: peptide-N-glycosidase F; RFP: red fluorescent protein; RNAi: RNA interference; SDS-PAGE: sodium dodecyl sulfate-polyacrylamide gel electrophoresis; SYX17: syntaxin 17; USP1: ultraspiracle isoform 1.

Keywords: 20-hydroxyecdysone; CTSD; apoptosis; autophagy; cathepsin D; cell proliferation.


Conflict of interest statement

We declare that there is no any competing interest in relation to the work described.

Figures

Figure 1.
Figure 1.
CTSD was expressed as different forms with tissue and developmental stage specificity. (A) Western blot analysis using antibodies against H. armigera CTSD. The specificity of the antibodies was shown in Fig. S1 to detect CTSD expression profiles in different tissues. The protein of blood plasma was diluted in a ratio of 1:8 with PBS. ACTB was detected as protein quality control. The loading controls were the proteins of hemolymph by SDS-PAGE as the control for blood plasma. 10% SDS-PAGE gel was used in western blot. 5F: 5th instar feeding larvae; 5M: 5th instar molting larvae; 6th-6 h to 6th-120 h: 6th instar 6 h larvae to 6th instar 120 h larvae; P-0 d to P-8 d: pupal stage at day 0 to day 8; A-2 d to A-4 d: adult stage at day 2 to day 4; F: feeding stage; M: molting stage; MM: metamorphic molting stage; P: pupae; A: adult. The protein markers are the same on both sides of the pictures. (B) Quantification of the data in (A) according to three independent replicates using ImageJ software. (C) QRT-PCR to show the mRNA level of Ctsd. All experiments were performed in triplicate. The bars indicate the mean ± SD
Figure 2.
Figure 2.
Molecular masses and glycosylation of CTSD. (A) Examination of the glycosylation of CTSD by western blotting using antibodies against H. armigera CTSD. The proteins from the midgut, epidermis, and blood plasma were isolated from pupae on day 2 and treated with PNGase. The SDS-PAGE gel used in western blot was a 10% gel. ACTB was detected as the protein quality control of tissues. The hemolymph proteins were used for blood plasma control by SDS-PAGE. (B) Identification of the source of G-pro-CTSD in the blood plasma by culturing the isolated midgut, epidermis, and fat body from pupae on day 2 in Grace’s medium. ACTB was detected as the protein quality control of tissues. Grace’s medium was used for tissue culture medium loading control by SDS-PAGE. (C) Immunofluorescence showing the overexpression of the RFP, full-length-CTSD-RFP and its mutants (CTSDN121Q-RFP, CTSDN233Q-RFP, and CTSDN121Q, N233Q-RFP) in HaEpi cells 48 h after transfection, with RFP as a control. Red fluorescence indicates the overexpressed RFP, pro-CTSD-RFP, CTSDN121Q-RFP, CTSDN233Q-RFP, and CTSDN121Q, N233Q-RFP. The blue fluorescence indicates the cell nuclei stained with 4′,6-diamidino-2-phenylindole (DAPI). Scale bar: 20 μm. (D) Statistical analysis of the ratio of red fluorescent cells/total cells in (C) using ANOVA; different lowercase letters indicated significant differences (p < 0.05). The bars indicate the mean ± SD. ImageJ software was used to transform the image data. (E) Western blot detecting the secretion of pro-CTSD-RFP, CTSDN121Q-RFP, CTSDN233Q-RFP, and CTSDN121Q, N233Q-RFP overexpressed for 48 h after transfection. Antibody against RFP was used to detect the proteins. Cell lysate: the cells were collected and subjected to western blot. Culture medium: Grace’s medium of cell culture after being enriched using anti-CTSD polyclonal antibodies. ACTB was detected as the protein quality control of cell lysate. Grace’s medium was used for the enrichment of CTSD control by SDS-PAGE. (F) Western blot detecting the glycosylation of G-pro-CTSD-RFP, CTSDN121Q-RFP, CTSDN233Q-RFP, and CTSDN121Q, N233Q-RFP overexpressed for 48 h after transfection in Grace’s medium. Antibody against RFP was used to detect the proteins. Culture medium: Grace’s medium of cell culture after being enriched using anti-CTSD polyclonal antibodies. The Grace’s medium used for enrichment of CTSD control by SDS-PAGE
Figure 3.
Figure 3.
20E promoted G-m-CTSD expression in the larval midgut. (A) 20E promoted G-m-CTSD expression by dose. Different concentrations of 20E were injected into 6th-6 h larva for 6 h. Equal diluted volume of DMSO (0–500) was used as the solvent control. (B) 20E promoted G-m-CTSD expression by time. 500 ng of 20E was injected into 6th-6 h larva for 1 to 24 h. Equal amounts of diluted DMSO were used as solvent control. (Ai and Bi) Statistical analysis of (A and B). ImageJ software was used to transform the image data. (C and D) QRT-PCR analyzed the mRNA levels of Ctsd after knockdown of EcR and Usp1 by dsEcR and dsUsp1 (2 μg for 48 h) in HaEpi cells followed 20E induction (2 μM for 6 h). dsGFP (2 μg for 48 h) was the negative control. DMSO was the solvent control for 20E. (E) ChIP assay of EcR binding to the upstream region of Ctsd using primers (Table S1). EcR-RFP-His was overexpressed from plasmid pIEx-4-RFP-His in cells for 72 h. The cells were treated with 5 μM 20E for 3 h. DMSO treatment was used as control. The statistical analyses were conducted using Student’s t-test (*p < 0.05, ***p < 0.001) based triplicate. The bars indicate the mean ± SD. (F) Alignment of the EcRE in the 5ʹ-upstream of Hhr3 and Ctsd.
Figure 4.
Figure 4.
20E promoted pro-CTSD expression in the pupal epidermis and G-pro-CTSD secretion into the blood plasma. (A and B) 20E promoted pro-CTSD expression and G-pro-CTSD secretion by dose. Different concentrations of 20E were injected into a pupa on day 2. Equal diluted volume of DMSO was used as the solvent control. The protein markers are the same as (A). (C and D) 20E promoted pro-CTSD expression and G-pro-CTSD secretion in the blood plasma by time. Equal amounts of diluted DMSO were used as solvent control. ACTB was detected as protein quality control. The loading controls were the proteins of hemolymph by SDS-PAGE as the control for blood plasma. (Ci and Di) Statistical analysis of (C and D). ImageJ software was used to transform the image data. The statistical analysis was conducted using Student’s t-test (*p < 0.05, **p < 0.01) based triplicate. The bars indicate the mean ± SD
Figure 5.
Figure 5.
Western blotting showing that CTSD maturation relied on autophagy. (A) G-m-CTSD in the midgut after treatment with different inhibitors. The isolated midgut was cultured in Grace’s medium with MG-132 (2 µM, final concentration), 3-MA (10 µM), CQ (25 µM), and Ac-DEVD/Ac-DEVD-CHO (10 µM) for 1 h, followed by 20E incubation (5 µM for 6 h). DMSO was the solvent control for 20E. (B) The secreted G-pro-CTSD in the culture medium after the treatment as (A). ACTB was detected as protein quality control. Grace’s medium was used for tissue culture medium loading control by SDS-PAGE. (C) G-m-CTSD in the midgut after Atg4, Atg5, and Atg7 knockdown (2 μg dsRNA were injected to sixth instar 6 h larva twice in 48 h), followed by 20E incubation (500 ng for 6 h). dsGFP (2 μg twice in 48 h) was the negative control. (D) The secreted G-pro-CTSD in the blood plasma after Atg4, Atg5, and Atg7 knockdown. (E) G-m-CTSD in the midgut after Atg1, Atg14, and Syx17 knockdown (2 μg dsRNA were injected to sixth instar 6 h larva twice in 48 h), followed by 20E incubation (500 ng for 6 h). dsGFP (2 μg twice in 48 h) was the negative control. (F) The secreted G-pro-CTSD in the blood plasma after Atg1, Atg14, and Syx17 knockdown. ACTB was detected as the protein quality control. The loading controls were the proteins of hemolymph by SDS-PAGE as the control for blood plasma. All experiments were performed in triplicate, and statistical analysis was conducted using ANOVA; different lowercase letters indicated significant differences (p < 0.05). The bars indicate the mean ± SD. ImageJ software was used to transform the image data
Figure 6.
Figure 6.
Immunohistochemical analysis shows CTSD localization in the larval midgut during metamorphosis. Rabbit polyclonal antibodies against CTSD were used. The preserum was used as the negative control. LM: larval midgut; IM: imaginal midgut; hematoxylin and eosin (HE) staining showed the morphology of the midgut; Red fluorescence indicates CTSD; Nuclei were stained with DAPI (blue). Scale bar: 50 μm
Figure 7.
Figure 7.
Injection of Ctsd dsRNA repressed midgut apoptosis and delayed larval-pupal transition. (A) Insect phenotypes 140 h after the first dsRNA injection (2 μg, first at sixth instar 6 h larva and the second at sixth instar 32 h larva). The bar represents 1 cm. (B) Statistical analysis of pupation time after dsRNA injection by Student’s t-test based on three repeats. 30 larvae for each repeat in one treatment. (C and D) Efficiency of knockdown of Ctsd by QRT-PCR and western blotting analysis (10% SDS-PAGE gel), respectively. (E) Morphology of the midgut 72 h after the second dsRNA injection. (Ei) Statistical analysis of delayed PCD from (E). (F) HE staining of midgut 72 h and 120 h after first dsRNA injection, respectively. LM: larval midgut; IM: imaginal midgut; Scale bar: 20 µm. (G) CASP3 location in the midgut after dsRNA injection. Rabbit polyclonal antibodies against CASP3 were used as the primary antibody. LM: larval midgut; IM: imaginal midgut; Green fluorescence indicates CASP3; Nuclei were stained with DAPI (blue). Scale bar: 20 μm. (H and I) Western blot and statistical analysis showing the cleaved-CASP3 after dsRNA injection. All experiments were performed in triplicate, and statistical analysis was conducted using Student’s t-test (*p < 0.05, **p < 0.01, ***p < 0.001). The bars indicate the mean ± SD. ImageJ software was used to transform the image data
Figure 8.
Figure 8.
Neutralization of G-pro-CTSD by antibodies repressed imaginal fat body formation and emergence. (A) Phenotype of an adult after injection of anti-CTSD antibodies for 8 d (4 μg was injected into pupa on day 2 and day 4). IgG was a negative control for the antibody. (B) The time of emergence after the antibody injection (from pupa on day 0 to emergence). (C) The percentage of emergence after the antibody injection. The data were analyzed by Student’s t-test (*p < 0.05, **p < 0.01) based three repeats (3 × 30 larvae). (D) Morphology of the fat body after antibody injection. P-2 d to P-10 d: pupae on day 2 to 10. A-0 d: adult on day 0. Arrows indicated magnification. The bars showed 100 μm. (E) EdU staining DNA replication in the fat body after injection of anti-CTSD antibodies. Green fluorescence: EdU staining cells. Blue fluorescence: DAPI staining nuclei. The bars showed 20 μm. (Ei) Statistical analysis of the DNA replication in (E) by the ImageJ software. (F) p-histone H3 (phospho-histone H3) in the fat body after injection of anti-CTSD antibodies. Red fluorescence: phospho-histone H3 detected by anti-phospho-histone H3 (Ser10) antibodies. Blue fluorescence: DAPI staining nuclei. The bars showed 20 μm. (Fi) Statistical analysis of cell proliferation in (F) by the ImageJ software. (G) QRT-PCR detected the mRNA levels of Insr, Pik3cd, Pdk1, Akt, and Foxo after two days of injecting anti-CTSD antibodies and IgG. All of the experiments were conducted in equal development stages of equal eye pigment. The statistical analysis was performed using three independent replicates by Student’s t-test. Asterisks denote significant differences (*p < 0.05, **p < 0.01)
Figure 9.
Figure 9.
M-CTSD induced apoptosis and pro-CTSD promoted cell proliferation. (A) Western blot showing the overexpression of m-CTSD-RFP and pro-CTSD-RFP in HaEpi cells in Grace’s medium, respectively. An antibody against RFP was used. ACTB and Grace’s medium were used as loading controls for cell lysate and culture medium, respectively (10% SDS-PAGE gel). (B) Detection of cell apoptosis by CASP3 activity. Red fluorescence represents RFP, pro-CTSD-RFP, or m-CTSD-RFP. Green fluorescence represents the CASP3 activity, as assessed using a CASP3 activity detection kit. Blue fluorescence indicates DAPI-stained nuclei. Merge: the superimposed images of the red, green, and blue fluorescence. Scale bar: 20 μm. (Bi) Statistical analysis of CASP3 active cells in (B). (C) Detection of DNA replication by the EdU assay. Red: RFP, pro-CTSD-RFP, and m-CTSD-RFP; Green: EdU; Blue: nucleus stained with DAPI; Merge: the overlapped red, green, and blue fluorescence. Bar: 20 μm. (Ci) Statistical analysis of EdU in (C). (D) Detection of cell proliferation by anti-phospho-histone H3 (Ser10) antibodies. Red: RFP, pro-CTSD-RFP, and m-CTSD-RFP; Green: phospho-histone H3; Blue: nucleus stained with DAPI; Merge: the overlapped red, green, and blue fluorescence. Bar: 20 μm. (Di) Statistical analysis of phospho-histone H3 in (D). All the experiments were performed in triplicate, and statistical analysis was conducted using Student’s t-test (*p < 0.05, **p < 0.01). The bars indicate the mean ± SD
Figure 10.
Figure 10.
G-pro-CTSD promoted DNA replication and cell proliferation. (A and B) Detection of DNA replication and cell proliferation by EdU and anti-phospho-histone H3 (Ser10) antibodies, respectively. The cells were incubated with Grace’s medium with 200 ng/ml G-pro-CTSD for 12 h, with BSA as a control. Green: EdU or phospho-histone H3; Blue: nucleus stained with DAPI; Merge: the overlapped green and blue fluorescence. Bar: 20 μm. (Ai and Bi) Statistical analysis of (A and B). All experiments were performed in triplicate, and statistical analysis was conducted using Student’s t-test (**p < 0.01). The bars indicate the mean ± SD. (C) Detection of G-pro-CTSD purity by 12.5% SDS-PAGE
Figure 11.
Figure 11.
The 20E titer and gene expression in tissues. (A) The 20E titer in the hemolymph. (B) The 20E titer in tissues. (C-I) The relative mRNA levels of ecdysone 20-monooxygenase, Kr-h1, EcR, Usp1, Atg4, Atg5, and Atg7. All the experiments were performed in triplicate, and statistical analysis was conducted using ANOVA; different lowercase letters indicate significant differences (p < 0.05). The bars indicate mean ± SD
Figure 12.
Figure 12.
The chart to interpret the mechanisms of CTSD expression, maturation, secretion, and the dual functions in tissue remodeling under 20E regulation. (A) The time of different events during H. armigera development. (B) Mechanisms of CTSD plays dual functions. In the larval midgut, 20E upregulates CTSD expression and maturation during metamorphic molting. 20E via autophagy triggers G-pro-CTSD maturation to G-m-CTSD, which is retained inside the midgut cells to promote apoptosis by inducing CASP3 cleavage. In the pupal epidermis, G-pro-CTSD was secreted to hemolymph, and N233 glycosylation determines G-pro-CTSD secretion. In the hemolymph, the G-pro-CTSD promotes endoreplication, cell proliferation, and reassociation of the adult fat body. pre: signal peptide; pro: pro-peptide; Autolyso: autolysosome; C-CASP3: cleaved-CASP3

References

    1. Faust PL, Kornfeld S, Chirgwin JM.. Cloning and sequence analysis of cDNA for human cathepsin D. Proc Natl Acad Sci USA. 1985;82(15):4910–4914. - PMC - PubMed
    1. Khalkhali-Ellis Z, Hendrix MJ. Two faces of cathepsin D: physiological guardian angel and pathological demon. Biol Med (Aligarh). 2014;6(2):1–5. - PMC - PubMed
    1. Dean RT. Direct evidence of importance of lysosomes in degradation of intracellular proteins. Nature. 1975;257(5525):414–416. - PubMed
    1. Benes P, Vetvicka V, Fusek M. Cathepsin D–many functions of one aspartic protease. Crit Rev Oncol Hematol. 2008;68(1):12–28. - PMC - PubMed
    1. Stoka V, Turk V, Turk B. Lysosomal cysteine cathepsins: signaling pathways in apoptosis. Biol Chem. 2007;388(6):555–560. - PubMed

Publication types