. 2020 Apr 22;10(4):333-350.e14.
doi: 10.1016/j.cels.2020.03.003.

BraInMap Elucidates the Macromolecular Connectivity Landscape of Mammalian Brain

Affiliations

BraInMap Elucidates the Macromolecular Connectivity Landscape of Mammalian Brain

Reza Pourhaghighi et al. Cell Syst. .

Erratum in

  • BraInMap Elucidates the Macromolecular Connectivity Landscape of Mammalian Brain.
    Pourhaghighi R, Ash PEA, Phanse S, Goebels F, Hu LZM, Chen S, Zhang Y, Wierbowski SD, Boudeau S, Moutaoufik MT, Malty RH, Malolepsza E, Tsafou K, Nathan A, Cromar G, Guo H, Al Abdullatif A, Apicco DJ, Becker LA, Gitler AD, Pulst SM, Youssef A, Hekman R, Havugimana PC, White CA, Blum BC, Ratti A, Bryant CD, Parkinson J, Lage K, Babu M, Yu H, Bader GD, Wolozin B, Emili A. Pourhaghighi R, et al. Cell Syst. 2020 Aug 26;11(2):208. doi: 10.1016/j.cels.2020.08.006. Cell Syst. 2020. PMID: 32853540 No abstract available.

Abstract

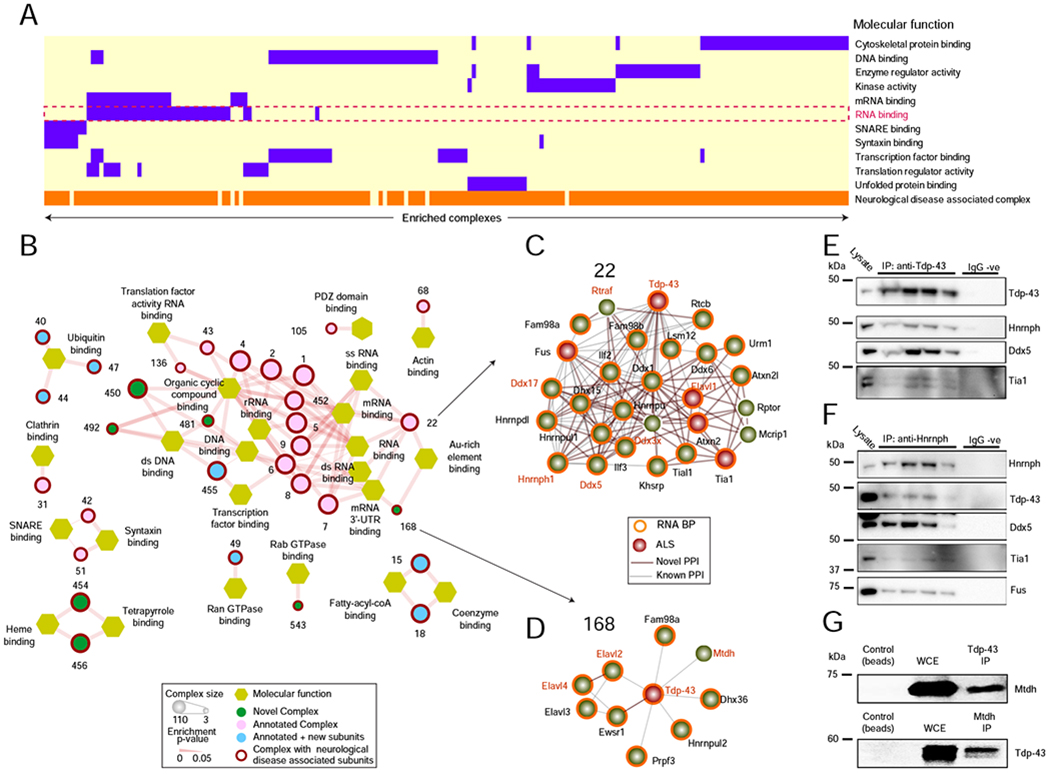
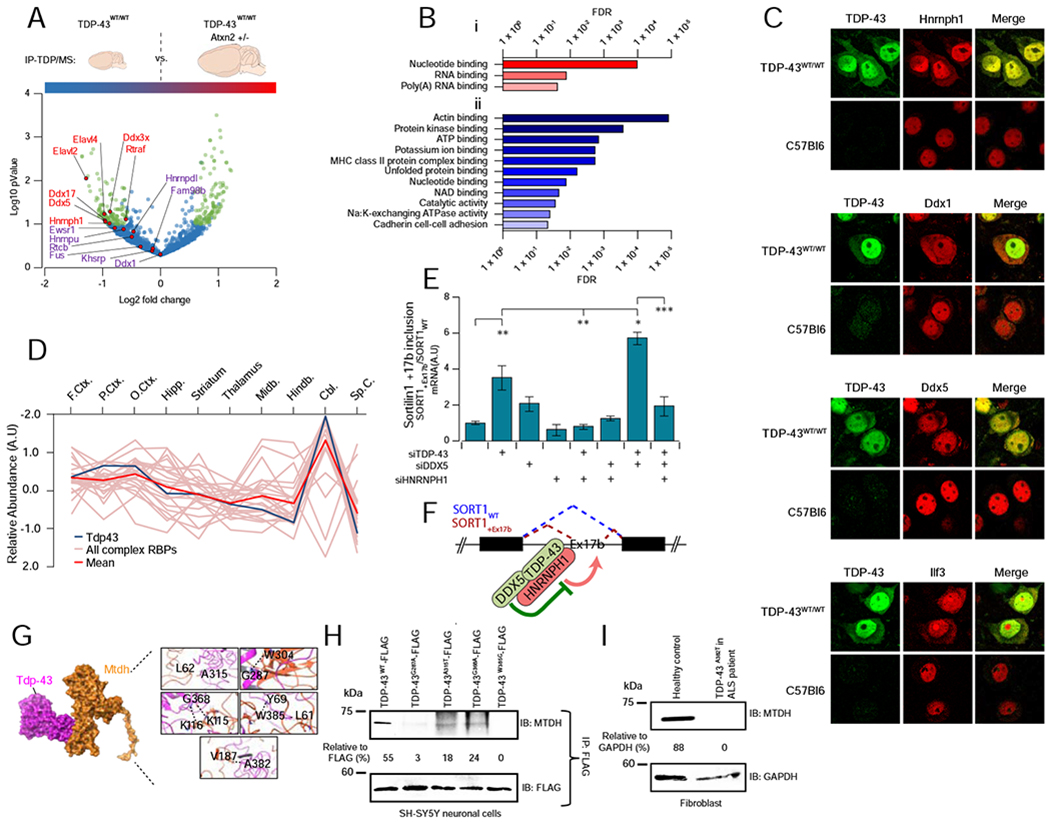
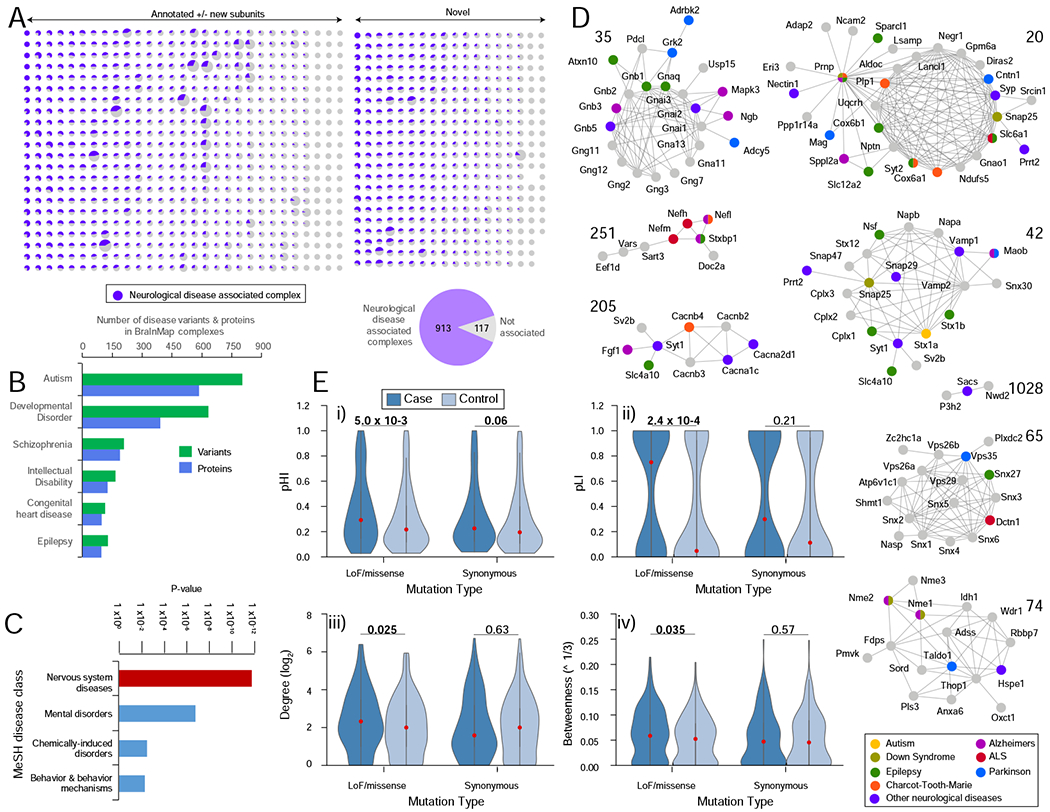
Connectivity webs mediate the unique biology of the mammalian brain. Yet, while cell circuit maps are increasingly available, knowledge of their underlying molecular networks remains limited. Here, we applied multi-dimensional biochemical fractionation with mass spectrometry and machine learning to survey endogenous macromolecules across the adult mouse brain. We defined a global "interactome" comprising over one thousand multi-protein complexes. These include hundreds of brain-selective assemblies that have distinct physical and functional attributes, show regional and cell-type specificity, and have links to core neurological processes and disorders. Using reciprocal pull-downs and a transgenic model, we validated a putative 28-member RNA-binding protein complex associated with amyotrophic lateral sclerosis, suggesting a coordinated function in alternative splicing in disease progression. This brain interaction map (BraInMap) resource facilitates mechanistic exploration of the unique molecular machinery driving core cellular processes of the central nervous system. It is publicly available and can be explored here https://www.bu.edu/dbin/cnsb/mousebrain/.

Keywords: ALS; BraInMap; TDP-43; cofractionation/mass spectometry; complexosome; interaction network; machine learning; neurodegeneration; protein-protein interaction.


Conflict of interest statement

Declaration of Interests The authors declare no competing interests.

Figures

FIGURE 1 –
FIGURE 1 –. Integrative workflow used to generate the mammalian Brain Interactome Map (BraInMap)
A Multi-pronged biochemical fractionation (high performance ion exchange chromatography, HPLC-IEX; isoelectric focusing, IEF; fraction numbers in brackets) of soluble macromolecular assemblies from mouse brain extracts. B Hierarchical clustering of protein co-fractionation intensity profiles recorded by precision liquid chromatography-tandem mass spectrometry (LC-MS/MS); (right) neuronal (top) and housekeeping (bottom) components highlighted. C Enrichment analysis (DAVID (Huang da et al., 2009)) of representative tissue annotations (UniProt) for proteins detected in this work relative to previously published interactome studies. D Schematic depicting steps in the integrative BraInMap computational scoring pipeline: calculation of protein similarity (correlation) metrics, integrative classifier training (EPIC machine learning; (Hu et al., 2019)) and scoring of co-fractionation data (this study) and supporting (public) evidence to predict high-confidence co-complex interactions, followed by network partitioning, benchmarking and meta-analysis (pathobiological relevance) of the predicted complexes. E Enrichment of interacting (co-eluting) brain proteins relative to random pairs for high functional similarity based on association scores reported in MouseNet (v2) (Kim et al., 2016) F Enrichment of orthologs of interacting mouse brain proteins relative to random pairs for high functional association scores in HumanNet (v2) (Hwang et al., 2019).
FIGURE 2 –
FIGURE 2 –. Benchmarking reveals diverse, evolutionarily conserved brain complexes
A Precision Recall (PR) analysis of predicted (EPIC score) co-complex interactions (CORE + EXPANDED) benchmarked against an independent (holdout) set of brain-derived reference assemblies establishes a false discovery rate (FDR) of 11%. B Benchmark quality metrics of putative complexes (this work) versus other interactome maps. Bar length reflects total composite score, calculated as the sum of complex maximal matching ratio, overlap, and accuracy (see STAR methods) relative to select reference curated brain macromolecules. C Bar chart of categorized complexes (partial or complete match to annotated assemblies vs novel). D Highly significant (hypergeometric p-values) overlap of predicted complexes with annotated assemblies compared to randomized protein sets. E Schematic of protein assemblies in BraInMap, sorted according to novelty, showing the distribution of neuron-associated components (purple). F ROC analysis of predicted co-complex interactions showing high agreement with previously reported high confidence orthologous human protein interactions in the InWeb database (Li et al., 2017). G Enrichment of human orthologs of BraInMap complex subunits relative to randomized protein pairs for highly correlated co-fractionation profiles of SHSY5Y neuronal cell extracts. H Enrichment of human orthologs of interacting proteins in BraInMap relative to random pairs for high functional ‘co-fitness’ scores (Pan et al., 2018). I Median expression of orthologs of BraInMap components during development of the human cortex; lines indicate levels of all interacting components (red) versus the subset associated with risk for schizophrenia (olive)(Schizophrenia Working Group of the Psychiatric Genomics et al., 2014), autism (green)(Sanders et al., 2015), or other neurodevelopmental disorders (cyan)(Deciphering Developmental Disorders et al., 2017), as compared to random proteins (magenta). J Schematic of protein domains enriched in BraInMap. Complexes (nodes) sharing two or more domains are joined according to overlap (Jaccard Index). Colors reflect the proportion of domains restricted to brain (blue) or linked to neuropathology (red). Highlighted bipartite subnetwork shows relationship between subunits (ellipses) and domains (diamonds) of a representative assembly (complex 20). K Annotation enrichment (DAVID; (Huang da et al., 2009) in BraInMap relative to previous interactome studies: Gene Ontology (i) cellular component or (ii) biological process terms, or (iii) PFAM domains (Finn et al., 2016).
Figure 3 –
Figure 3 –. Regional- and cell-type selective macromolecules
A Schematic of 10 mouse brain regions subjected to quantitative proteomic profiling and biochemical (HPLC-IEX) fractionation in parallel. B Representative chromatograms and isobaric (TMT) labeling of fractionated regional assemblies. C Highly significant (hypergeometric) agreement between the regional abundance patterns recorded by quantitative profiling versus co-fractionation of BraInMap components (derived by whole tissue analysis) as compared to randomized protein sets. D Complex subunits with highly correlated regional co-fractionation profiles also show significantly co-enrichment (hypergeometric p-value ≤ 0.05, relative to randomized protein pairs) in the same brain compartments as determined by quantitative proteomics (E). E Heatmap clustergram showing complex regional specificity (enrichment P-value ≤ 0.01 by Kolmogorov–Smirnov test) as measured by quantitative proteomics. F Heatmap clustergram of complexes showing preferential (P ≤ 0.01 by KS test after normalization) component mRNA expression in neuronal versus non-neuronal cell classes based on recently published mouse brain scRNA-seq data (Zeisel et al., 2018). G Representative complexes displaying regional (proteomic) and neuronal cell-type (scRNAseq) specificity. Highlighted (red) nodes represent subunits associated with neurological disorders.
FIGURE 4 –
FIGURE 4 –. Compartmentalized brain protein assemblies
A BraInMap assemblies enriched for select neuronal functions (GO annotation terms). B Protein complexes (circles; size proportional to subunit number) enriched for synaptic functions (hexagons). Red outlines indicate links to neurological disorders (examplars shown at bottom). C Protein complexes enriched for mitochondrial (Mt.) functions.
Figure 5 –
Figure 5 –. BraInMap identifies complexes with diverse functions
A BraInMap complexes enriched for RNA-binding (dashed box), other annotation terms (purple), and disease associations (orange). B Sub-network of RNA-related complexes (olive); outline (red) indicates a link to neurological disorder. C Putative module (complex 22), composed of 28 RBPs (orange) with links to ALS (red). D Co-Immunoprecipitation (Western blot) analysis of endogenous Tdp-43 confirms physical associations with Hnrnph, Ddx5, and Tia1 (doublet). Lysate and replicate pulldowns provided; no non-specific signal observed using rabbit or mouse IgG (IgG −ve). E Co-IP analysis of endogenous Hnrnph confirms interactions with Tdp-43, Ddx5, Tia1, and FUS/TLS. F Complex 168 (Tdp-43 co-complexed with Elavl2/3/4, Ewsr1, Fam98a, Dhx36, Hnrnpul2,Mdth, Prpf3). G Reciprocal co-IP analysis confirms the association of Mtdh with Tdp-43 in the mouse brain.
FIGURE 6 –
FIGURE 6 –. RBP complexes are affected in ALS models
A Complex 22 is responsive to neuropathology. Volcano plot summarizing results from co-IP pulldowns of exogenous TDP-43 from cortical lysates from diseased (TDP-43WT/WT) versus protected (TDP-43WT/WTAtxn2[+/−]) transgenic mice. Precipitates were subject to quantitative mass spectrometry to define differential binding to pathogenic TDP-43 (> ±0.50x Log2-fold, −Log10 P < 1, highlighted in green). Interaction of Hnrnph1, Ddx5 and Ddx17 significantly reduced in protected animals (n = 4 per group, students t-test P ≤ 0.05). B Gene ontology molecular function annotations of proteins showing (i) decreased interaction and (ii) increased interaction with transgenic TDP-43 in protected TDP-43WT/WTAtxn2[+/−] murine brain. Shown are terms with FDR−1 >20. C Confocal immunofluorescent microscopy showing a redistribution of Complex 22 RBPs (Hnrnph1, Ddx1, Ddx5, Ilf3) into human TDP-43 positive cytoplasmic accumulations (arrows) in affected cortical neurons of transgenic TDP-43WT/WT mice, which is not seen in wild type animals. Scale bar = 20μm. D The relative brain region expression pattern of Tardbp (TDP-43; dark blue line) closely mirrors the mean expression complex 22 expression (red line). Other RBP components are traced in pink. E Knockdown (siRNA) of TDP-43 or TDP-43/DDX5 together results in the inclusion of Exon 17b of sortilin1 (SORT1) in SH-SY5Y cells (quantified by qPCR), whereas knockdown of interacting partner HNRNPH1 blocks this effect. Graphs show ratio (mean ± SEM) of SORT1 transcripts with/without exon17b (SORT1+Ex17b vs SORT1WT); n = 3 per group (ANOVA with Tukey’s multiple comparison between all groups: * P < 0.05, ** P< 0.01, *** P < 0.001). F Model of TDP-43 and DDX5 interaction illustrates coordinate inhibition of SORT1 Ex17b inclusion, dependent upon joint association with HNRNPH1. G Structural model of mutations in residues of TDP-43 linked to familial ALS (A315T, G287A, G368A, W385G, A382T) that map to the interaction interface with MTDH. H Co-IP analysis showing a reduced association of MTDH in SH-SY5Y cells expressing FLAG-tagged TDP-43 with ALS-relevant mutations at the predicted interaction interface. I TDP-43 interaction with MTDH is abrogated in ALS-patient-derived fibroblasts carrying a pathogenic mutation (A382T), as compared to fibroblasts from a healthy control.
FIGURE 7 –
FIGURE 7 –. Macromolecular links to neurological disorders
A Putative pathophysiological relevance of complexes in BraInMap. Proportion (purple) of subunits of each assembly linked to neurological impairment (see Table S6 for details). B Number of BraInMap components (orthologs) and corresponding human genetic variants associated with specific neuropathologies (see Table S5). C Enrichment (hypergeometric p-value) of complex subunits with links to neuropathology as annotated in DisGeNET (Pinero et al., 2017). D Representative complexes associated with Alzheimer’s (magenta), autism (yellow), amyotrophic lateral sclerosis (red), epilepsy (green), Down syndrome (olive), Charcot-Toothe-Marie syndrome (orange), Parkinson’s (blue), or other neurological disorders (purple). E Enrichment of genes encoding BraInMap components harboring de novo variants for (i) haploinsufficiency (pHI) and (ii) pLI (probability a gene is intolerant to loss of function (LoF) mutations) versus synonymous variants in affected individuals in comparison to unaffected controls; (iii) network degree and (iv) betweeness of genes with de novo LoF/missense or synonymous mutations in neurodevelopmental disorder afflicted individuals or unaffected controls. Violin plot width proportional to protein abundance (red dot, median); P-values (one-tailed U-test; P< 0.05 in bold) shown at the top.

References

    1. Arnold ES, Ling S-C, Huelga SC, Lagier-Tourenne C, Polymenidou M, Ditsworth D, Kordasiewicz HB, McAlonis-Downes M, Platoshyn O, Parone PA, et al. (2013). ALS-linked TDP-43 mutations produce aberrant RNA splicing and adult-onset motor neuron disease without aggregation or loss of nuclear TDP-43. Proceedings of the National Academy of Sciences of the United States of America 110, E736–745. - PMC - PubMed
    1. Ashburner M, Ball CA, Blake JA, Botstein D, Butler H, Cherry JM, Davis AP, Dolinski K, Dwight SS, Eppig JT, et al. (2000). Gene ontology: tool for the unification of biology. The Gene Ontology Consortium. Nature genetics 25, 25–29. - PMC - PubMed
    1. Baker K, Gordon SL, Grozeva D, van Kogelenberg M, Roberts NY, Pike M, Blair E, Hurles ME, Chong WK, Baldeweg T, et al. (2015). Identification of a human synaptotagmin-1 mutation that perturbs synaptic vesicle cycling. The Journal of clinical investigation 125, 1670–1678. - PMC - PubMed
    1. Basu SN, Kollu R, and Banerjee-Basu S (2009). AutDB: a gene reference resource for autism research. Nucleic acids research 37, D832–836. - PMC - PubMed
    1. Becker LA, Huang B, Bieri G, Ma R, Knowles DA, Jafar-Nejad P, Messing J, Kim HJ, Soriano A, Auburger G, et al. (2017). Therapeutic reduction of ataxin-2 extends lifespan and reduces pathology in TDP-43 mice. Nature 544, 367–371. - PMC - PubMed

Publication types

Substances