. 2020 Apr 22;10(4):363-378.e12.
doi: 10.1016/j.cels.2020.03.004.

Gene Networks with Transcriptional Bursting Recapitulate Rare Transient Coordinated High Expression States in Cancer

Affiliations

Gene Networks with Transcriptional Bursting Recapitulate Rare Transient Coordinated High Expression States in Cancer

Lea Schuh et al. Cell Syst. .

Abstract

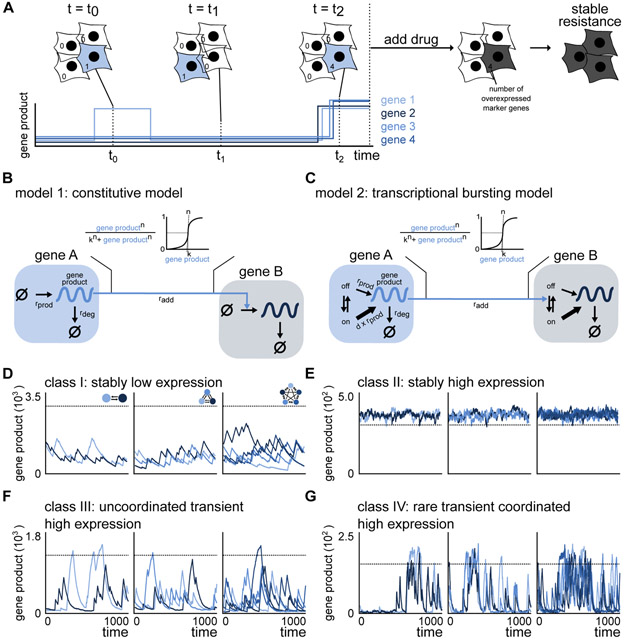
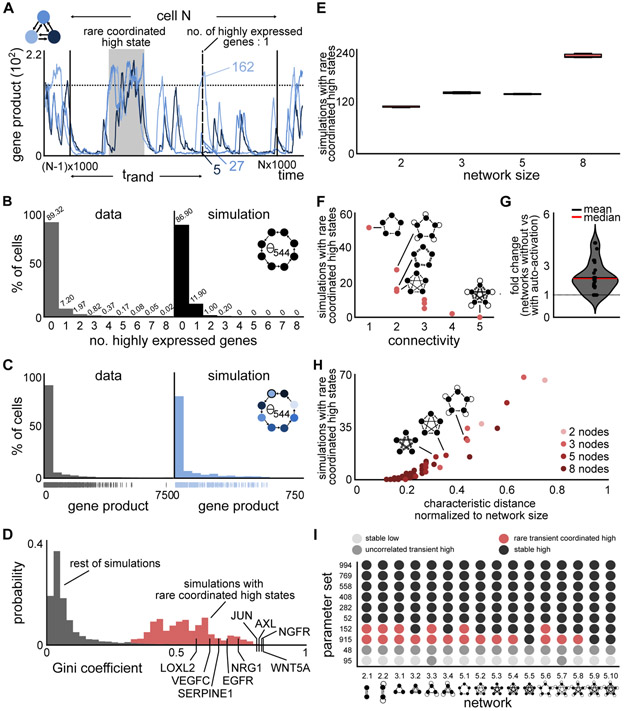
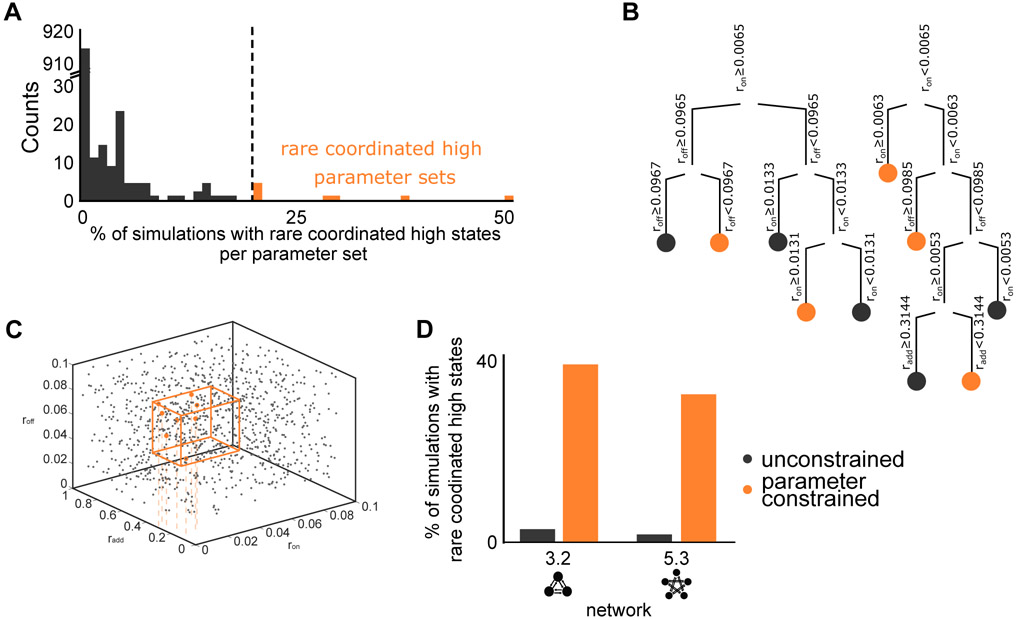
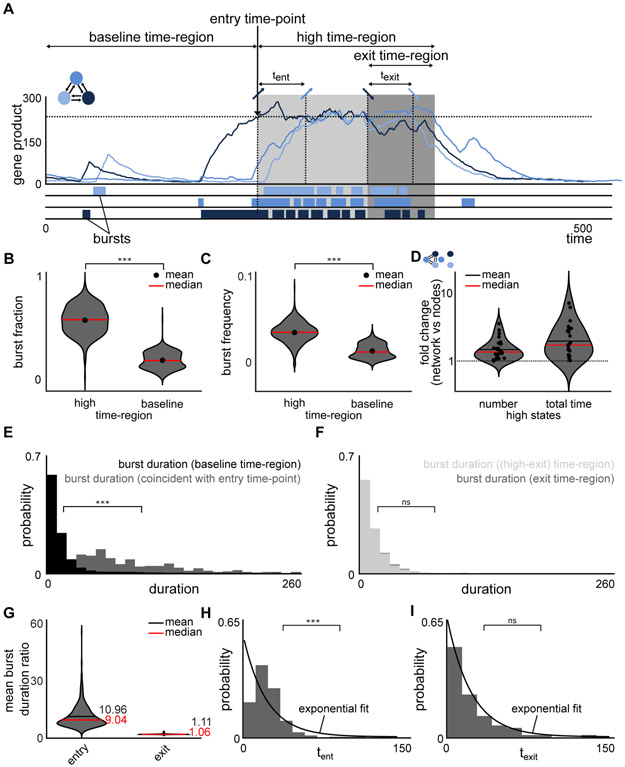
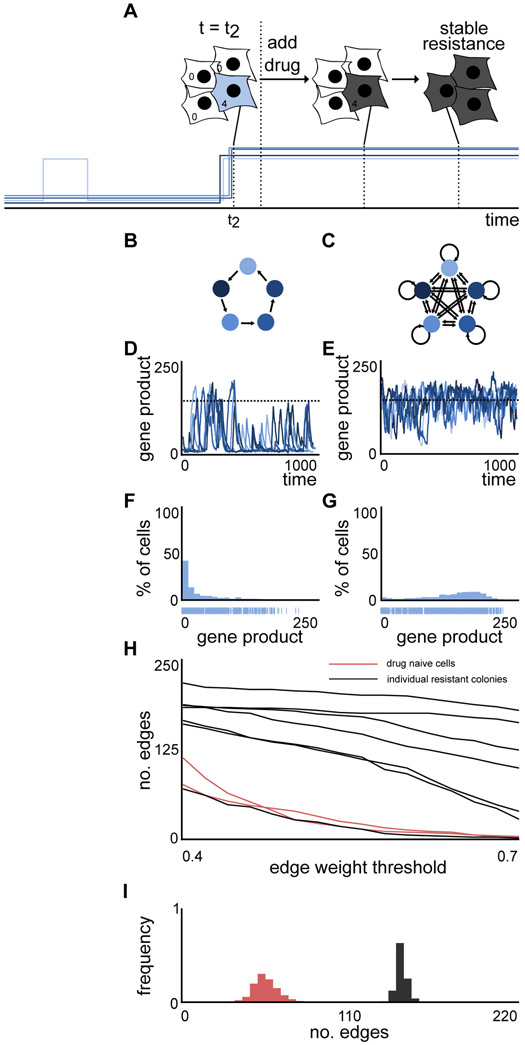
Non-genetic transcriptional variability is a potential mechanism for therapy resistance in melanoma. Specifically, rare subpopulations of cells occupy a transient pre-resistant state characterized by coordinated high expression of several genes and survive therapy. How might these rare states arise and disappear within the population? It is unclear whether the canonical models of probabilistic transcriptional pulsing can explain this behavior, or if it requires special, hitherto unidentified mechanisms. We show that a minimal model of transcriptional bursting and gene interactions can give rise to rare coordinated high expression states. These states occur more frequently in networks with low connectivity and depend on three parameters. While entry into these states is initiated by a long transcriptional burst that also triggers entry of other genes, the exit occurs through independent inactivation of individual genes. Together, we demonstrate that established principles of gene regulation are sufficient to describe this behavior and argue for its more general existence. A record of this paper's transparent peer review process is included in the Supplemental Information.

Keywords: drug resistance; gene expression; melanoma; network; non-genetic; stochasticity.


Conflict of interest statement

Declaration of Interests A.R. receives royalties related to Stellaris RNA FISH probes. All other authors declare no competing interests.

Figures

Figure 1.
Figure 1.. A transcriptional bursting model is able to mimic the rare coordinated high states observed in drug naive melanoma.
(A) Drug naive melanoma cells exist in low (white cells) as well as rare coordinated high (blue cells) states. Cells in the rare coordinated high state characterize the pre-resistant state observed in drug naive melanoma. A schematic of the corresponding expression pattern is shown in the panel below. The cells in a high expression state are more likely to survive and acquire resistance upon drug administration. (B) Schematic of the constitutive model for two nodes. Gene product is either produced at rate rprod or degraded with rate rdeg. Gene regulation is modeled by a Hill function, where the gene product count of the regulating gene A increases the production rate of the gene product of the regulated gene B. (C) Schematic of the transcriptional bursting model for two nodes. DNA is either in an inactive (off) or active (on) state. Transitions take place with rates ron and roff, where gene product is synthesized with rates rpod and d*rprod, respectively, d>1. Gene product degrades with rate rdeg. Gene regulation is modeled by a Hill function, where the gene expression of the regulating gene A increases the activation of the DNA of the regulated gene B. (D-G) Depending on the network and the parameters of the transcriptional bursting model, we observe stably low expression (D), stably high expression (E), uncoordinated transient high expression (F) and rare transient coordinated high expression (G). See also Figure S1.
Figure 2.
Figure 2.. Simulations of the transcriptional bursting model show similar behavior at the population level as the drug naive melanoma cells.
(A) Frame of simulation showing rare coordinated high state (shaded area). The 1,000,000 time unit simulation is split into frames of 1,000 time units to create a simulated cell population (shown for cell N). For a randomly determined time-point trand, the number of simultaneously highly expressed genes and the gene count per gene per cell are evaluated. The network of the corresponding simulation is given in the top left corner. (B,C) The simulated number of simultaneously highly expressed genes and expression distribution at the population level are qualitatively similar to experimental data from a drug naive melanoma population (data from (Shaffer et al., 2017)). The percentages are indicated above the histogram (in B). The network and parameter set as well as the particular node (in C) used for comparison are shown in the right panel. (D) The Gini indices of simulations of rare coordinated high states are substantially higher than of simulations not showing rare coordinated high states. The experimentally measured expression distributions have similar Gini indices than simulations with rare coordinated high states. (E) Total number of rare coordinated high states were extracted for simulations of different networks sizes, containing either 2, 3, 5, or 8 nodes to see if they occur across networks of different sizes. Rare coordinated high states were found to exist ubiquitously across all possible networks of all analyzed network sizes. The measurements were performed via three independent and randomly sampled trand (median, 25th and 75th percentiles). (F) The frequency of rare coordinated high states depends on the network connectivity, which is defined as number of ingoing edges for any node of the network. Shown here is the dependence for all 5-node networks, such that increasing connectivity within all 5-node networks leads to a decrease in the number of simulations with rare coordinated high states. Each dot represents a particular network topology within the possible space of 5-node networks. (G) Effect of adding auto-activation (self-loop) to networks on the number of simulations with rare coordinated high states. Networks with auto-activation exhibit simulations with rare coordinated high states less frequently than the same networks without auto-activation. Fold-change is calculated by dividing the number of simulations with rare coordinated high states for networks containing auto-activation with the number of simulations with rare coordinated high states for the same networks without auto-activation. Each dot represents one of the 96/2 = 46 direct network comparisons. Network comparisons where one of the networks did not give rise to simulations with rare coordinated high states were discarded. (H) The frequency of simulations with rare coordinated high states depends on the characteristic distance, defined as the average shortest path length between pairs of nodes of the network. With increasing characteristic distance (normalized to network size), more simulations show rare coordinated high states. Each dot represents the characteristic distance of one of the 96 networks. Each network size is represented by a unique color. (I) The frequency of occurrence of simulations with rare coordinated high states is dependent on the choice of model parameters. Specifically, simulations of a particular parameter set across different networks and sizes show largely the same class of gene expression profiles. Each row corresponds to specific parameter sets within the space of all parameter sets analyzed. Each column name corresponds to a particular network, and the underlying network is drawn below the column name. See also Figure S2, Figure S3, Figure S4 and Figure S5.
Figure 3.
Figure 3.. Transcriptional bursting rates influence the formation of rare coordinated high states.
(A) Histogram of the percentage of simulations with rare coordinated high states per parameter set to identify the parameter sets that favourably give rise to simulations with rare coordinated high states. Each of the 96 networks is simulated for every single of the 1000 parameter sets, where not all 96 of these simulations give rise to rare coordinated high states. The eight rare coordinated high parameter sets, marked in orange, produce rare coordinated high states in more than 20% (more than 19 out of the 96 simulations) of simulations and lie at the tail of the histogram. The cut-off (dashed line) marks the 20%. (B) Decision tree optimization was performed to identify differentiating features of the rare coordinated high parameter sets (orange in Figure 3A) from the rest (gray in Figure 3A). Decision tree analysis revealed that only three out of seven parameters, ron, roff, and radd, show a strong correlation with the rare coordinated high parameter sets. Each arm represents a decision, where the decision is marked on top, and each colored dot represents a final class. (C) Three dimensional representation of all tested 1000 parameter sets for ron, roff, and radd show that the rare coordinated high parameter sets are narrowly constrained in the 3D space (orange dots). The orange box indicates the constrained parameter space enclosing all rare coordinated high parameter sets used for analysis in (D). (D) Comparison between the original 1000 parameter sets and new 1000 parameter sets sampled from the constrained region (orange box in Figure 3C) containing all eight rare coordinated high parameter sets. As compared to the original parameter sets, constrained region parameter sets strongly favor the formation of rare coordinated high states for both of the networks tested (3.2 and 5.3). 3.2 and 5.3 correspond to particular networks (outlined below each bar) of network size three and five, respectively. See also Figure S4 and Figure S6.
Figure 4.
Figure 4.. Rare coordinated high state is initiated by a long transcriptional burst, maintained by an increase in burst frequency and terminated according to a random process.
(A) An exemplary high region, with a baseline time-region, entry time-point, high time-region and an exit time-region. The time intervals for an additional gene to enter and exit the high region are marked by tent and texit, respectively. The bursts below the exemplary simulation are representative schematics. (B) Burst fraction, defined as the number of time points the system is in a burst divided by the total number of time points, was calculated for baseline time-region and high time-region for all (n = 594) simulations that produce rare coordinated high states and compared them using violin plots. The burst fraction is significantly higher in the high time-region as compared to the baseline time-region (two-sample Kolmogorov-Smirnov test, p-value < 0.001), implying that enhanced transcriptional activity facilitates the maintenance of rare coordinated high states. (C) Burst frequency, defined as the number of bursts divided by the total number of time points, was calculated for baseline time-region and high time-region for all (n = 594) simulations that produce rare coordinated high states and compared them using violin plots. The frequency of transcriptional bursts is increased in the high time-region (two-sample Kolmogorov-Smirnov test, p-value < 0.001), implying that enhanced transcriptional activity is caused by more frequent bursts rather than prolonged bursts. (D) Violin plots of the fold change in number of high states and total time spent in high states for network 3.2 and its unconnected graph. Positive regulatory interactions between the connected nodes (network) leads to an increased number of and total time in high states in comparison to independent nodes. Fold-change is calculated by dividing the number of high states (total time spent in high states) for network 3.2 with the number of high states (total time spent in high states) for the unconnected graph. Each dot represents one of the 26 simulations showing rare coordinated high states for network 3.2. (E) Distributions of burst duration in the baseline time-region (black) and those coincident with entry time-point (gray) (see Figure 4A). The bursts coincident with entry time-points are significantly longer than bursts in the baseline time-region (two-sample Kolmogorov-Smirnov test, p-value < 0.001). (F) Distributions of burst duration in the high time-region but not the exit time-region ((high-exit) time-region) (light gray) and those in the exit time-region (dark gray) (see Figure 4A). There is no statistically significant difference between the distributions underlying the duration of bursts in the high time-region and the exit time-region (two-sample Kolmogorov-Smirnov test, p-value > 0.05). (G) Violin plots of the mean burst duration ratios for entry and exit (nentry= nexit = 594), where mean burst ratio represents the difference in means of the burst duration distributions (see FigureE-F) per simulation for all simulations with rare coordinated high states. Ratio close to 1 suggests no difference between the two regions. While the mean (and median) burst duration ratio between entry time-point and baseline time-region is considerably increased, the mean (and median) burst duration ratio between bursts in the exit time-region and in the rest of the high time-region are comparable for all simulations with rare coordinated high states. (H,I) Distributions of the time intervals between genes entering (H) and exiting (I) the high time-region, denoted by tent and texit respectively in Figure 4A, are distributed differently for two representative simulations. While the time intervals for entering (tent) the high time-region are not exponentially distributed (H) (and hence not random), the time intervals for exiting (texit) the high time-region are exponentially distributed (I) (Lilliefors test, p-value < 0.001 and > 0.05, respectively). See also Figure S7.
Figure 5.
Figure 5.. Increased connectivity of a network leads to stable high expression which is also observed in emerging resistant colonies post-drug treatment.
(A) Upon drug treatment, the surviving cells acquire stable resistance. A schematic gene expression pattern is shown below. (B,C) Networks of size 5 with low (B) (1) and high (C) (5) connectivity and corresponding (D,E) simulations. (F,G) The expression distributions are determined by taking the counts of simulated gene products per 1000 time units (see Figure 2A) of simulations (D,E) corresponding to the lowly (B) and highly (C) connected networks. The gene expression distribution of the highly connected network (G) does not exhibit heavy-tails while the simulation of the lowly connected network (F) exhibits heavy-tails. (H) Comparison of the connectedness of the underlying inferred gene regulatory networks of drug naive cells and resistant colonies (post drug treatment) using the Phixer algorithm for network inference analysis. Total number of edges is calculated for different edge weight thresholds, defined as the threshold at which an inferred edge is assumed to be present in the inferred gene regulatory network. For all the edge weights investigated, six out of seven resistant colonies have inferred gene regulatory networks with higher numbers of edges than drug naive cells, suggesting that the gene regulatory networks underlying resistant colonies are more strongly connected. (I) Applying the network inference analysis 1000 times for a fixed edge weight threshold of 0.45 gives distributions for the number of edges in the inferred gene regulatory networks for both drug naive cells (red) and resistant colonies (black) (distributions shown for one example each). The distribution of number of edges in the inferred gene regulatory network is considerably increased for the resistant colony. See also Figure S8.

References

    1. Antolović V et al. (2017) ‘Generation of Single-Cell Transcript Variability by Repression’, Current biology: CB, 27(12), pp. 1811–1817.e3. - PMC - PubMed
    1. Bartman CR et al. (2016) ‘Enhancer Regulation of Transcriptional Bursting Parameters Revealed by Forced Chromatin Looping’, Molecular cell, 62(2), pp. 237–247. - PMC - PubMed
    1. Breiman L et al. (1984) Classification and Regression Trees (Wadsworth Statistics/Probability). 1 edition. Chapman and Hall/CRC.
    1. Chen H and Larson DR (2016) ‘What have single-molecule studies taught us about gene expression?’, Genes & development, 30(16), pp. 1796–1810. - PMC - PubMed
    1. Corrigan AM et al. (2016) ‘A continuum model of transcriptional bursting’, eLife, 5, p. e13051. - PMC - PubMed

Publication types

MeSH terms

Substances