. 2020 Jul:140:103395.
doi: 10.1016/j.fgb.2020.103395. Epub 2020 Apr 20.

Genomic diversity of the human pathogen Paracoccidioides across the South American continent

Affiliations

Genomic diversity of the human pathogen Paracoccidioides across the South American continent

Marcus de Melo Teixeira et al. Fungal Genet Biol. 2020 Jul.

Abstract

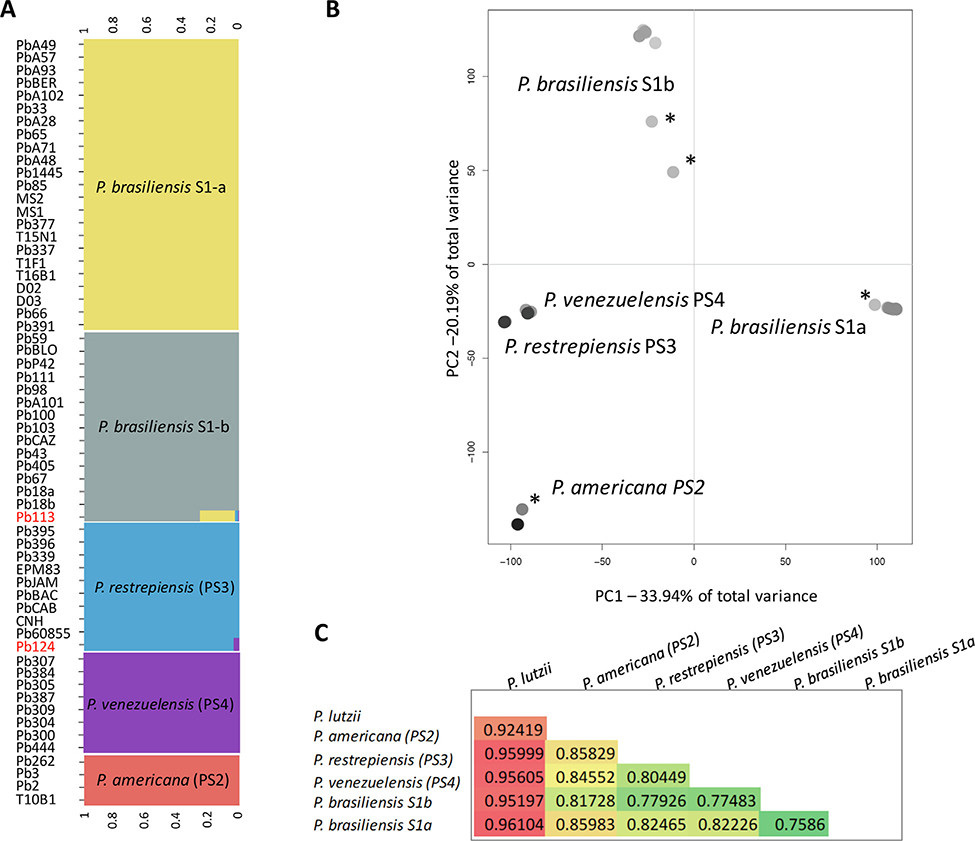
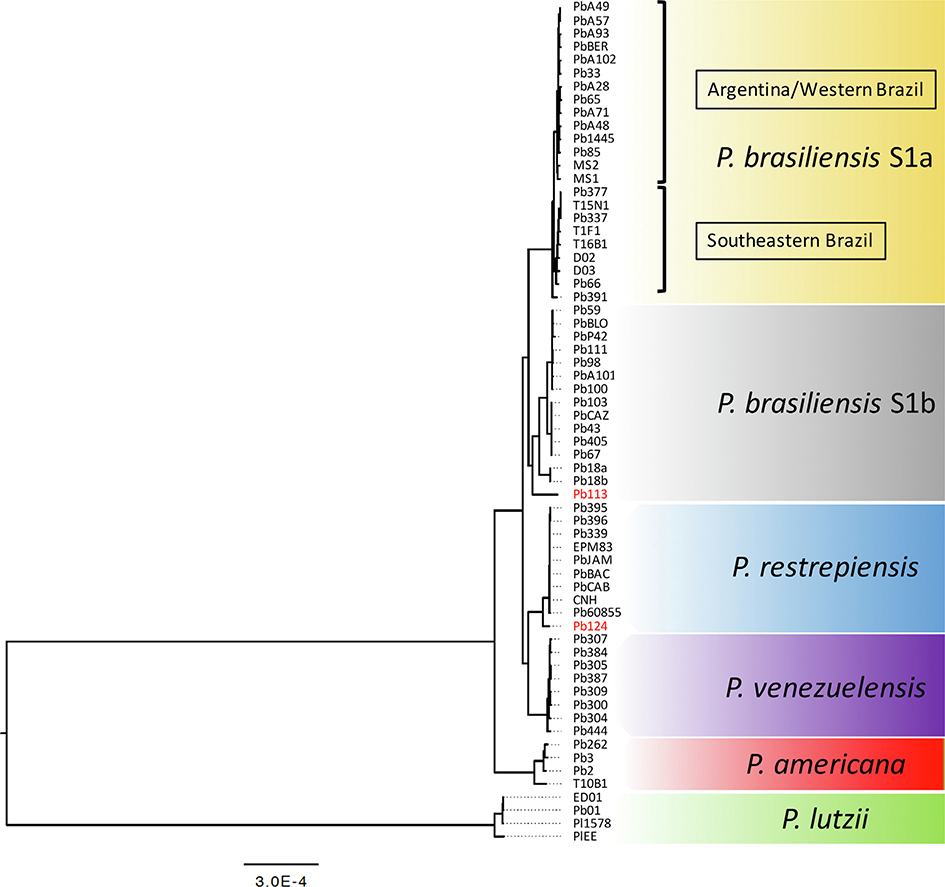
Paracoccidioidomycosis (PCM) is a life-threatening systemic mycosis widely reported in the Gran Chaco ecosystem. The disease is caused by different species from the genus Paracoccidioides, which are all endemic to South and Central America. Here, we sequenced and analyzed 31 isolates of Paracoccidioides across South America, with particular focus on isolates from Argentina and Paraguay. The de novo sequenced isolates were compared with publicly available genomes. Phylogenetics and population genomics revealed that PCM in Argentina and Paraguay is caused by three distinct Paracoccidioides genotypes, P. brasiliensis (S1a and S1b) and P. restrepiensis (PS3). P. brasiliensis S1a isolates from Argentina are frequently associated with chronic forms of the disease. Our results suggest the existence of extensive molecular polymorphism among Paracoccidioides species, and provide a framework to begin to dissect the connection between genotypic differences in the pathogen and the clinical outcomes of the disease.

Keywords: Gran Chaco; Paracoccidioides; Phylogenomics; Population genetics.


Conflict of interest statement

Declaration of Competing Interest The authors declare no conflicts of interest.

Figures

Fig. 1.
Fig. 1.
Genome wide genetic variation is portioned across species boundaries in Paracoccidioides. A. Probability of belonging to a cluster when K = 5, the most likely clustering, in Paracoccidioides based on Bayesian algorithm fastSTRUCTURE. Each column represents the genotype of an individual. B. Genetic variation in natural Paracoccidioides populations inferred by Principal Component Analysis (PCA). Only the first two PCs are plotted as they encompass over 50% of the genetic variance. The bar plots of eigenvalues (the inset plot) show the number of retained principal components. PC1 explains 33.94% while PC2 explains 20.19% of the total variance respectively. Individuals marked with asterisks represent potentially admixed strains. C. Triangular matrix showing the mean Fst value in all pairwise comparisons within the P. brasiliensis species complex.
Fig. 2.
Fig. 2.
The genealogical relationships among Paracoccidioides isolates. A. Maximum Likelihood phylogenetic tree generated by whole-genome SNP typing reveals the five genetic clusters: P. brasiliensis (S1a), P. brasiliensis (S1b), P. americana (PS2), P. restrepiensis (PS3), and P. venezuelensis (PS4). A. Branch length is proportional to mutations accumulated for each lineage. P. lutzii was used as the outgroup and the phylogenetic groups are highlighted and supported by both ultrafast bootstraps or Shimodaira–Hasegawa-like approximate likelihood ratio tests (SH-aLRT).
Fig. 3.
Fig. 3.
Phylogenetic network showing the population splits and mixtures within Paracoccidioides deduced by TreeMix analysis. The most likely migration scenario involves two events (m = 2) of gene exchange between P. brasiliensis and P. americana. The length of the black branches is proportional to the genetic drift (branch lengths) of each population and scale bars show ten units of standard error (s.e.). According to the direction of the colored hybridization edges P. venezuelensis, P. restrepiensis, and P. americana have emerged from P. brasiliensis (S1a-ARG, S1a-BR or S1B) populations. The migration edges’ weight is represented by colors and details the proportion of ancestry derived from a given migration edge.
Fig. 4.
Fig. 4.
Geographic distribution of Paracoccidioides species and populations in South America. The map shows the approximate location (green areas of the maps) and the number of clinical and/or environmental isolates sampled in the main endemic areas of the disease in Latin America. The pie chart size is proportional to the number of typed strains. The colors of each pie chart represent the proportion of a given Paracoccidioides genotype to its respective endemic area; color conventions are shown in the inset.

References

    1. Arantes TD, et al., 2016. Environmental Mapping of Paracoccidioides spp. in Brazil Reveals New Clues into Genetic Diversity, Biogeography and Wild Host Association. PLoS Negl. Trop. Dis 10, e0004606. - PMC - PubMed
    1. Araujo P, et al., 2016. Paracoccidioidomicosis detectados en el período 2004–2013 en el Laboratorio Central de Salud Pública de Asunción - Paraguay. Revista del Nacional 8, 62–71.
    1. Bicalho RN, et al., 2001. Oral paracoccidioidomycosis: a retrospective study of 62 Brazilian patients. Oral Dis. 7, 56–60. - PubMed
    1. Bolger AM, et al., 2014. Trimmomatic: a flexible trimmer for Illumina sequence data. Bioinformatics 30, 2114–2120. - PMC - PubMed
    1. Brasier C, 2000. The rise of the hybrid fungi. Nature 405, 134–135. - PubMed

Publication types

LinkOut - more resources