

Chest CT findings of COVID-19 pneumonia by duration of symptoms
- PMID: 32325282
- PMCID: PMC7165099
- DOI: 10.1016/j.ejrad.2020.109009
Chest CT findings of COVID-19 pneumonia by duration of symptoms
Abstract
Purpose: To evaluate lung abnormalities on thin-section computed tomographic (CT) scans in patients with COVID-19 and correlate findings to duration of symptoms.
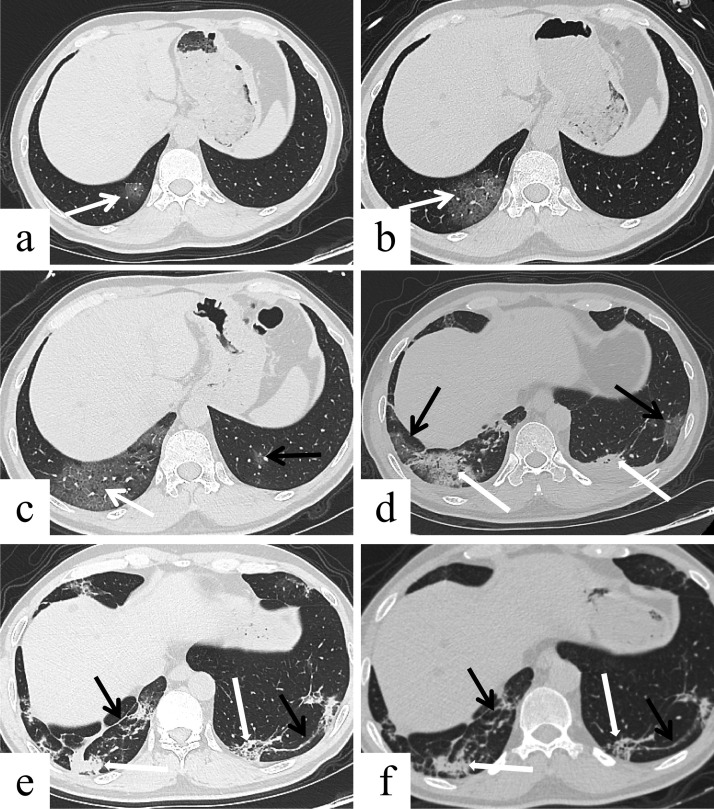
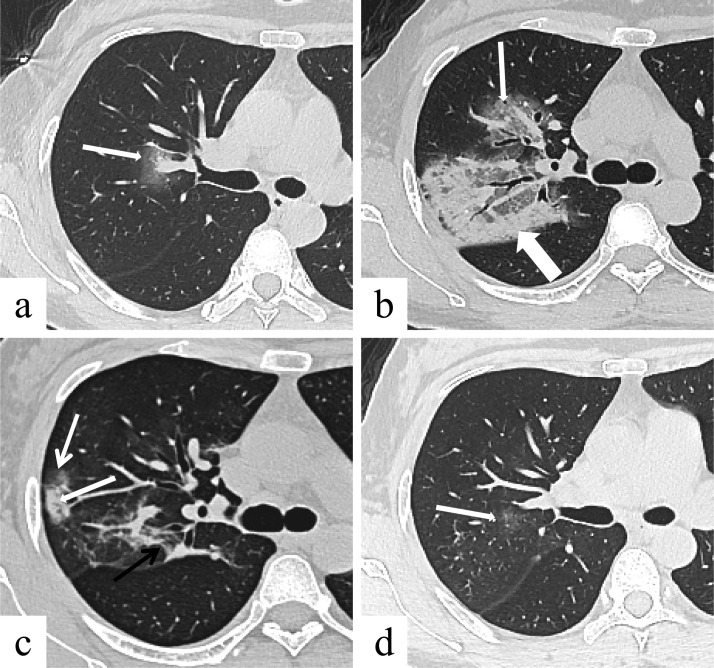
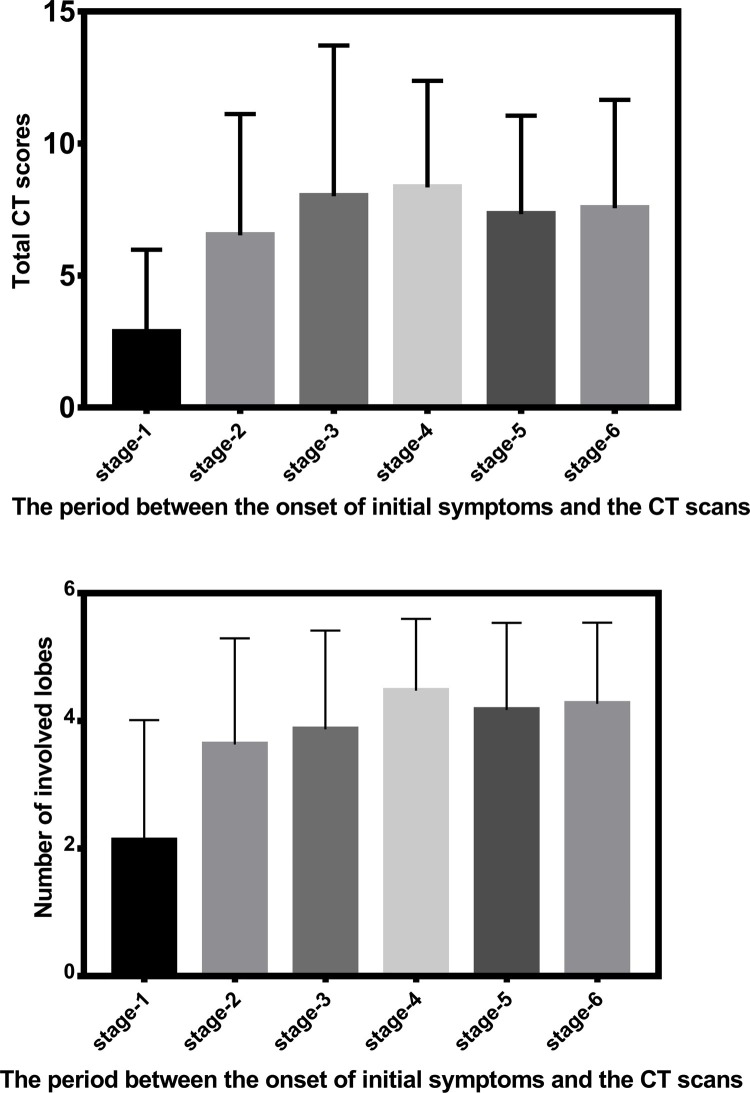
Methods: In total, 348 CT scans in 112 patients were classified according to the time after the onset of the initial symptoms, namely stage-1 (0-4 days); stage-2 (5-9 days); stage-3 (10-14 days); stage-4 (15-21 days); stage-5 (22-28 days); and stage-6 (>28 days). Each lung lobe was evaluated for extent affected by ground-glass opacities (GGO), crazy-paving pattern and consolidation, in five categories of percentual severity. Summation of scores from all five lung lobes provided the total CT score (maximal CT score, 25).
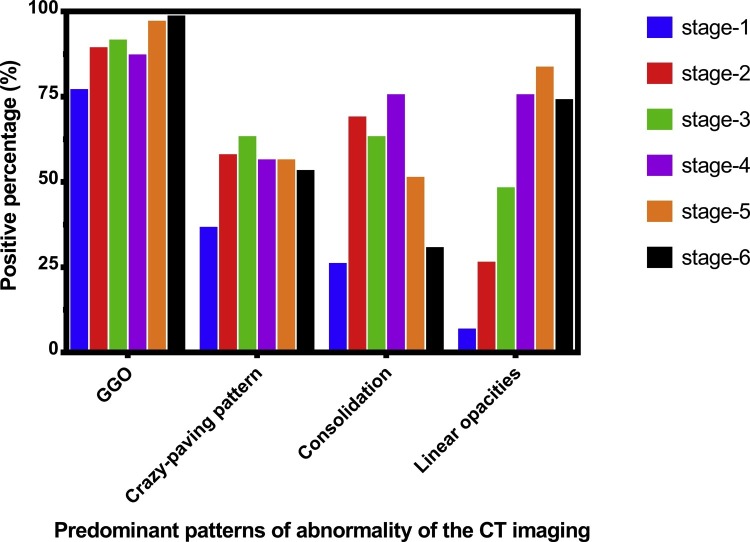
Results: The predominant patterns of lung abnormalities were GGOs, crazy-paving pattern, consolidation and linear opacities. The frequency of crazy-paving pattern, consolidation and linear opacities peaked at stage-3 (62.7 %), stage-4 (75.0 %) and stage-5 (83.1 %), respectively, and decreased thereafter. Total CT scores increased from stage-1 to stage-2 (2.8 ± 3.1, vs. 6.5 ± 4.6, respectively, P < 0.01), and thereafter remained high. The lower lobes were more inclined to be involved with higher CT scores except for stage-1. At stage-6 98.1 % of CT scans still showed abnormalities (CT score 7.5 ± 4.1).
Conclusion: Thin-section CT could provide semi-quantitative analysis of pulmonary damage severity. This disease changed rapidly at the early stage, then tended to be stable and lasted for a long time.
Keywords: COVID-19; Computed tomographic; Crazy-paving pattern; Ground-glass opacities.
Copyright © 2020 Elsevier B.V. All rights reserved.
Conflict of interest statement
Declaration of Competing Interest We declare that we have no financial and personal relationships with other people or organizations that can inappropriately influence our work, there is no professional or other personal interest of any nature or kind in any product, service and/or company that could be construed as influencing the position presented in, or the review of, the manuscript entitled “Chest CT findings of COVID-19 pneumonia by duration of symptoms”
Figures
References
-
- Huang C., Wang Y., Li X., Ren L., Zhao J., Hu Y., Zhang L., Fan G., Xu J., Gu X., Cheng Z., Yu T., Xia J., Wei Y., Wu W., Xie X., Yin W., Li H., Liu M., Xiao Y., Gao H., Guo L., Xie J., Wang G., Jiang R., Gao Z., Jin Q., Wang J., Cao B. Clinical features of patients infected with 2019 novel coronavirus in Wuhan, China. Lancet. 2020;395(10223):497–506. - PMC - PubMed
-
- Corman V.M., Landt O., Kaiser M., Molenkamp R., Meijer A., Chu D.K.W., Bleicker T., Brunink S., Schneider J., Schmidt M.L., Mulders D., Haagmans B.L., van der Veer B., van den Brink S., Wijsman L., Goderski G., Romette J.L., Ellis J., Zambon M., Peiris M., Goossens H., Reusken C., Koopmans M.P.G., Drosten C. Detection of 2019 novel coronavirus (2019-nCoV) by real-time RT-PCR. Euro Surveill. 2020;25(3) - PMC - PubMed
