. 2020 Apr 20;9(4):82.
doi: 10.3390/biology9040082.

Overexpression of T-bet, GATA-3 and TGF-ß Induces IFN-γ, IL-4/13A, and IL-17A Expression in Atlantic Salmon

Affiliations

Overexpression of T-bet, GATA-3 and TGF-ß Induces IFN-γ, IL-4/13A, and IL-17A Expression in Atlantic Salmon

Tiril H Slettjord et al. Biology (Basel). .

Abstract

The overexpression of GATA-3, T-bet and TGF-ß may theoretically induce IL-4/A, IFN-γ and IL-17A expression, respectively. Whether this also applies to fish is not yet known. The plasmid vectors encoding reporter gene (RFP)-tagged T-bet, GATA-3 and TGF-β were used as overexpression tools, transfected into cells or injected intramuscularly to monitor the expression of IFN-γ, IL-4/13A and IL-17A. In addition, the fish were either experimentally challenged with Vibrio anguillarum (VA group) or Piscirickettsia salmonis (PS group). The reporter gene (RFP) inserted upstream of the GATA-3, T-bet and TGF-ß genes, was observed in muscle cell nuclei and in inflammatory cells after intramuscular (i.m.) injection. PS group: following the injection of GATA-3 and T-bet-encoding plasmids, the expression of GATA-3 and T-bet was high at the injection site. The spleen expression of IFN-γ, following the injection of a T-bet-encoding plasmid, was significantly higher on day 2. VA group: The T-bet and GATA-3-overexpressing fish expressed high T-bet and GATA-3 mRNA levels in the muscles and on day 4 post-challenge. The expression of TGF-ß in the muscles of fish injected with TGF-ß-encoding plasmids was significantly higher on days 7 (8 days pre-challenge) and 19 (4 days after challenge). The protective effects of the overexpression of T-bet, GATA-3 and TGF-ß on both bacterial infections were negligible.

Keywords: Atlantic salmon; GATA-3; T-bet; TGF-ß; gene expression; overexpression.


Conflict of interest statement

The authors declare no competing financial interests.

Figures

Figure 1
Figure 1
Schematic representation of the experimental plan in this study.
Figure 2
Figure 2
Subcellular localization of recombinant salmon TGF-β, T-bet and GATA-3 in Chinook salmon embryonic (CHSE-214) cells. CHSE-214 cells were transfected with pTagRFP-TGF-β, pTagRFP-T-bet or pTagRFP-GATA-3. After 48 h the cells were fixed in 4% paraformaldehyde and nuclei were stained with DAPI (blue). Bar: 10 μm.
Figure 3
Figure 3
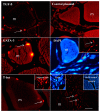
Histological detection of the reporter gene (RFP) from pTagRFP-TGF-ß, pTagRFP-GATA-3 and pTagRFP-T-bet-injected fish (muscle sections). Fish were injected with the RFP-encoding plasmids or control plasmid. On day 7, the muscle tissue was collected at the injection site and processed for fluorescence microscopy (400× magnification). Bright fluorescence due to the RFP was observed in the nuclei of muscle cells (m) in fish that were injected with pTagRFP-GATA-3 and pTagRFP-T-bet plasmids (continuous arrows), but not in muscle cells in fish that received pTagRFP-TGF-ß. Notably, fluorescence was also found in cells surrounding the muscle cells at the site of injections (dashed arrows). The DAPI-stained sections showed nuclear staining (light blue color); in some instances, there was co-localization of RFP (pTagRFP-GATA-3) and DAPI in the inflammatory cells (red double arrow). Three fish from each treatment group were analyzed. Bar: 50 µm.
Figure 4
Figure 4
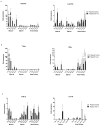
Tissue specific expression at different timepoints after intra-muscular injection and P. salmonis challenge. Treated and control fish were injected intraperitoneally (i.p.) with P. salmonis (100 µL/fish) on day 15. The bars represent the relative expression levels of (A) GATA-3 and IL-4/13A, (B) T-bet and IFN-γ, (C) TGF-ß and IL-17A normalized to elongation factor 1α (EF-1α). Each value represents the mean ± S.E.M. (N = 6). Statistical differences compared to their respective controls (p < 0.05, p < 0.01, and p < 0.001) between groups are denoted by asterisks (*, **, and ***, respectively) above the bars.
Figure 5
Figure 5
Tissue specific expression at different timepoints post-intra-muscular injection and V. anguillarun challenge. Treated and control fish were injected i.p. with V. anguillarum (i.p. 102 cfu/fish) on day 15. The bars represent the relative expression levels of (A) GATA-3 and IL-4/13A, (B) T-bet and IFN-γ, (C) TGF-ß and IL-17A normalized to EF-1α. Each value represents the mean ± S.E.M. (N = 6). Statistical differences compared to their respective controls (p < 0.05, p < 0.01, and p < 0.001) between groups are denoted by asterisks (*, **, and ***, respectively) above the bars.
Figure 6
Figure 6
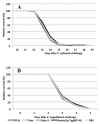
Relative percent cumulative survival (RPS) after experimental infection with (A) P. salmonis and (B) V. anguillarum. (N = 60).
Figure 7
Figure 7
(A) Expression of 16S rRNA P. salmonis (A) and V. anguillarum and (B) in the head kidney before and after bacterial infection (day 15) in different plasmid-injected groups. Bars represent the relative expression levels 16S rRNA normalized to EF-1α. Each value represents the mean ± S.D. (N = 6). Statistical differences, compared to their respective controls (p < 0.05 and p < 0.01), between groups are denoted by asterisks (* and **, respectively).

References

    1. Li L., Petrovsky N. Molecular Adjuvants for DNA Vaccines. Curr. Issues Mol. Biol. 2017;22:17–40. doi: 10.21775/cimb.022.017. - DOI - PubMed
    1. Holvold L.B., Myhr A.I., Dalmo R.A. Strategies and hurdles using DNA vaccines to fish. Vet. Res. 2014;45:21. doi: 10.1186/1297-9716-45-21. - DOI - PMC - PubMed
    1. Dalmo R.A. DNA vaccines for fish: Review and perspectives on correlates of protection. J. Fish Dis. 2017 doi: 10.1111/jfd.12727. - DOI - PubMed
    1. Naito T., Tanaka H., Naoe Y., Taniuchi I. Transcriptional control of T-cell development. Int. Immunol. 2011;23:661–668. doi: 10.1093/intimm/dxr078. - DOI - PubMed
    1. Agnello D., Lankford C.S., Bream J., Morinobu A., Gadina M., O’Shea J.J., Frucht D.M. Cytokines and transcription factors that regulate T helper cell differentiation: New players and new insights. J. Clin. Immunol. 2003;23:147–161. doi: 10.1023/A:1023381027062. - DOI - PubMed

LinkOut - more resources