. 2020 Apr 21;12(4):1019.
doi: 10.3390/cancers12041019.

Canonical BMP Signaling Executes Epithelial-Mesenchymal Transition Downstream of SNAIL1

Affiliations

Canonical BMP Signaling Executes Epithelial-Mesenchymal Transition Downstream of SNAIL1

Patrick Frey et al. Cancers (Basel). .

Abstract

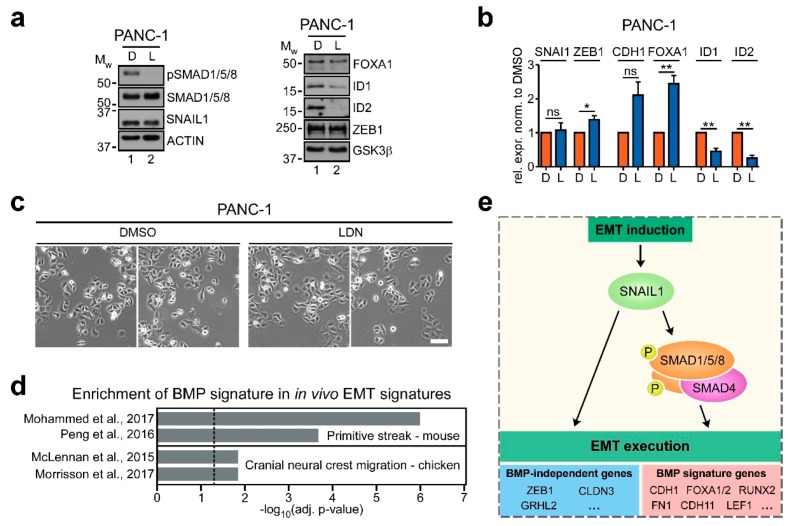
Epithelial-mesenchymal transition (EMT) is a pivotal process in development and disease. In carcinogenesis, various signaling pathways are known to trigger EMT by inducing the expression of EMT transcription factors (EMT-TFs) like SNAIL1, ultimately promoting invasion, metastasis and chemoresistance. However, how EMT is executed downstream of EMT-TFs is incompletely understood. Here, using human colorectal cancer (CRC) and mammary cell line models of EMT, we demonstrate that SNAIL1 critically relies on bone morphogenetic protein (BMP) signaling for EMT execution. This activity requires the transcription factor SMAD4 common to BMP/TGFβ pathways, but is TGFβ signaling-independent. Further, we define a signature of BMP-dependent genes in the EMT-transcriptome, which orchestrate EMT-induced invasiveness, and are found to be regulated in human CRC transcriptomes and in developmental EMT processes. Collectively, our findings substantially augment the knowledge of mechanistic routes whereby EMT can be effectuated, which is relevant for the conceptual understanding and therapeutic targeting of EMT processes.

Keywords: BMP signaling; Epithelial-mesenchymal transition (EMT); SMAD; SNAIL1; colorectal cancer; invasion; metastasis; pancreatic cancer.


Conflict of interest statement

The authors declare no conflict of interest.

Figures

Figure 1
Figure 1
SNAIL1 induces bone morphogenetic protein (BMP) target genes during epithelial-mesenchymal transition (EMT) in colorectal cancer cells. (a) Representative phase contrast images of LS174T-ctrl and LS174T-Snail1-HA cells. Cells were left uninduced or were treated with 0.1 µg·mL−1 Dox for 72 h. Scale bar: 100 µm. (b) qRT-PCR analyses of mRNA expression in LS174T-ctrl and LS174T-Snail1-HA cells. Where indicated, cells were treated with 0.1 µg·mL−1 Dox for 72 h. Shown is the mean + SEM; n = 3. Rel. expr.: relative expression normalized to that of GAPDH. ns: not significant. *: p < 0.05, ***: p < 0.001. (c) Western blot analyses of whole-cell lysates. Names of detected proteins are indicated on the right. Cells received 0.1 µg·mL-1 Dox or were left untreated. Positions of molecular weight (MW) standards in kDa are given on the left. Detection of ACTIN was used as control for equal loading. As not all proteins could be analyzed on the same membrane, only one representative loading control is shown for reasons of simplicity. All corresponding loading controls for the images depicted can be found in Figure S9. (d) Gene set enrichment analysis (GSEA) of the genes upregulated by Snail1-HA after 72 h of Dox administration. A selection of significantly enriched gene sets is shown. Plotted are the negatives of the log10 of the adjusted (adj.) p-values. Vertical dotted line indicates the applied cutoff of adj. p-value ≤ 0.05. A complete list of terms analyzed can be found in Table S1. (e) Top ten enriched transcription factor (TF)-signatures in the genes deregulated upon induction of Snail1-HA in LS174T after Dox treatment for different time spans. Hours of Dox administration are indicated on top. Enrichment scores are plotted as negatives of the log10 of the adjusted (adj.) p-values. A complete list of enriched TF-signatures is given in Table S1. (f) qRT-PCR analyses of mRNA expression in LS174T-ctrl and LS174T-Snail1-HA cells. Where indicated, cells were treated with 0.1 µg mL−1 Dox for 72 h. Shown is the mean + SEM; n = 3. Rel. expr.: relative expression normalized to that of GAPDH. ns: not significant. *: p < 0.05, **: p < 0.01.
Figure 2
Figure 2
Inhibition of the BMP pathway strongly impairs the SNAIL1-induced EMT in colorectal cancer cells. (a) Schematic depiction of the BMP signaling pathway. The two inhibitors Noggin and LDN193189 interfere with signal transduction by sequestering BMP ligands and inhibiting BMP type I receptor A (ALK3), respectively. (b) Western blot analyses of whole-cell lysates. Names of detected proteins are indicated on the right. Cells were left uninduced or were treated with 0.1 µg·mL−1 Dox and 50 nM LDN193189 (L), or DMSO (D) for 72 h. Positions of molecular weight (MW) standards in kDa are given on the left. Detection of ACTIN was used as control for equal loading. (c) Western Blot analyses of whole-cell lysates. Names of detected proteins are indicated on the right. Cells were left uninduced or were treated with 0.1 µg·mL−1 Dox and 100 ng·mL−1 Noggin for the indicated time spans. Positions of molecular weight (MW) standards in kDa are given on the left. Detection of ACTIN was used as control for equal loading. (d) qRT-PCR analyses of mRNA expression in LS174T-Snail1-HA cells. Where indicated, cells were treated with 0.1 µg·mL−1 Dox, 50 nM LDN193189 (L), DMSO (D), or 100 ng·mL−1 Noggin (N) for 72 h. Shown is the mean+SEM; n = 3. Rel. expr.: relative expression normalized to that of GAPDH. ns: not significant. *: p < 0.05, **: p < 0.01. (e) Representative phase contrast images of LS174T-Snail1-HA cells treated with 0.1 µg·mL−1 Dox and DMSO, 50 nM LDN193189 (LDN), or 100 ng·mL−1 Noggin (NOG) for 72 h as indicated. Scale bar: 100 µm. (f) Spheroid invasion assay of LS174T-Snail1-HA cells treated with 0.1 µg·mL−1 Dox and DMSO, 50 nM LDN193189 (LDN), or 100 ng·mL−1 Noggin (NOG) for 96 h as indicated. Two representative spheroids are shown for each condition. Scale bar: 200 µm.
Figure 3
Figure 3
Defining a high-confidence BMP-dependent gene expression signature in the Snail1-induced EMT transcriptome. (a) Euler diagrams displaying the numbers of Snail1-regulated genes whose regulation is impaired by BMP inhibitor treatment at 24 and 72 h of Snail1-induction. When comparing the fold changes of gene regulation in the scenario of BMP inhibitor treatment to DMSO treatment, an adjusted p-value < 0.05 was used as a cutoff to determine BMP-dependent genes. Grey overlaps represent the BMP signature genes. Time points indicate duration of induction with 0.1 µg·mL−1 Dox. (b) Gene set enrichment analysis (GSEA) showing significantly enriched gene sets in the BMP signature genes. Shown are the top ten significantly enriched gene sets, as well as, separated by the horizontal dotted line, additional selected significant terms. Plotted is the negative log10 of the adjusted p-value. Vertical dotted line indicates the cutoff of adj. p-value ≤ 0.05. A complete list of terms analyzed can be found in Table S3. (c) GSEA results of EMT-related gene sets significantly enriched in the BMP signature genes. Vertical dotted line indicates the applied cutoff of adjusted (adj.) p-value ≤ 0.05. A complete list of terms analyzed can be found in Table S3. (d) Heatmap showing the impact of BMP inhibitor treatment on the regulation of genes of interest in LS174T-Snail1-HA at different time points of induction with 0.1 µg·mL−1 Dox. Plotted is the log2 of the relative fold change of gene expression under BMP inhibitor treatment. Relative fold change was calculated by dividing gene expression differences induced by Snail1-HA in the scenario of BMP inhibition by the differences evoked by Snail1-HA under control conditions. Inhibitors used and durations of administration are indicated on the x-axis. As their expression was not properly detected in the microarray experiment, FN1 and ZEB1 are not shown. (e) Western blot analyses of proteins indicated on the right. Cells were left uninduced or were treated with 0.1 µg·mL−1 Dox and DMSO (D), 50 nM LDN193189 (L), or 100 ng mL-1 Noggin (N) for 72 h as indicated. Positions of molecular weight (MW) standards in kDa are given on the left. Detection of ACTIN and GSK3β was used as control for equal loading. Proteins were detected using whole-cell lysates, except for FOXA1, FOXA2, ZEB1 and GSK3β for which nuclear extracts were used. As not all proteins could be analyzed on the same membrane, only one representative loading control is shown for the different extraction methods for reasons of simplicity. All corresponding loading controls for the images depicted can be found in Figure S9.
Figure 4
Figure 4
SMAD4 is required for SNAIL1-induced EMT in colorectal cancer cells. (a) Western blot analyses of whole-cell lysates. Names of detected proteins are indicated on the right. Positions of molecular weight (MW) standards in kDa are given on the left. Detection of ACTIN was used as control for equal loading. par: parental, c: control, S: Snail1-HA. (b) qRT-PCR analyses of mRNA expression in LS174T parental (par) cells and single cell clones reconstituted with inducible control (c) or Snail1-HA (S) expression vectors. Statistical significance was analyzed by first testing for differences among the three wt (par, #11, #30) and the three SMAD4 ko (#58, #63, #65) clones by one-way ANOVA. As there were no significant intra-group differences for both genes, values for each clone were averaged and inter-group differences between wt and SMAD4 ko were determined using unpaired two-tailed student’s t-test. Shown is the mean + SEM; n = 3. Rel. expr.: relative expression normalized to that of GAPDH. ***: p < 0.001. (c) Morphology of LS174T parental (par) cells and single cell clones reconstituted with inducible Snail1-HA expression vector. Cells were left uninduced or received 0.1 µg·mL−1 Dox for 72 h. Scale bar: 100 µm. (d) Spheroid invasion assay of LS174T parental (par) cells and single cell clones reconstituted with an inducible expression vector for Snail1-HA. Cells were left untreated or received 0.1 µg·mL−1 Dox for 72 h. One representative spheroid is shown per condition. Scale bar: 200 µm. (e) Western blot analyses of proteins indicated on the right. Cells were left untreated or received 0.1 µg·mL−1 Dox for 72 h. Positions of molecular weight (MW) standards in kDa are given on the left. Detection of ACTIN and GSK3β was used as control for equal loading. Proteins were detected using whole-cell lysates, except for FOXA1, FOXA2, ZEB1 and GSK3β for which nuclear extracts were used. As not all proteins could be analyzed on the same membrane, only one representative loading control is shown for the different extraction methods for reasons of simplicity. All corresponding loading controls for the images depicted can be found in Figure S9.
Figure 5
Figure 5
BMP signature gene expression is recapitulated in human colorectal cancer tumors and can be predictive for patient survival after tumor stratification. (a), (b) Correlation maps showing the mutual correlation of expression levels of all 282 BMP signature genes in transcriptomes of colorectal cancer (CRC) samples. Genes were clustered by unsupervised hierarchical clustering based on the Euclidean distance. In (a), all CRC samples available from TCGA were used. For (b), only the subset of tumors that classified as consensus molecular subtype (CMS) 4 and without mutations in SMAD4 (SMAD4wt) was considered. The color bar on the bottom of each plot indicates whether a gene is up- or downregulated by Snail1-HA in LS174T cells. (ce) Kaplan–Meier curves indicating survival probability of colorectal cancer patients. Patients were separated into two groups based on the expression of BMP signature genes in the tumors. In (c), all tumor samples and all BMP signature genes were used for the analysis. In (d), only the CMS3, SMAD4wt tumors and, in (e), only 18 of the BMP signature genes conserved in significantly enriched EMT-related gene sets (see Figure 3c and Table S3) were considered. The corresponding clustering heatmaps are shown in Figure S7b–d. Log-rank test was applied to determine the significance of differences in survival probability; p-values are indicated.
Figure 6
Figure 6
BMP signature genes are also deregulated BMP-dependently in mammary epithelial cells. (a) Representative phase contrast images of MCF10A-ctrl or MCF10A-SNAIL1-ER cells treated with ethanol (−) or 100 nM 4-hydroxytamoxifen (4OH-T) and DMSO, or 50 nM LDN193189 (LDN) for 10 days as indicated. Scale bar: 200 µm. (b) Western blot analyses of proteins indicated on the right. Cells were treated with ethanol (−) or 100 nM 4-hydroxytamoxifen (4OH-T) and DMSO (D), or 50 nM LDN193189 (L) for 10 days as indicated. Positions of molecular weight (MW) standards in kDa are given on the left. Detection of ACTIN and GSK3β was used as control for equal loading. Proteins were detected using whole-cell lysates, except for FOXA1, ID2, ZEB1 and GSK3β for which nuclear extracts were used. As not all proteins could be analyzed on the same membrane, only one representative loading control is shown for the different extraction methods for reasons of simplicity. All corresponding loading controls for the images depicted can be found in Figure S9. (c) Quantification of spheroid invasion assays with MCF10A-ctrl and MCF10A-SNAIL1-ER cells. Cells were treated with ethanol (−) or 100 nM 4-hydroxytamoxifen (4OH-T) and DMSO (D), or 50 nM LDN193189 (L) for 14 days as indicated. After that, cells were imaged and invaded single cells were counted in ≥15 fields of view per condition, which were obtained from three biological replicates. Representative fields of view with examples of single cell quantification are shown in Figure S8b. Shown is the mean ± SEM as well as all individual data points obtained. Data were tested for normality using Shapiro–Wilk tests (p = 0.018 for sample 8, indicating non-normal distribution). Significance was therefore determined using two-tailed Mann–Whitney U tests. **: p < 0.01. (d) Venn diagram showing the overlap of BMP signature genes with all genes that are regulated by TGFβ1 in NMuMG cells in a SMAD1/5-dependent manner [39]. Shared genes and details of the analysis are listed in Table S4. The significance of enrichment was determined by hypergeometric test; the p-value is indicated.
Figure 7
Figure 7
BMP pathway activity partially sustains a mesenchymal state of pancreatic cancer cells and BMP signature gene expression occurs in developmental instances of EMT. (a) Western blot analyses of proteins indicated on the right. PANC-1 cells were treated with DMSO or 50 nM LDN193189 (LDN) for 72 h as indicated. Positions of molecular weight (MW) standards in kDa are given on the left. E-CADHERIN could not be detected. Detection of ACTIN and GSK3β was used as control for equal loading. Proteins were detected using whole-cell lysates, except for FOXA1, ID1, ID2, ZEB1 and GSK3β for which nuclear extracts were used. (b) qRT-PCR analyses of mRNA expression in PANC-1 cells treated with DMSO or 50 nM LDN193189 (LDN) for 72 h as indicated. Significance was determined using two-tailed one sample t-test. Shown is the mean+SEM; n = 4. Rel. expr.: relative expression normalized to that of GAPDH. ns: not significant. *: p < 0.05, **: p < 0.01. (c) Phase contrast images of PANC-1 cells treated with DMSO or 50 nM LDN193189 (LDN) for 72 h as indicated. Two representative fields of view are shown for each condition. Scale bar: 100 µm. (d) Gene set enrichment analysis (GSEA) of BMP signature genes in publicly available sets of genes regulated in EMT-associated processes in different organisms in vivo. Only genes upregulated by Snail1-HA in LS174T cells were considered. Source publications of the analyzed gene sets are given on the left. Plotted is the negative log10 of the adjusted (adj.) p-value. Vertical dotted line indicates the significance threshold of adjusted (adj.) p-value ≤ 0.05. A detailed list of GSEA results is given in Table S4. (e) Model depicting the proposed role of BMP signaling in EMT execution downstream of SNAIL1. Upon induction of EMT and upregulation of SNAIL1, BMP pathway-associated SMAD transcription factor complexes are activated and control a subset of critically EMT-relevant genes. Examples for such BMP signature genes are shown. Note that SNAIL1 regulates additional epithelial and mesenchymal marker genes independently of BMP pathway activity.

References

    1. Nieto M.A., Huang R.Y.-J., Jackson R.A., Thiery J.P. EMT: 2016. Cell. 2016;166:21–45. doi: 10.1016/j.cell.2016.06.028. - DOI - PubMed
    1. Zheng X., Carstens J.L., Kim J., Scheible M., Kaye J., Sugimoto H., Wu C.-C., LeBleu V.S., Kalluri R. Epithelial-to-mesenchymal transition is dispensable for metastasis but induces chemoresistance in pancreatic cancer. Nature. 2015;527:525–530. doi: 10.1038/nature16064. - DOI - PMC - PubMed
    1. Fischer K.R., Durrans A., Lee S., Sheng J., Li F., Wong S.T.C., Choi H., El Rayes T., Ryu S., Troeger J., et al. Epithelial-to-mesenchymal transition is not required for lung metastasis but contributes to chemoresistance. Nature. 2015;527:472–476. doi: 10.1038/nature15748. - DOI - PMC - PubMed
    1. Brabletz T., Kalluri R., Nieto M.A., Weinberg R.A. EMT in cancer. Nat. Rev. Cancer. 2018;18:128–134. doi: 10.1038/nrc.2017.118. - DOI - PubMed
    1. Gonzalez D.M., Medici D. Signaling mechanisms of the epithelial-mesenchymal transition. Sci. Signal. 2014;7:re8. doi: 10.1126/scisignal.2005189. - DOI - PMC - PubMed