Review
. 2020 Apr 15;10(4):236.
doi: 10.3390/brainsci10040236.

Imaging Transcranial Direct Current Stimulation (tDCS) with Positron Emission Tomography (PET)

Affiliations
Review

Imaging Transcranial Direct Current Stimulation (tDCS) with Positron Emission Tomography (PET)

Thorsten Rudroff et al. Brain Sci. .

Abstract

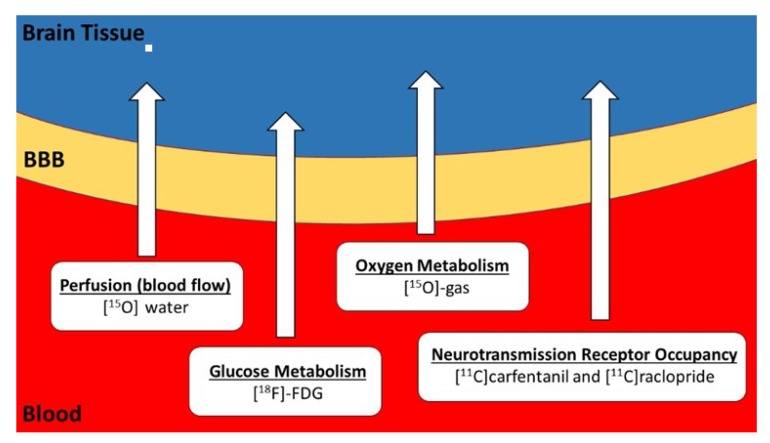
Transcranial direct current stimulation (tDCS) is a form of non-invasive neuromodulation that is increasingly being utilized to examine and modify several cognitive and motor functions. Although tDCS holds great potential, it is difficult to determine optimal treatment procedures to accommodate configurations, the complex shapes, and dramatic conductivity differences among various tissues. Furthermore, recent demonstrations showed that up to 75% of the tDCS current applied to rodents and human cadavers was shunted by the scalp, subcutaneous tissue, and muscle, bringing the effects of tDCS on the cortex into question. Consequently, it is essential to combine tDCS with human neuroimaging to complement animal and cadaver studies and clarify if and how tDCS can affect neural function. One viable approach is positron emission tomography (PET) imaging. PET has unique potential for examining the effects of tDCS within the central nervous system in vivo, including cerebral metabolism, neuroreceptor occupancy, and neurotransmitter activity/binding. The focus of this review is the emerging role of PET and potential PET radiotracers for studying tDCS-induced functional changes in the human brain.

Keywords: cortical excitability; positron emission tomography; radiotracers; tDCS.


Conflict of interest statement

The authors declare no conflict of interest.

Figures

Figure 1
Figure 1
Potential PET tracers available for combination with tDCS. Glucose is the most important energy resource of the human brain and its metabolism can be measured and quantified using positron emission tomography (PET) with [18F]-fluorodeoxyglucose (FDG). Oxygen is necessary for the operation of the tricarboxylic acid cycle to synthesize ATP molecules from glucose, and oxygen metabolism can be measured using PET with [15O]-oxygen gas during inhalation. Glucose and oxygen molecules are supplied by blood flow. Brain regions with increased activity are accompanied by regional capillary dilation and increased regional cerebral blood flow (rCBF), which can be measured with [15O]water PET. The interaction of neurotransmitters and receptors can also be measured using PET with various [11C]-labeled ligands, such as [11C]carfentanil and [11C]raclopride. BBB = blood brain barrier.
Figure 2
Figure 2
An example of FDG-PET image, taken from Rudroff et al. 2019 [25]. FDG-PET transaxial image acquired pre- and post-tDCS therapy. Images are scaled in standardized uptake values normalized to the global mean value (Max = 1.88 for pre-and post-therapy and 0.5 for post-pre therapy). The white arrow indicates the right thalamus, the area with the greatest difference between the images. The color bar describes increasing FDG uptake with increasing signal intensity (from black, indicating no glucose uptake, to red, indicating the greatest glucose uptake).
Figure 3
Figure 3
An example of [15O]Water Positron Emission Tomography (PET). The image is scaled in activity units (kBq/cc). The image was created by summing the first 40 seconds immediately post-bolus transit from a dynamic imaging sequence initiated at the time of [15O]water injection. The image is a semi-quantitative representation of the cerebral blood flow (CBF) at the time of bolus arrival in the brain. The color bar describes increasing blood flow with increasing signal intensity (from black to red).
Figure 4
Figure 4
An example of [11C]carfentanil-PET image, taken from Dos Santos et al. 2012 [53]. Decrease in µ-opioid receptor (µ OR) binding associated with transcranial direct current stimulation. Upper panel: µ OR BPND during the baseline PET. Lower panel: µ OR BPND during active tDCS. ACC = anterior cingulate cortex; NAc = nucleus accumbens; Ins = insula; BPND = non-displaceable binding potential. The color bar describes increasing (µ OR) binding increasing signal intensity (from black to red).

References

    1. Sanchez-Kuhn A., Perez-Fernandez C., Canovas R., Flores P., Sanchez-Santed F. Transcranial direct current stimulation as a motor neurorehabilitation tool: An empirical review. Biomed. Eng. Online. 2017;16:76. doi: 10.1186/s12938-017-0361-8. - DOI - PMC - PubMed
    1. Stagg C.J., Antal A., Nitsche M.A. Physiology of transcranial direct current stimulation. J. ECT. 2018;34:144–152. doi: 10.1097/YCT.0000000000000510. - DOI - PubMed
    1. Buch E.R., Santamecchi E., Antal A., Born J., Celnik P.A., Classen J., Gerloffi C., Hallett M., Hummeli F.C., Nitschek M.A., et al. Effects of tDCS on motor learning and memory formation: A consensus and critical position paper. Clin. Neurophysiol. 2017;128:589–603. doi: 10.1016/j.clinph.2017.01.004. - DOI - PubMed
    1. Shin Y.I., Foerster M.A., Nitsche M.A. Transcranial direct current stimulation—Application in neuropsychology. Neuropsychologia. 2015;69:154–175. doi: 10.1016/j.neuropsychologia.2015.02.002. - DOI - PubMed
    1. Nitsche M.A., Paulus W. Excitability changes induced in the human motor cortex by weak transcranial direct current stimulation. J. Physiol. 2000;527:633–639. doi: 10.1111/j.1469-7793.2000.t01-1-00633.x. - DOI - PMC - PubMed

LinkOut - more resources