. 2020 Apr 15;21(8):2741.
doi: 10.3390/ijms21082741.

HIV-1 and Amyloid Beta Remodel Proteome of Brain Endothelial Extracellular Vesicles

Affiliations

HIV-1 and Amyloid Beta Remodel Proteome of Brain Endothelial Extracellular Vesicles

Ibolya E András et al. Int J Mol Sci. .

Abstract

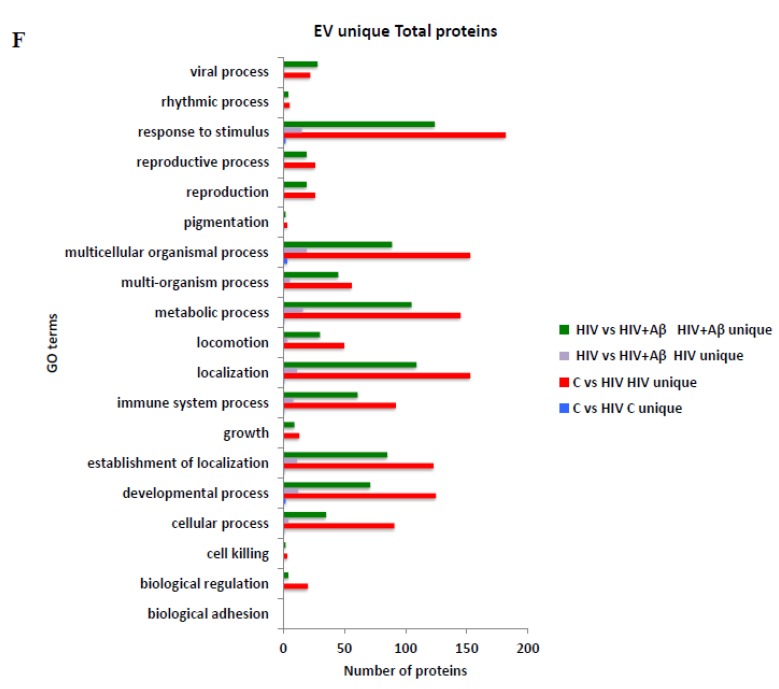
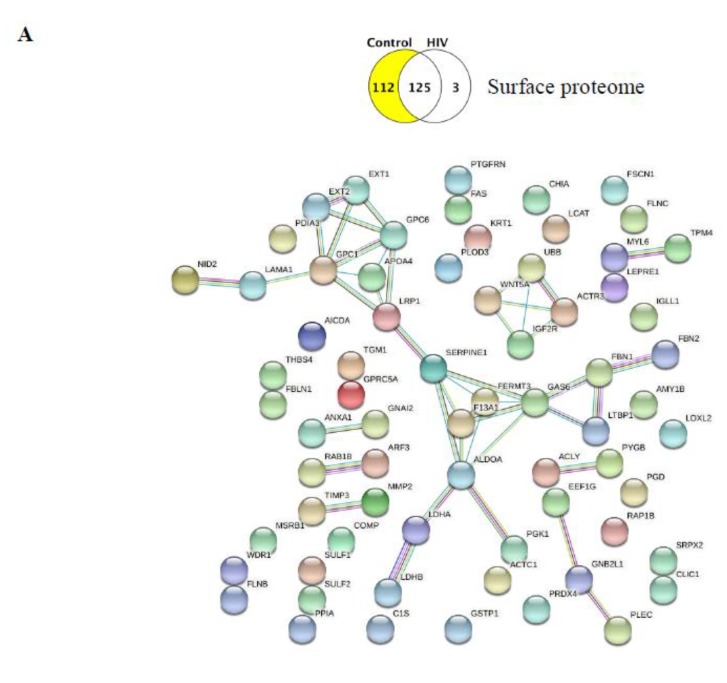
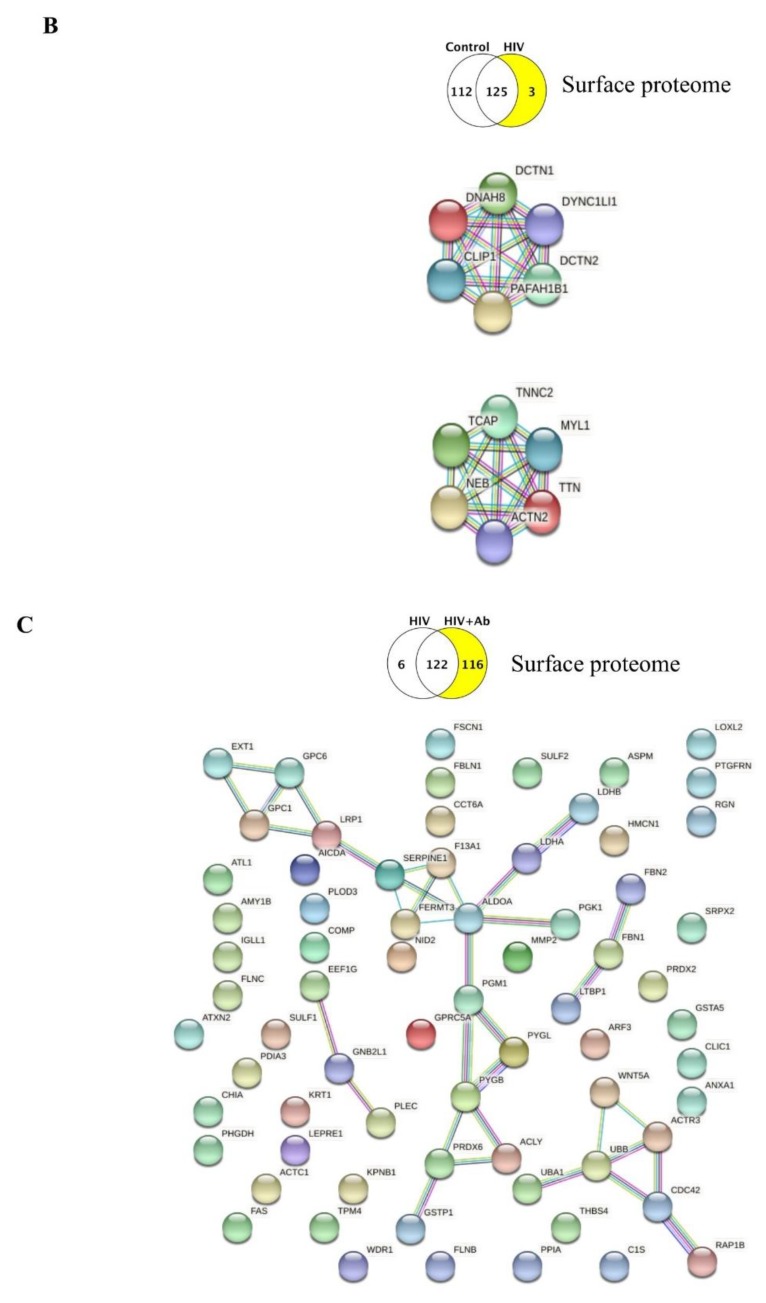
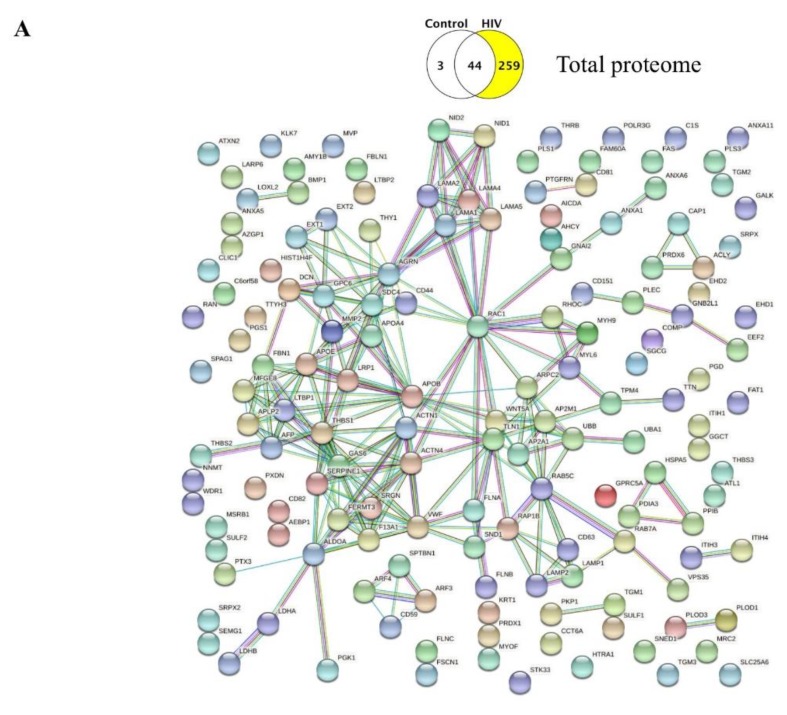
Amyloid beta (Aβ) depositions are more abundant in HIV-infected brains. The blood-brain barrier, with its backbone created by endothelial cells, is assumed to be a core player in Aβ homeostasis and may contribute to Aβ accumulation in the brain. Exposure to HIV increases shedding of extracellular vesicles (EVs) from human brain endothelial cells and alters EV-Aβ levels. EVs carrying various cargo molecules, including a complex set of proteins, can profoundly affect the biology of surrounding neurovascular unit cells. In the current study, we sought to examine how exposure to HIV, alone or together with Aβ, affects the surface and total proteomic landscape of brain endothelial EVs. By using this unbiased approach, we gained an unprecedented, high-resolution insight into these changes. Our data suggest that HIV and Aβ profoundly remodel the proteome of brain endothelial EVs, altering the pathway networks and functional interactions among proteins. These events may contribute to the EV-mediated amyloid pathology in the HIV-infected brain and may be relevant to HIV-1-associated neurocognitive disorders.

Keywords: HIV-1; amyloid beta; blood–brain barrier; extracellular vesicles.


Conflict of interest statement

The authors declare no conflicts of interest.

Figures

Figure 1
Figure 1
Extracellular vesicle (EV)-specific markers in the surface and total proteomes of human brain microvascular endothelial cells (HBMEC)-derived EVs. Venn diagram showing the overlap between the HBMEC-EV surface proteome (283 proteins) (A) or the HBMEC-EV total proteome (501 proteins) (B) and the top 100 EV marker proteins from ExoCarta. Cellular component enrichment of the identified surface (C) and total (D) EV proteomes. The identified EV proteins were enriched for cellular component using the Scaffold software.
Figure 1
Figure 1
Extracellular vesicle (EV)-specific markers in the surface and total proteomes of human brain microvascular endothelial cells (HBMEC)-derived EVs. Venn diagram showing the overlap between the HBMEC-EV surface proteome (283 proteins) (A) or the HBMEC-EV total proteome (501 proteins) (B) and the top 100 EV marker proteins from ExoCarta. Cellular component enrichment of the identified surface (C) and total (D) EV proteomes. The identified EV proteins were enriched for cellular component using the Scaffold software.
Figure 2
Figure 2
Enrichment for biological processes of the identified unique EV proteins. Scaffold software was used to enrich for the main biological processes for the identified unique EV proteins. The upper Venn diagrams show the compared groups with the number of their unique and shared proteins. The lower pie charts depict the enriched biological processes corresponding to the unique lists highlighted in yellow. The number of proteins in a particular biological process category is also provided. (A) Surface proteome, control vs. HIV. (B) Total proteome, control vs. HIV. (C) Surface proteome, HIV vs. HIV+ amyloid beta (Aβ). (D) Total proteome, HIV vs. HIV+Aβ. Combined graph for the biological processes in the EV unique surface (E) and total (F) proteomes. The number of unique proteins corresponding to the main biological processes in the different comparisons is illustrated on the graph.
Figure 2
Figure 2
Enrichment for biological processes of the identified unique EV proteins. Scaffold software was used to enrich for the main biological processes for the identified unique EV proteins. The upper Venn diagrams show the compared groups with the number of their unique and shared proteins. The lower pie charts depict the enriched biological processes corresponding to the unique lists highlighted in yellow. The number of proteins in a particular biological process category is also provided. (A) Surface proteome, control vs. HIV. (B) Total proteome, control vs. HIV. (C) Surface proteome, HIV vs. HIV+ amyloid beta (Aβ). (D) Total proteome, HIV vs. HIV+Aβ. Combined graph for the biological processes in the EV unique surface (E) and total (F) proteomes. The number of unique proteins corresponding to the main biological processes in the different comparisons is illustrated on the graph.
Figure 3
Figure 3
Protein–protein interactions between the identified unique proteins of the EV surface proteome. Venn diagrams illustrating the type of comparison and the number of identified unique proteins (highlighted). (A) Protein–protein interactions (PPI) (STRING) among the unique surface proteins in the control group. Only interactions with the highest confidence are shown with a minimum required interaction score of 0.900 (PPI enrichment p-value: 6.59 × 10⁻⁷; the network has significantly more interactions than expected). Known interactions: From curated databases (turquoise), experimentally determined (pink); predicted interactions: Gene neighborhood (green), gene fusions (red), gene co-occurrence (blue); other interactions: Textmining (light green), co-expression (black), protein homology (purple). (B) No interactions with highest confidence were identified in STRING among the three unique proteins identified in the HIV group. Predicted functional partners of dynein heavy chain 8, axonemal (DNAH8) (upper map) and titin (TTN) (lower map). Only the first shell of five interactions with the highest confidence is shown. Color code of the interaction lines as described in (A). (C) Protein–protein interactions among the unique proteins in the HIV+Aβ group. Only interactions with the highest confidence are shown (PPI enrichment p-value: 0.00158; the network has significantly more interactions than expected). Color code of the interaction lines as described in (A).
Figure 3
Figure 3
Protein–protein interactions between the identified unique proteins of the EV surface proteome. Venn diagrams illustrating the type of comparison and the number of identified unique proteins (highlighted). (A) Protein–protein interactions (PPI) (STRING) among the unique surface proteins in the control group. Only interactions with the highest confidence are shown with a minimum required interaction score of 0.900 (PPI enrichment p-value: 6.59 × 10⁻⁷; the network has significantly more interactions than expected). Known interactions: From curated databases (turquoise), experimentally determined (pink); predicted interactions: Gene neighborhood (green), gene fusions (red), gene co-occurrence (blue); other interactions: Textmining (light green), co-expression (black), protein homology (purple). (B) No interactions with highest confidence were identified in STRING among the three unique proteins identified in the HIV group. Predicted functional partners of dynein heavy chain 8, axonemal (DNAH8) (upper map) and titin (TTN) (lower map). Only the first shell of five interactions with the highest confidence is shown. Color code of the interaction lines as described in (A). (C) Protein–protein interactions among the unique proteins in the HIV+Aβ group. Only interactions with the highest confidence are shown (PPI enrichment p-value: 0.00158; the network has significantly more interactions than expected). Color code of the interaction lines as described in (A).
Figure 4
Figure 4
Protein–protein interactions in the identified unique proteins of the EV total proteome. Venn diagrams illustrating the type of comparison and the number of identified unique proteins (highlighted). (A) Protein–protein interactions among the unique proteins in the HIV group. Only interactions with the highest confidence are shown (PPI enrichment p-value: 1.0 × 10⁻¹⁶; the network has significantly more interactions than expected). (B) Protein–protein interactions among the unique proteins in the HIV+Aβ group. Only interactions with the highest confidence are shown (PPI enrichment p-value: 1.45 × 10⁻⁷; the network has significantly more interactions than expected). Color code of the interaction lines as described in Figure 3A.
Figure 4
Figure 4
Protein–protein interactions in the identified unique proteins of the EV total proteome. Venn diagrams illustrating the type of comparison and the number of identified unique proteins (highlighted). (A) Protein–protein interactions among the unique proteins in the HIV group. Only interactions with the highest confidence are shown (PPI enrichment p-value: 1.0 × 10⁻¹⁶; the network has significantly more interactions than expected). (B) Protein–protein interactions among the unique proteins in the HIV+Aβ group. Only interactions with the highest confidence are shown (PPI enrichment p-value: 1.45 × 10⁻⁷; the network has significantly more interactions than expected). Color code of the interaction lines as described in Figure 3A.

References

    1. Esiri M.M., Biddolph S.C., Morris C.S. Prevalence of Alzheimer plaques in AIDS. J. Neurol. Neurosurg. Psychiatry. 1998;65:29–33. doi: 10.1136/jnnp.65.1.29. - DOI - PMC - PubMed
    1. Rempel H.C., Pulliam L. HIV-1 Tat inhibits neprilysin and elevates amyloid beta. Aids. 2005;19:127–135. doi: 10.1097/00002030-200501280-00004. - DOI - PubMed
    1. Xu J., Ikezu T. The comorbidity of HIV-associated neurocognitive disorders and Alzheimer’s disease: A foreseeable medical challenge in post-HAART era. J. Neuroimmune Pharmacol. Off. J. Soc. NeuroImmune Pharmacol. 2009;4:200–212. doi: 10.1007/s11481-008-9136-0. - DOI - PMC - PubMed
    1. Brew B.J., Crowe S.M., Landay A., Cysique L.A., Guillemin G. Neurodegeneration and ageing in the HAART era. J. Neuroimmune Pharmacol. Off. J. Soc. NeuroImmune Pharmacol. 2009;4:163–174. doi: 10.1007/s11481-008-9143-1. - DOI - PubMed
    1. Achim C.L., Adame A., Dumaop W., Everall I.P., Masliah E., Neurobehavioral Research C. Increased accumulation of intraneuronal amyloid beta in HIV-infected patients. J. Neuroimmune Pharmacol. Off. J. Soc. NeuroImmune Pharmacol. 2009;4:190–199. doi: 10.1007/s11481-009-9152-8. - DOI - PMC - PubMed

MeSH terms