. 2020 Apr 24;368(6489):eaaz2449.
doi: 10.1126/science.aaz2449.

Structural basis of ER-associated protein degradation mediated by the Hrd1 ubiquitin ligase complex

Affiliations

Structural basis of ER-associated protein degradation mediated by the Hrd1 ubiquitin ligase complex

Xudong Wu et al. Science. .

Abstract

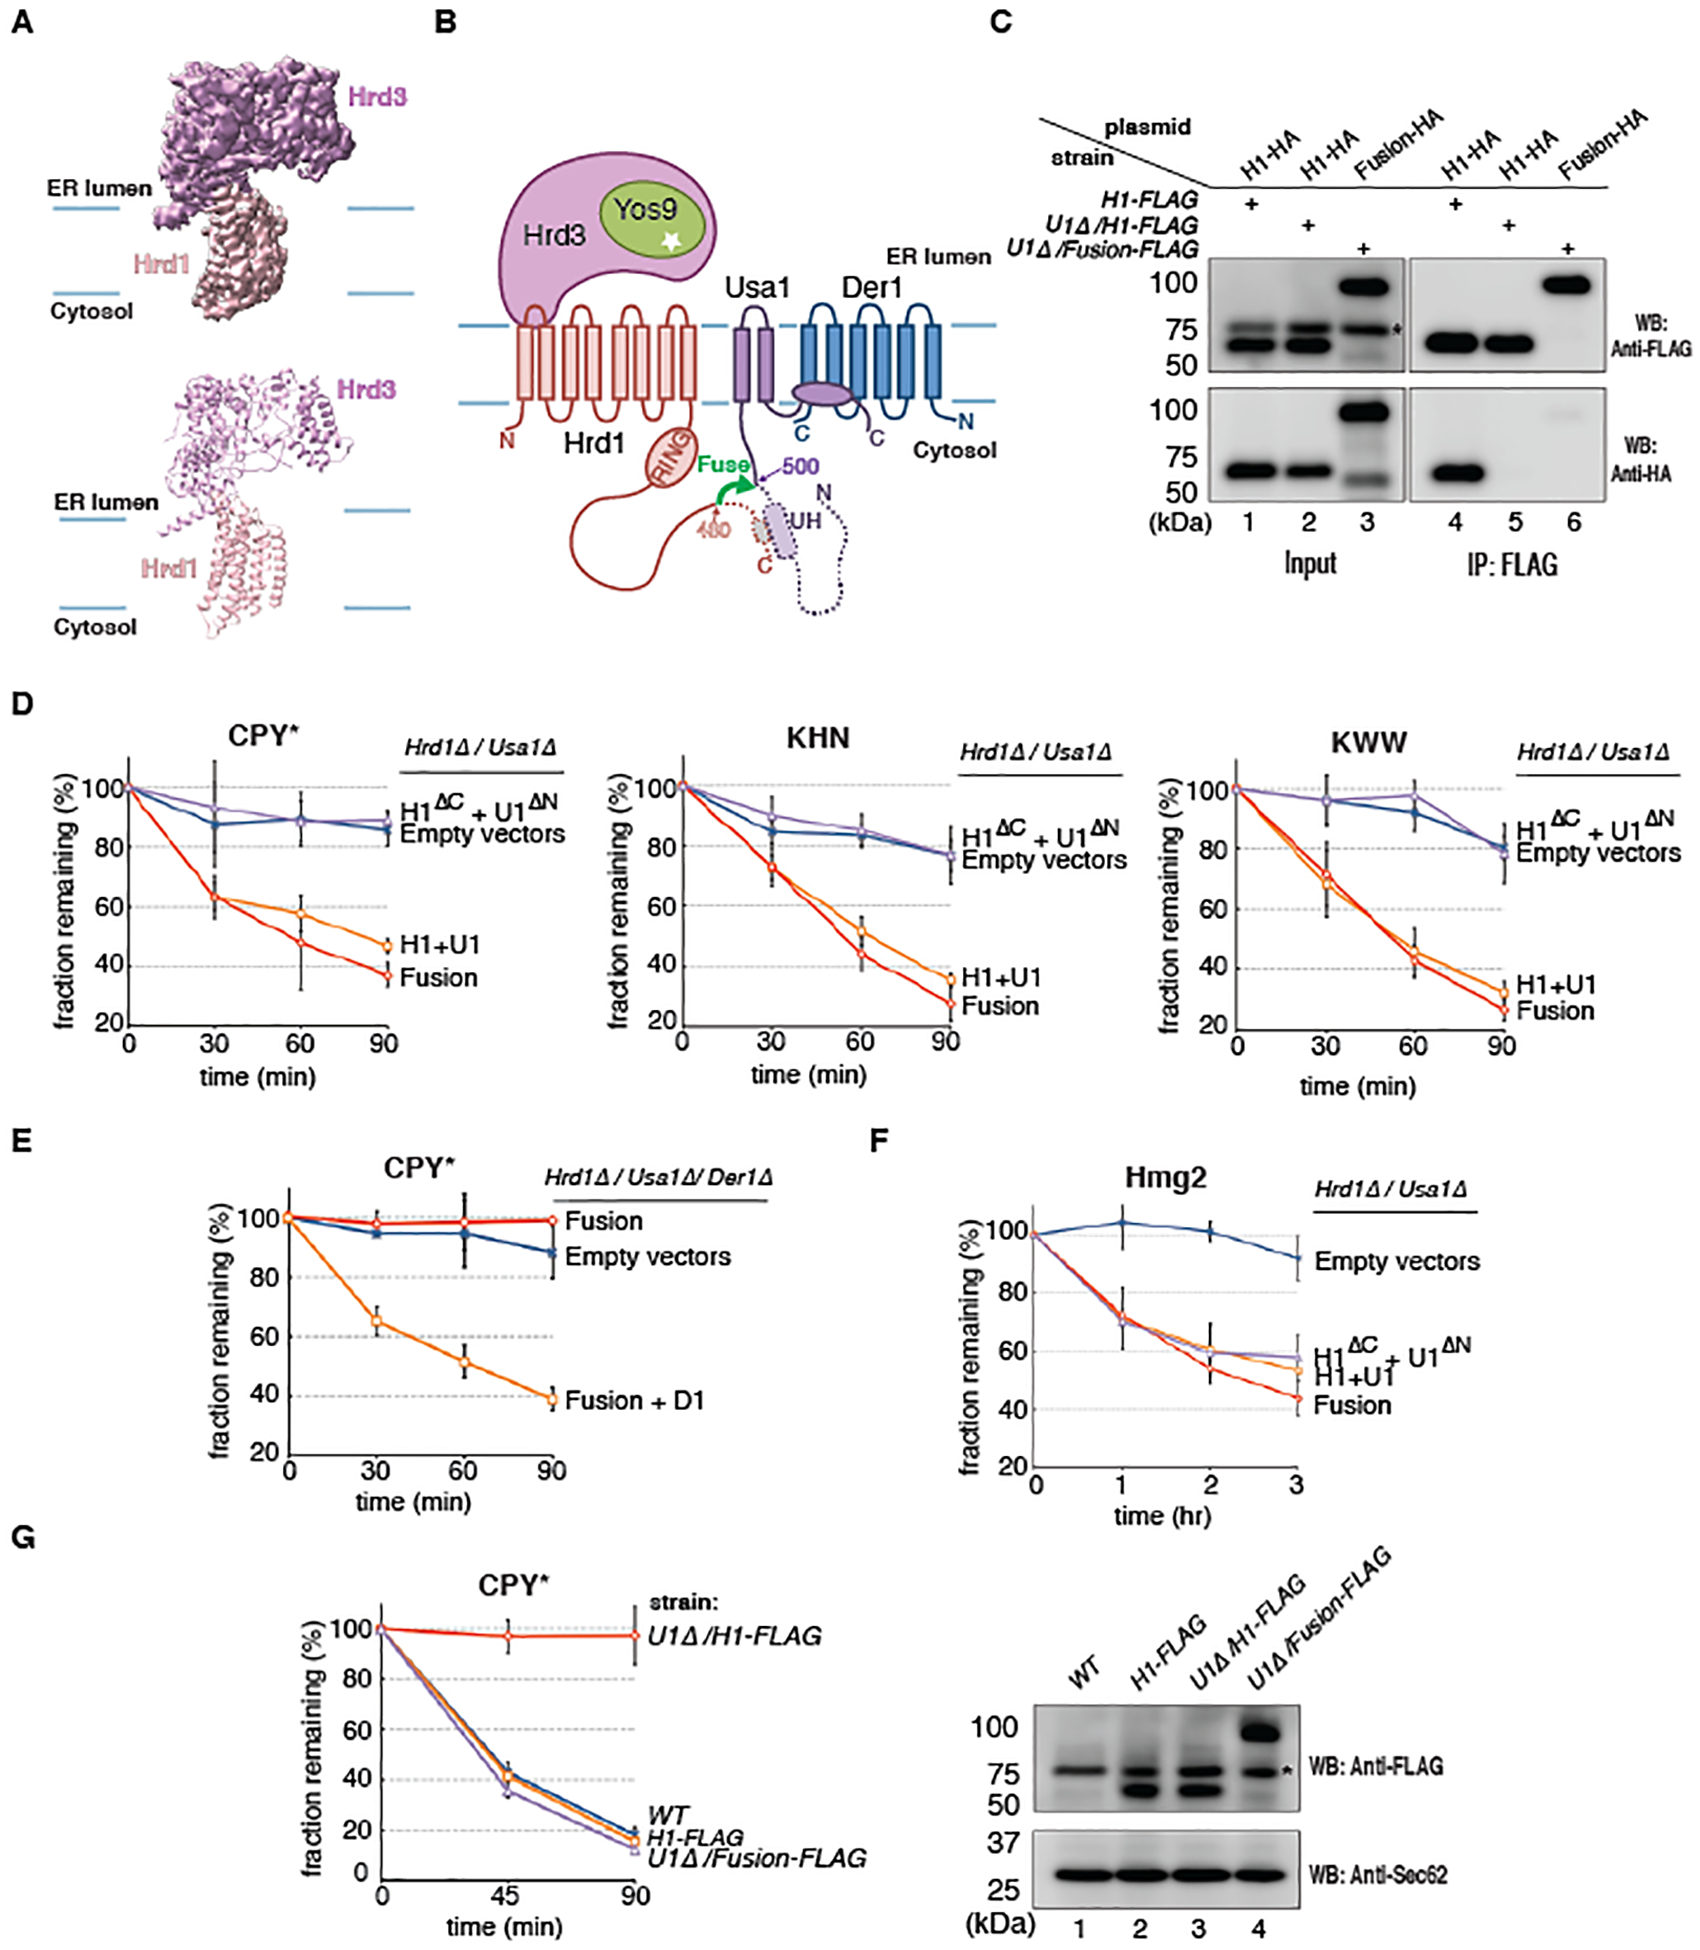
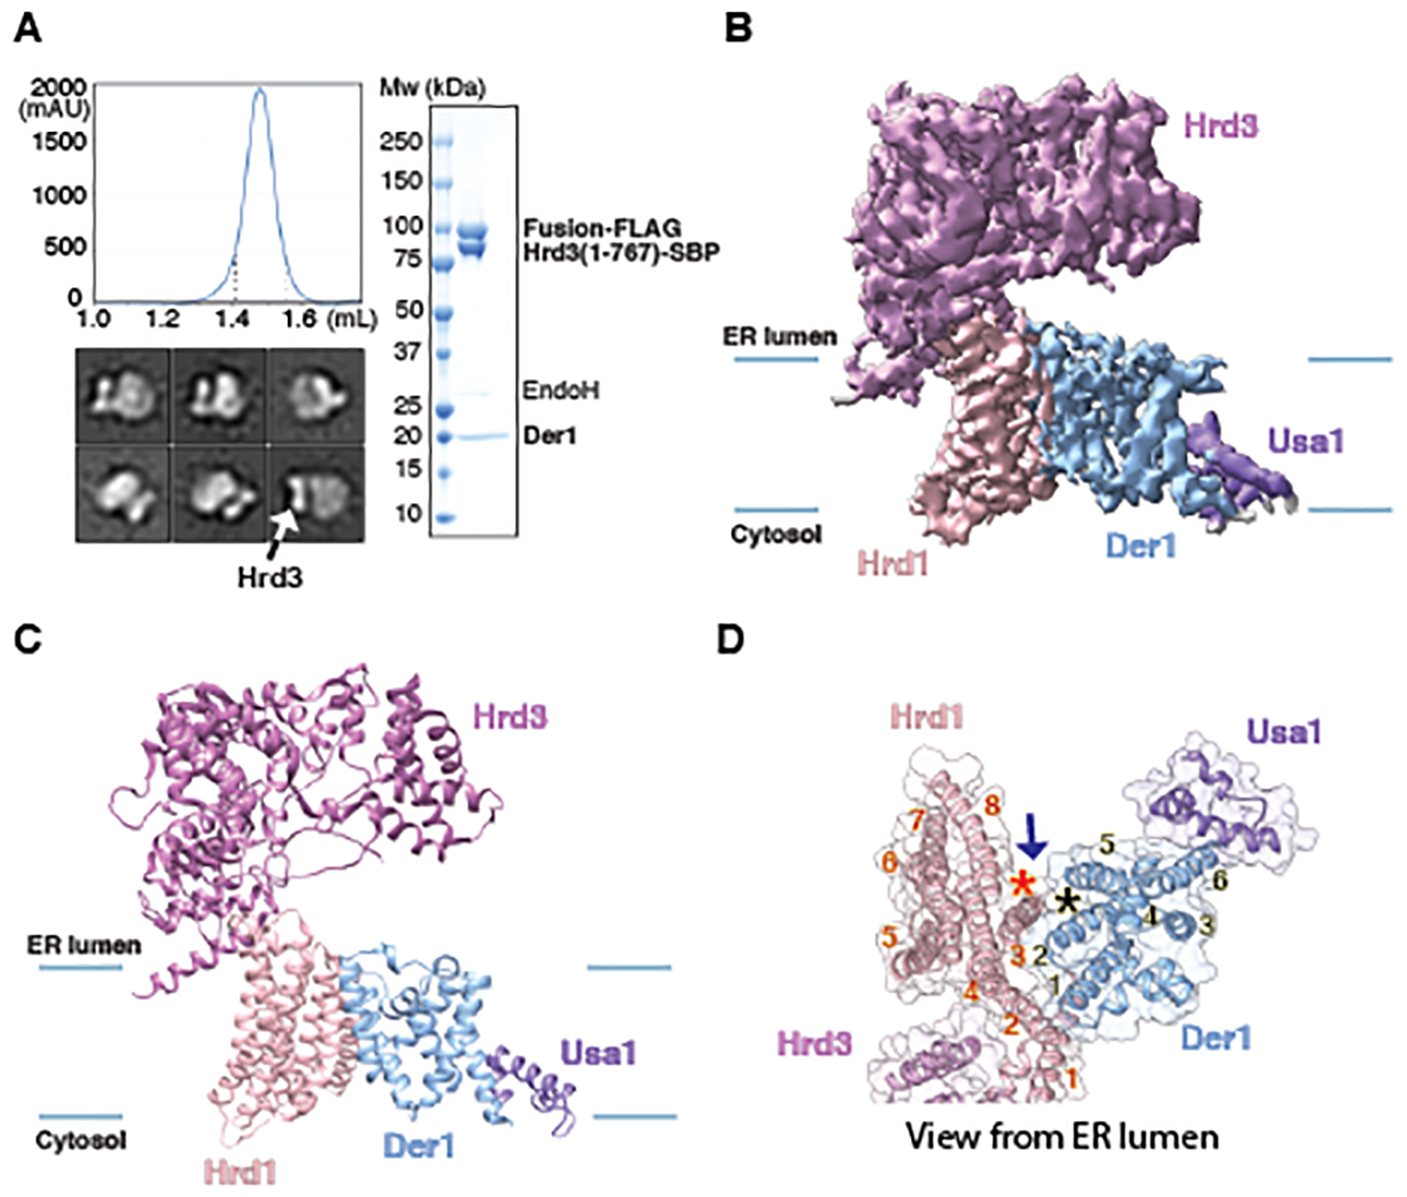
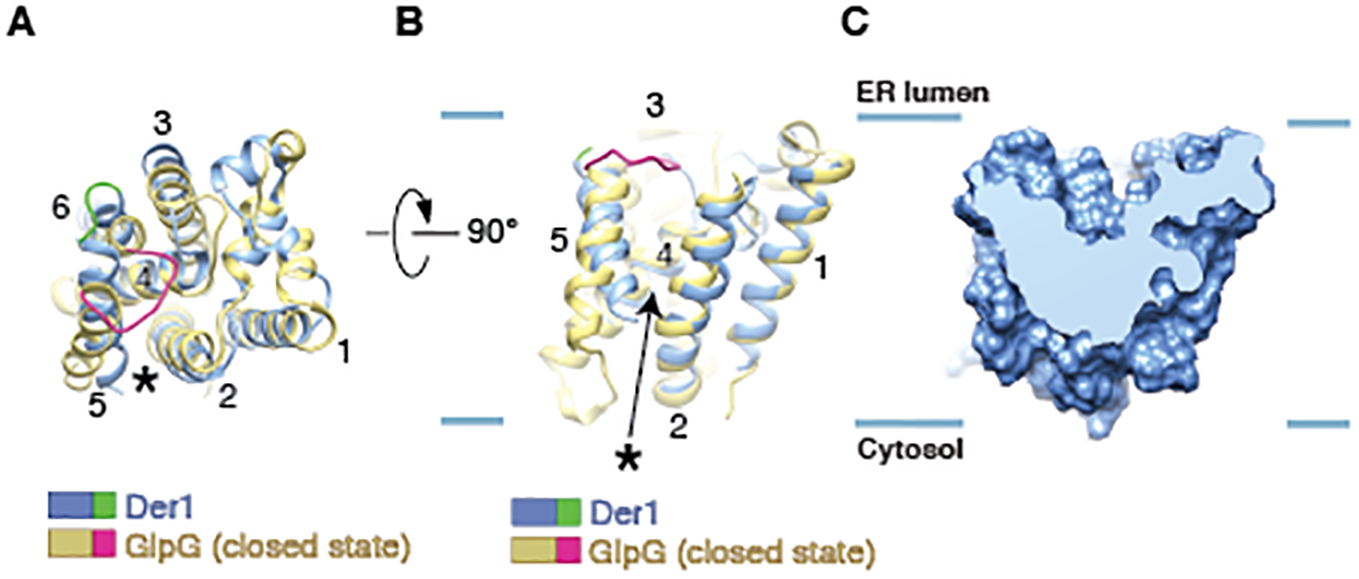
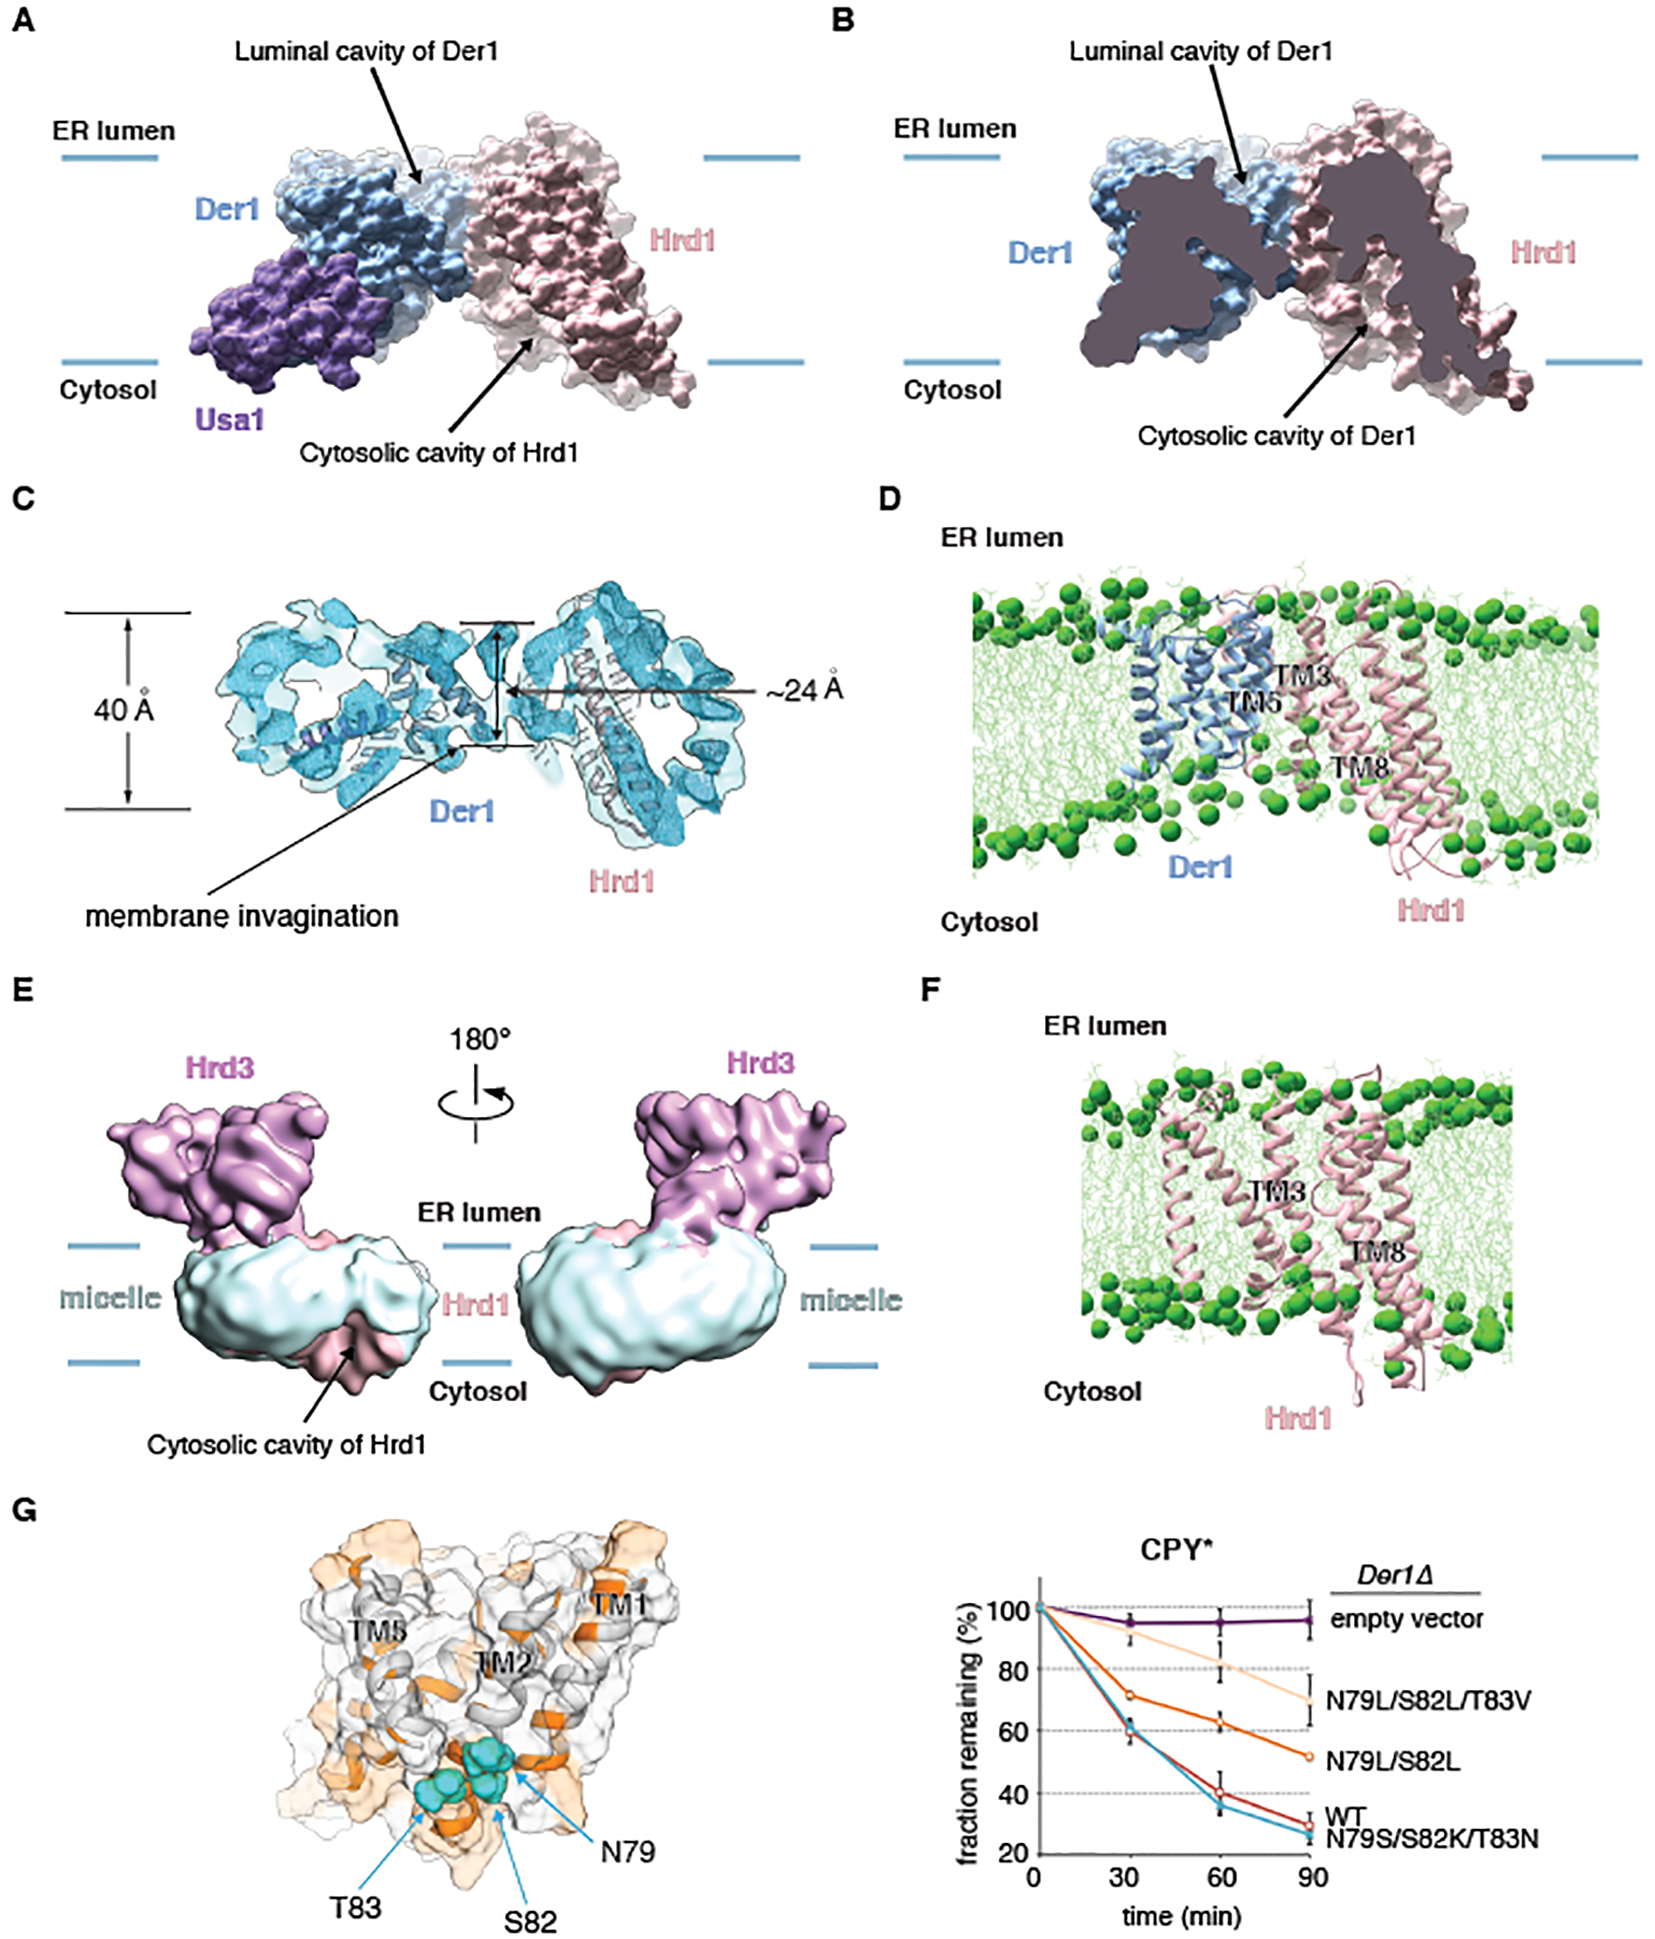
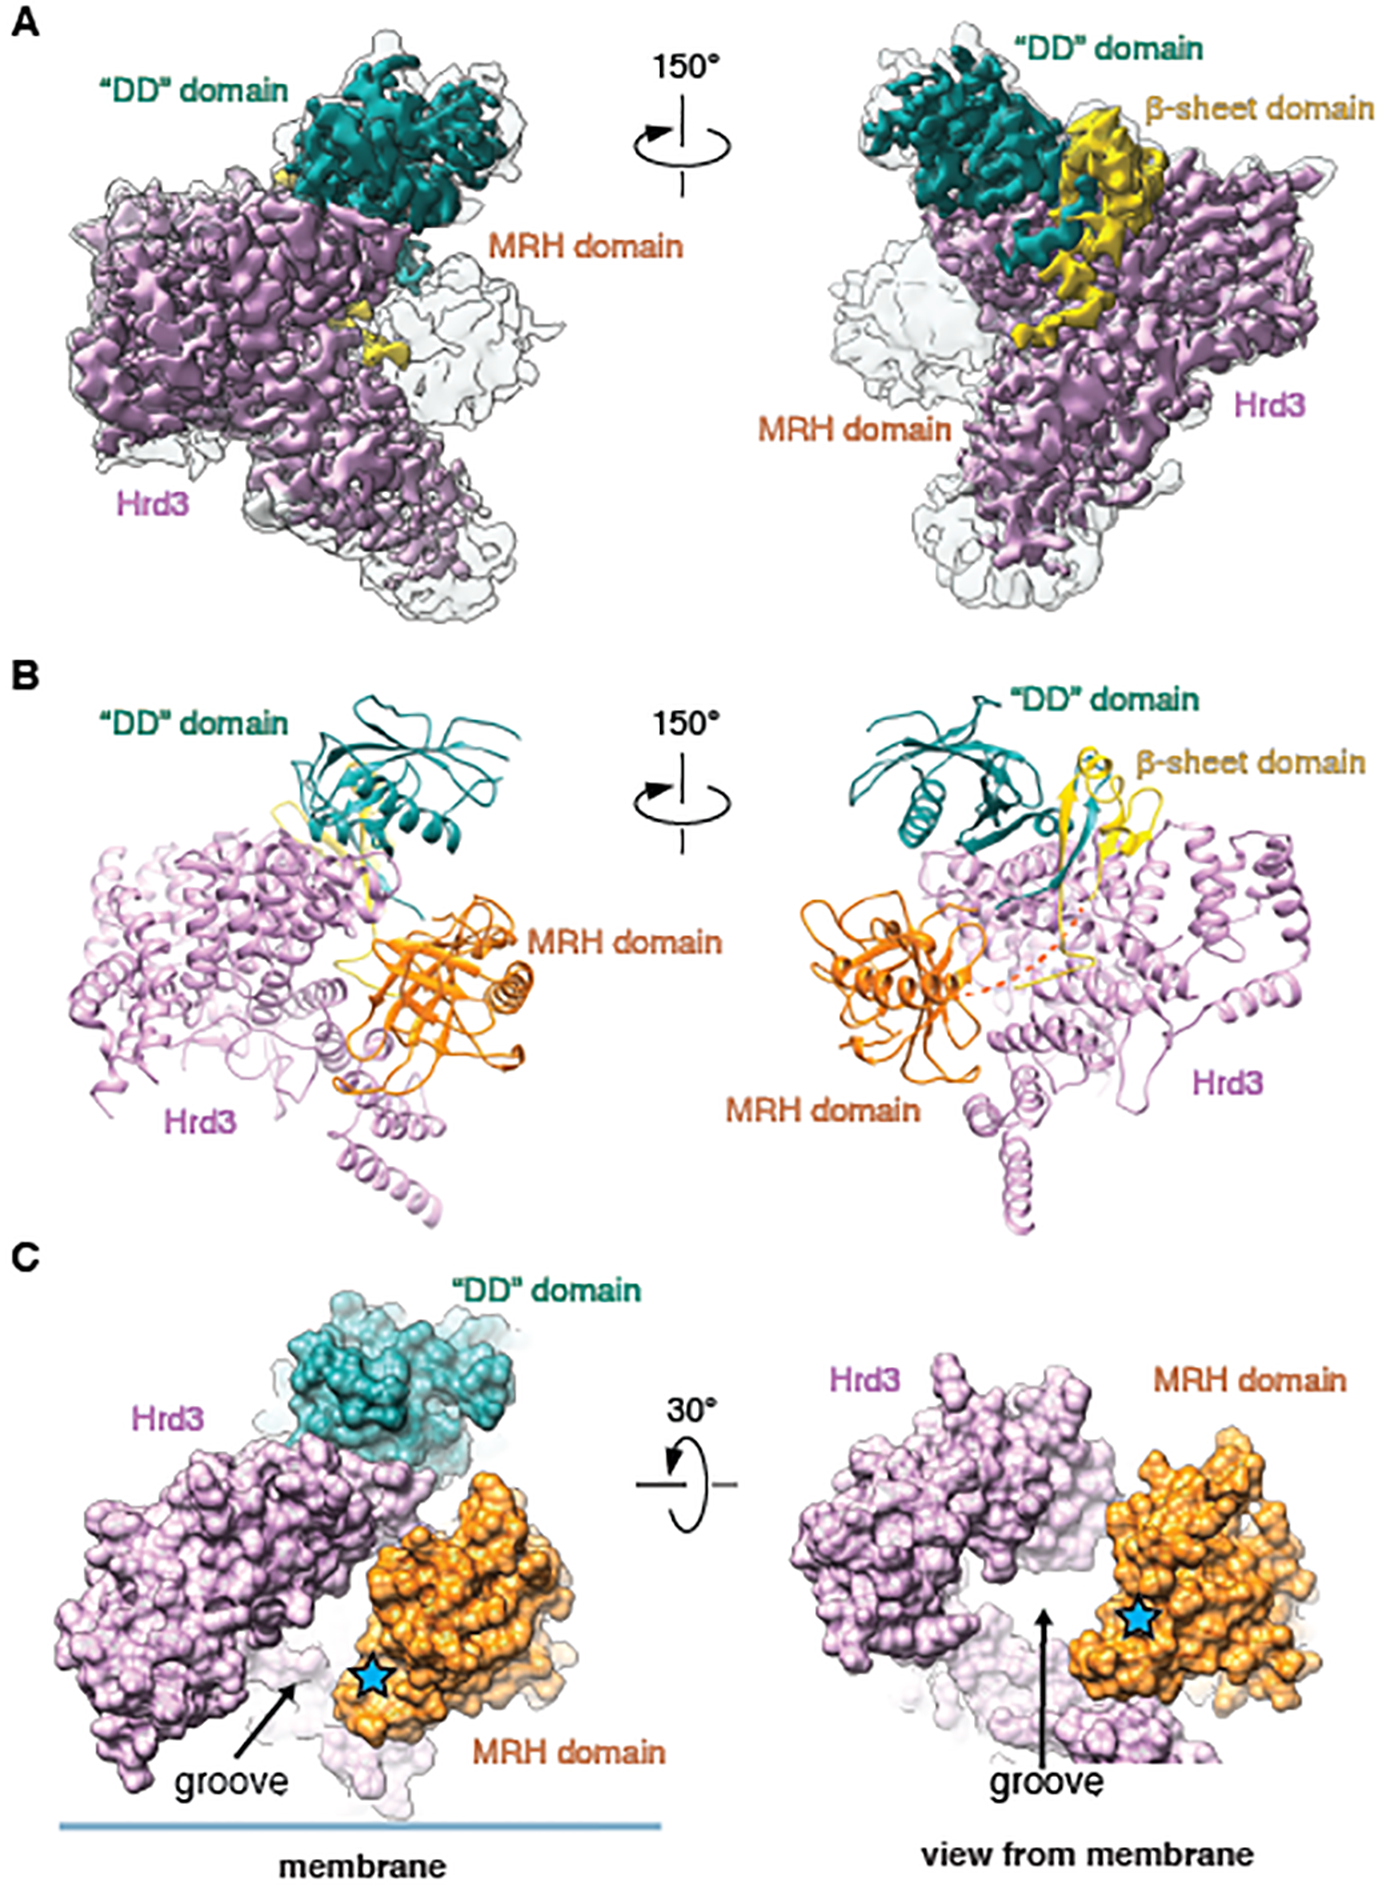
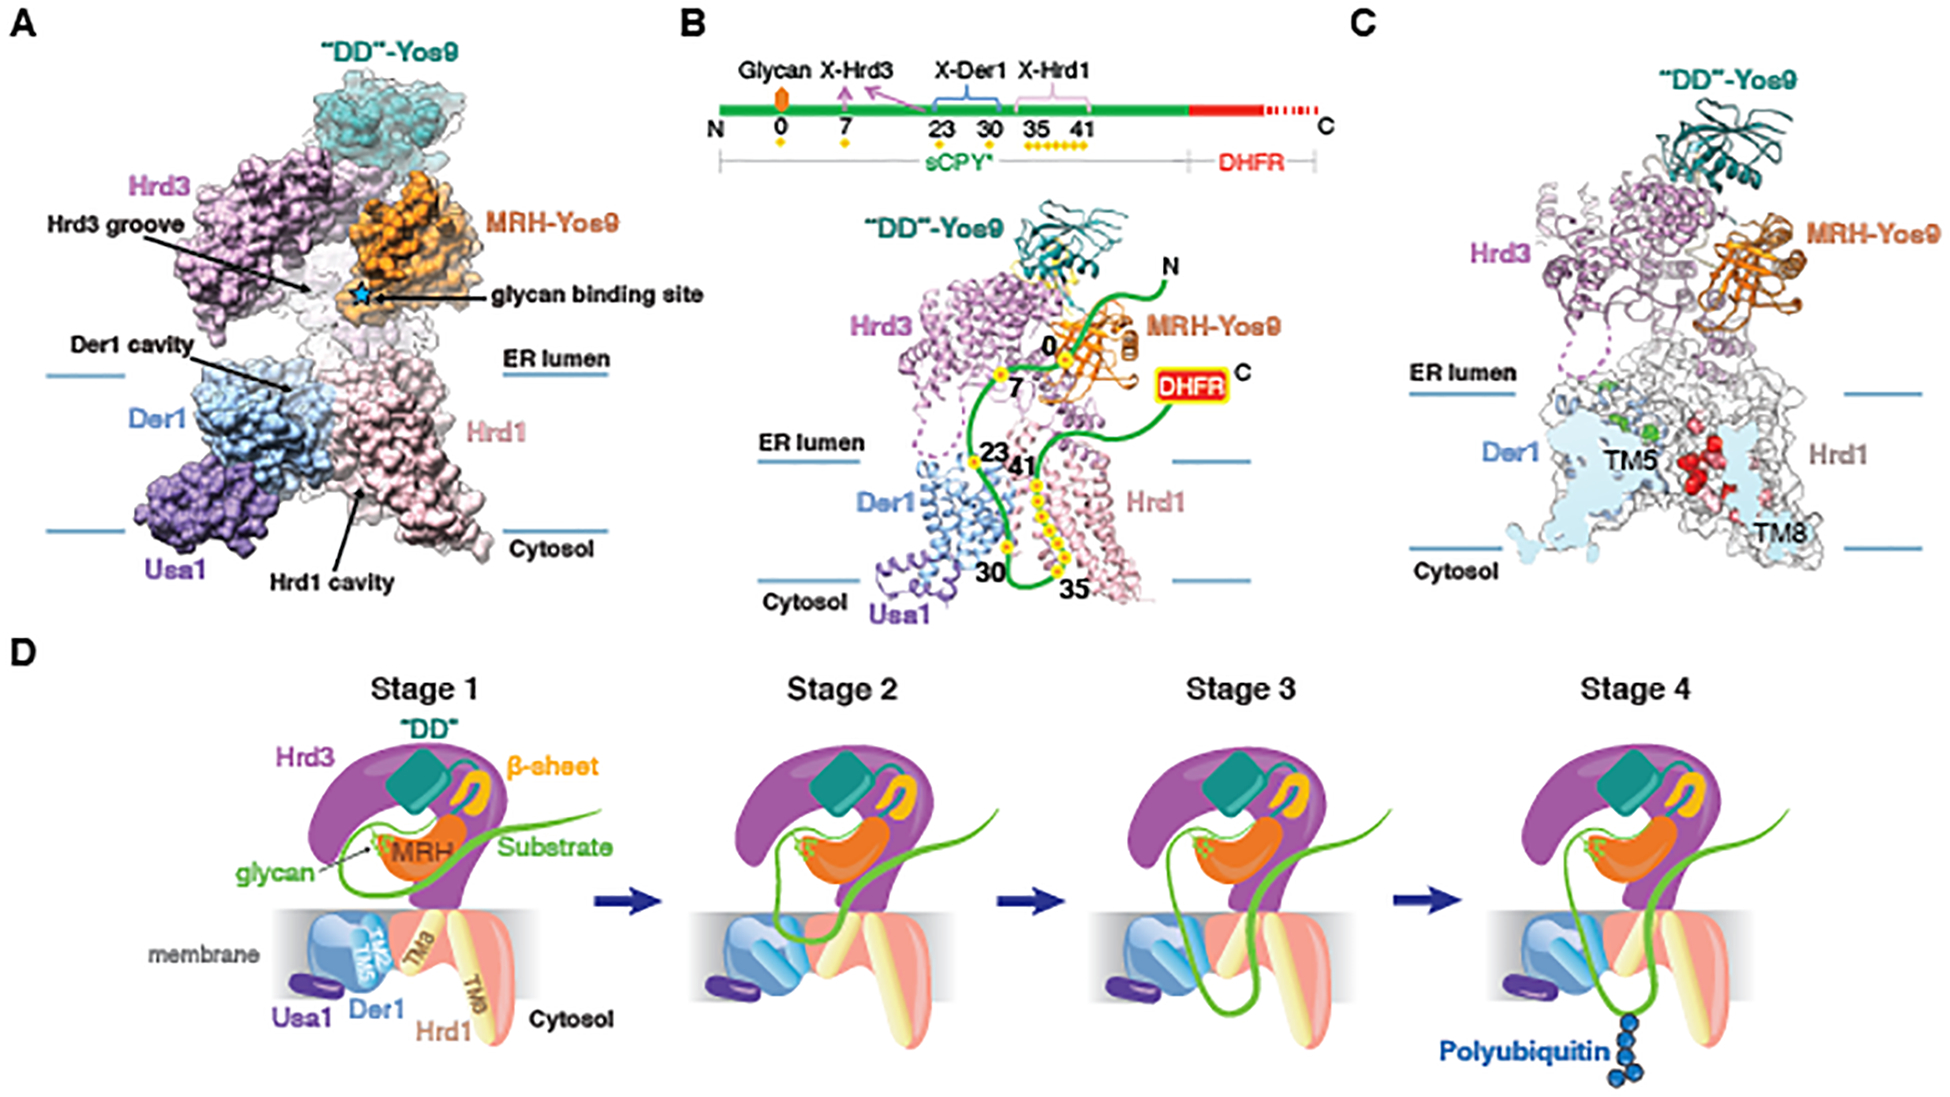
Misfolded luminal endoplasmic reticulum (ER) proteins undergo ER-associated degradation (ERAD-L): They are retrotranslocated into the cytosol, polyubiquitinated, and degraded by the proteasome. ERAD-L is mediated by the Hrd1 complex (composed of Hrd1, Hrd3, Der1, Usa1, and Yos9), but the mechanism of retrotranslocation remains mysterious. Here, we report a structure of the active Hrd1 complex, as determined by cryo-electron microscopy analysis of two subcomplexes. Hrd3 and Yos9 jointly create a luminal binding site that recognizes glycosylated substrates. Hrd1 and the rhomboid-like Der1 protein form two "half-channels" with cytosolic and luminal cavities, respectively, and lateral gates facing one another in a thinned membrane region. These structures, along with crosslinking and molecular dynamics simulation results, suggest how a polypeptide loop of an ERAD-L substrate moves through the ER membrane.


Conflict of interest statement

Competing interests:

The authors declare no competing financial interests.

Figures

Fig. 1.
Fig. 1.. Hrd1 functions as a monomer in ERAD-L.
(A) Side view of the cryo-EM map and cartoon model for the monomeric Hrd1-Hrd3 complex. (B) Topology of the Hrd1 complex. Hrd1 and Usa1 were fused (green arrow), deleting Hrd1 and Usa1 segments, including the UH domain (dotted segments), required for their normal interaction and oligomerization. (C) HA- and FLAG-tagged versions of Hrd1 (H1) or the Hrd1~Usa1 fusion were co-expressed from low-copy CEN-plasmids and the endogenous chromosomal Hrd1 locus, respectively, in S. cerevisiae cells containing or lacking Usa1 (U1Δ). Samples were subjected to immunoprecipitation (IP) with FLAG-antibodies and analyzed by SDS-PAGE and Western blotting (WB) with FLAG- or HA- antibodies. The star indicates a non-specific band. (D) Yeast cells lacking Hrd1 and Usa1 were transformed with CEN plasmids. The cells expressed either the Hrd1~Usa1 fusion or co-expressed full-length Hrd1 (H1) and Usa1 (U1), or the truncated Hrd1 and Usa1 fusion partners (H1ΔC and U1ΔN). The degradation of ERAD-L substrates was tested in cycloheximide-chase experiments. Shown are means and standard deviations of three independent experiments. (E) As in (D), but CPY* degradation was tested in a strain lacking Hrd1, Usa1, and Der1. The cells expressed either the Hrd1~Usa1 fusion alone or together with Der1 (D1) from CEN plasmids. (F) As in (D), but for an ERAD-M substrate. (G) CPY* degradation was tested in cells expressing Hrd1 or Hrd1~Usa1 fusion protein from the endogenous Hrd1 locus, both with a FLAG tag at the C-terminus. Usa1 was present or absent (U1Δ). A wild-type (WT) strain was used as a control. The right panel shows the expression level of the proteins determined by Western blotting (WB) with FLAG antibodies. Western blotting for Sec62 served as a loading control. The star indicates a non-specific band.
Fig. 2.
Fig. 2.. Cryo-EM structure of the Hrd1~Usa1-Der1-Hrd3 sub-complex.
(A) A FLAG-tagged fusion of Hrd1 and Usa1 was expressed together with SBP-tagged luminal domain of Hrd3 and untagged Der1 in S. cerevisiae cells. The complex was purified with streptavidin- and anti-FLAG- resins and subjected to size-exclusion chromatography. Protein eluting between the dotted lines was pooled and used for EM analysis. The right panel shows a Coomassie-stained SDS-PAGE gel after treatment of the purified sample with endoglycosidase H (Endo H) to allow better separation of Hrd3-SBP and Hrd1~Usa1-FLAG. The left lower panel shows representative 2D averages of negative-stain EM particle images. The box size is 210Å × 210Å. All particles contain one Hrd3 molecule (arrow), which appears as two blobs in some views. (B) Cryo-EM map of the Hrd1~Usa1-Der1-Hrd3 sub-complex in the expected orientation. Shown is a side view with membrane boundaries indicated by blue lines. (C) Side view of models for the Hrd1 complex components in cartoon representation, based on the map shown in (A). (D) As in (C), but for a view from the ER lumen and with the cartoon model embedded in a transparent space-filling model. TMs of Hrd1 and Der1 are numbered. The stars indicate the lateral gates of Hrd1 and Der1 and the arrow shows how lipid molecules could reach the gates.
Fig. 3.
Fig. 3.. Comparison of the structures of Der1 and rhomboid protease.
(A) Overlay of the structure of Der1 (blue) with that of the E. coli rhomboid protein glpG (yellow) in its closed state (PDB code 2IC8). The structures are shown in cartoon representation, viewed from the lumen. The star indicates the location of the lateral gate. The TM5-TM6 loops of Der1 and glpG are highlighted in green and red, respectively. (B) As in (A), but viewed from the side, with the lateral gate in the front. The blue lines indicate the membrane boundaries. (C) Side view of a cut through a space-filling model of Der1.
Fig. 4.
Fig. 4.. The lateral gates of Der1 and Hrd1 face one another in a thinned membrane region.
(A) Space-filling model of the membrane-embedded region of the Hrd1~Usa1-Der1-Hrd3 sub-complex, viewed from the side. The blue lines indicate the membrane boundaries. Hrd3 was omitted for clarity. (B) As in (A), but cut through the middle of the space-filling model. (C) Side view of the unsharpened EM map, cut through the middle of the micelle. Helices of Der1 and Hrd1 are shown as cartoons. (D) Snap-shot of an all-atom unrestrained MD simulation of the Hrd1-Der1 complex in a membrane consisting of a 1:1 mixture of POPC and DOPC. The MD simulation was performed for 1.2 μs. Shown is a side view with Hrd1 and Der1 in cartoon representation, phosphorus atoms in lipid head groups as green spheres, and lipid tails as green lines. (E) Cryo-EM map of the monomeric Hrd1-Hrd3 complex, filtered to 12 Å, with the surrounding micelle in light blue. The micelle is locally distorted at the lateral gate of the cytosolic Hrd1 cavity (arrow). (F) As in (D), but for Hrd1 alone. The MD simulation was performed for 1 μs. (G) Side-view of a transparent space-filling Der1 model with helices in cartoon representation. Hydrophilic regions are shown in orange and hydrophilic residues mutated in TM2 as balls. In the right panel, wild-type Der1 or mutants were expressed from low-copy CEN plasmids and tested in cycloheximide-chase experiments for CPY* degradation in cells lacking Der1. Shown are means and standard deviations of three independent experiments. Note that mutation to hydrophobic amino acids reduces ERAD-L, whereas mutation to other hydrophilic residues has no effect.
Fig. 5.
Fig. 5.. Cryo-EM structure of a Hrd3-Yos9 sub-complex.
(A) Cryo-EM map showing Hrd3 and Yos9 in two different views. Shown is an overlay of the sharpened (contoured at 0.026) and unsharpened map (contoured at 0.009) (in color and grey, respectively). The domains of Yos9 are labeled. (B) Cartoon models for Hrd3 and the Yos9 domains, viewed as in (A). (C) Space-filling model for the complex of Hrd3 and Yos9, viewed from the side (left) and from the membrane (right). The glycan-binding site in the MRH domain of Yos9 is highlighted by a star, and the putative polypeptide-binding groove of Hrd3 is indicated.
Fig. 6.
Fig. 6.. Composite Hrd1 complex structure and substrate interaction.
(A) Side view of the composite space-filling model for the entire Hrd1 complex, based on the structures of the Hrd1~Usa1-Der1-Hrd3 and Hrd3-Yos9 sub-complexes. Hrd3 was used to align the structures. (B) Position of an ERAD-L substrate, a fusion of a shortened version of CPY* (sCPY*) and DHFR (sCPY*-DHFR), in the Hrd1 complex, as deduced from photo-crosslinking experiments (11). Photo-reactive probes were incorporated at different positions of sCPY*-DHFR. These positions crosslinked to Hrd1 complex components, as indicated in the scheme (red/yellow dots; the glycan attachment site is labeled as position 0). The DHFR part remains in the ER lumen (11). A flexible segment of Hrd3 is shown as a dotted line. (C) Positions of Hrd1 and Der1 interacting with sCPY*-DHFR, as deduced from photo-crosslinking experiments with probes in Hrd1 (Fig. S16; residues in red) or in Der1 (22) (residues in green). (D) Model for the different stages during retro-translocation of an ERAD-L substrate (for details, see text).

Comment in

References

    1. Preston GM, Brodsky JL, The evolving role of ubiquitin modification in endoplasmic reticulum-associated degradation. Biochem. J 474, 445–469 (2017). - PMC - PubMed
    1. Wu X, Rapoport TA, Mechanistic insights into ER-associated protein degradation. Curr. Opin. Cell Biol 53, 22–28 (2018). - PMC - PubMed
    1. Guerriero CJ, Brodsky JL, The delicate balance between secreted protein folding and endoplasmic reticulum-associated degradation in human physiology. Physiol. Rev 92, 537–576 (2012). - PMC - PubMed
    1. Wangeline MA, Vashistha N, Hampton RY, Proteostatic Tactics in the Strategy of Sterol Regulation. Annu. Rev. Cell Dev. Biol 33, 467–489 (2017). - PMC - PubMed
    1. Johnson BM, DeBose-Boyd RA, Underlying mechanisms for sterol-induced ubiquitination and ER-associated degradation of HMG CoA reductase. Semin. Cell Dev. Biol 81, 121–128 (2018). - PMC - PubMed

Publication types

MeSH terms