. 2020 Apr 23;11(1):1961.
doi: 10.1038/s41467-020-15846-0.

LGR5 marks targetable tumor-initiating cells in mouse liver cancer

Affiliations

LGR5 marks targetable tumor-initiating cells in mouse liver cancer

Wanlu Cao et al. Nat Commun. .

Abstract

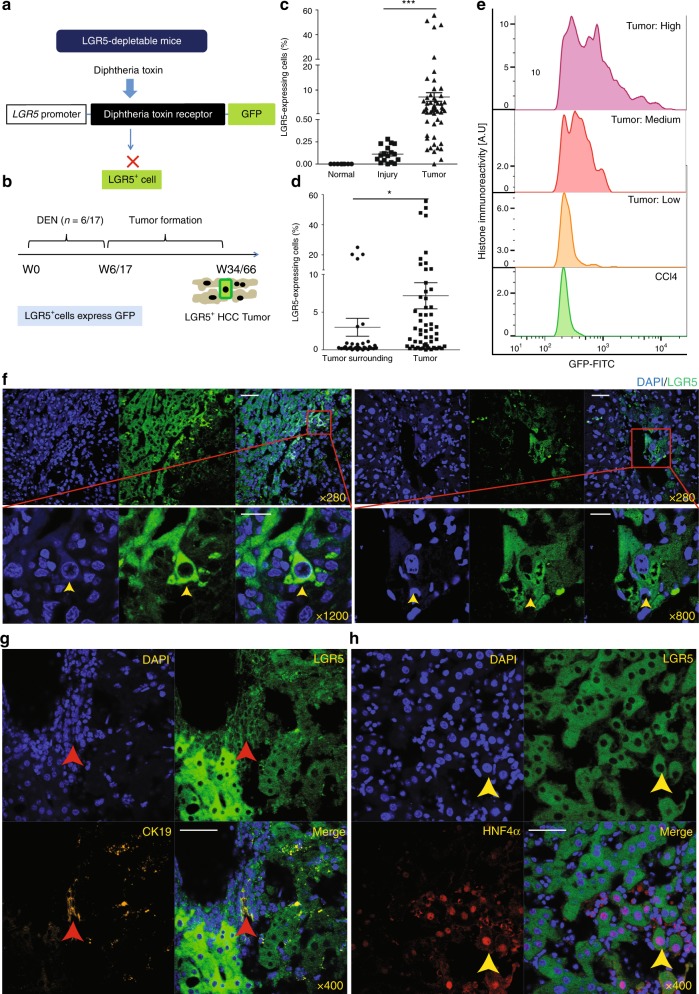
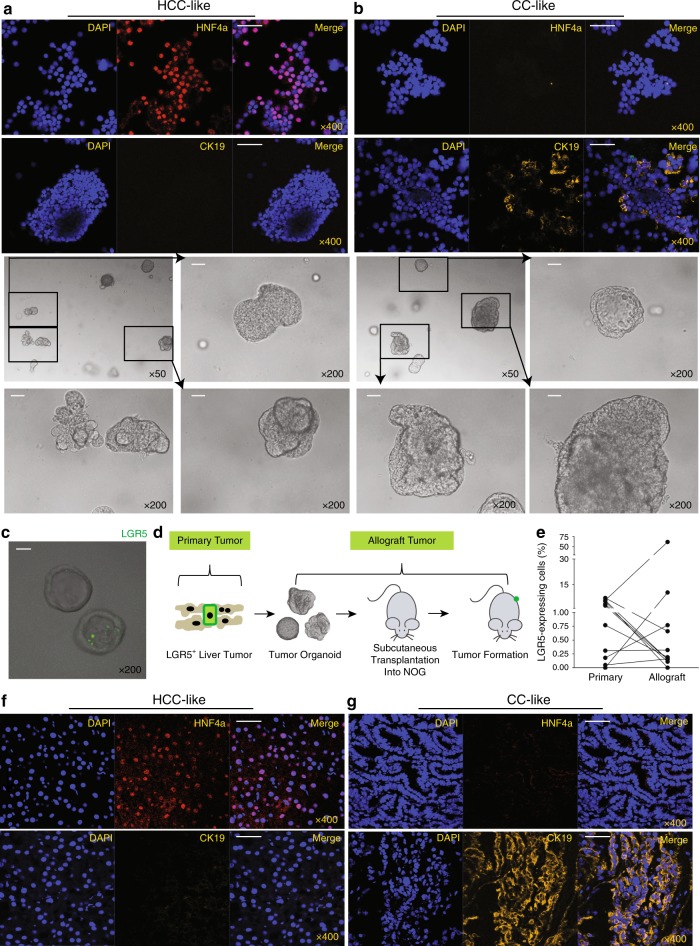
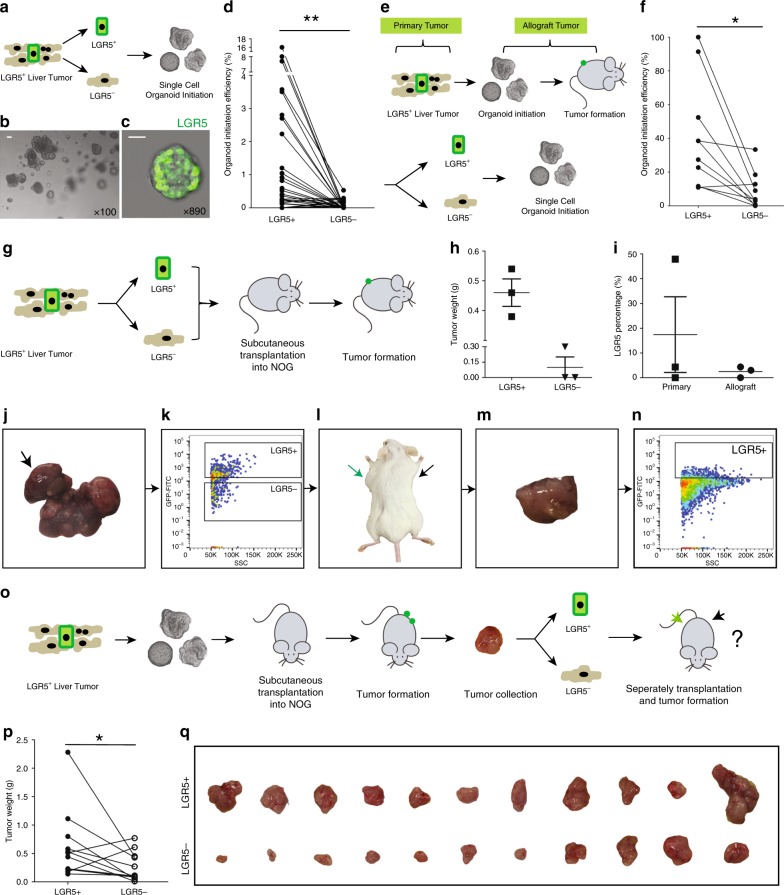
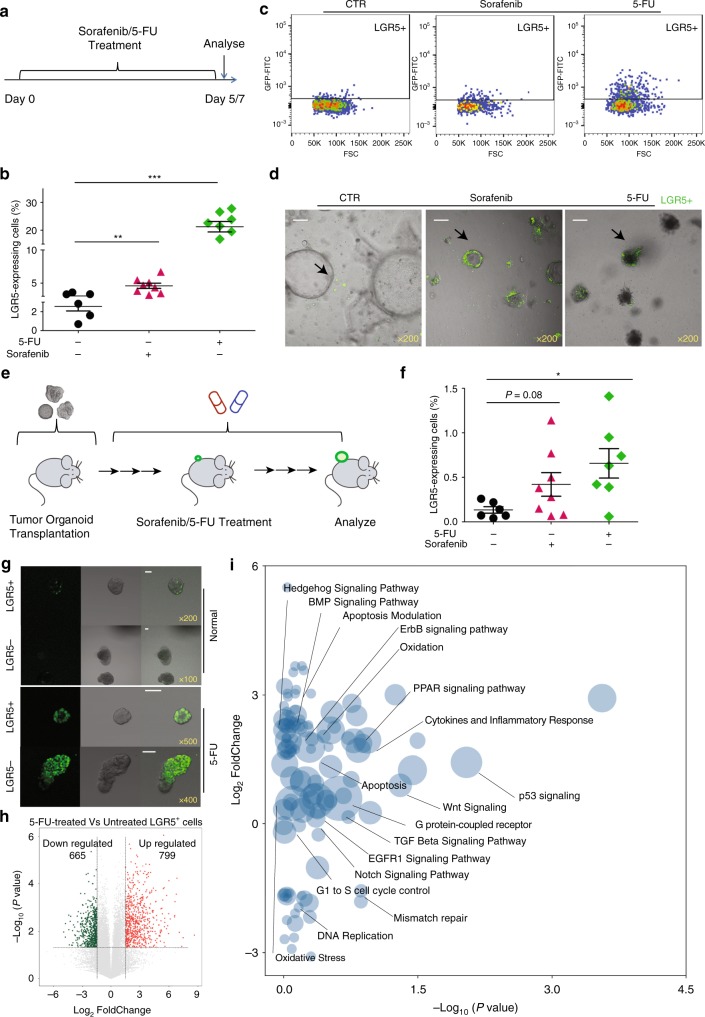
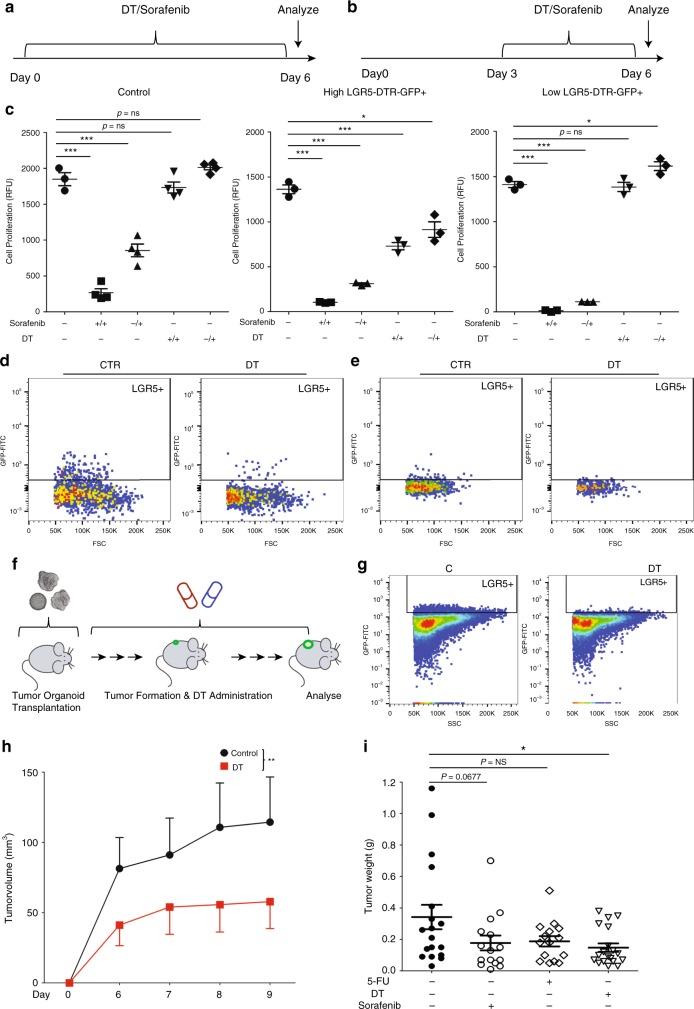
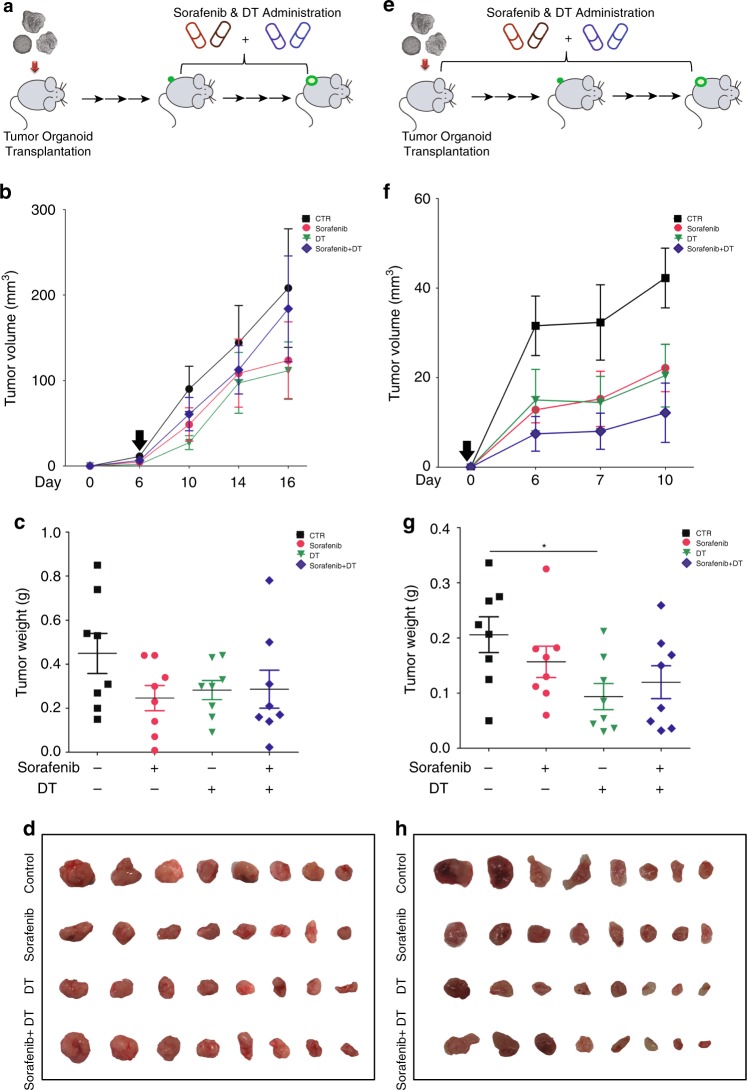
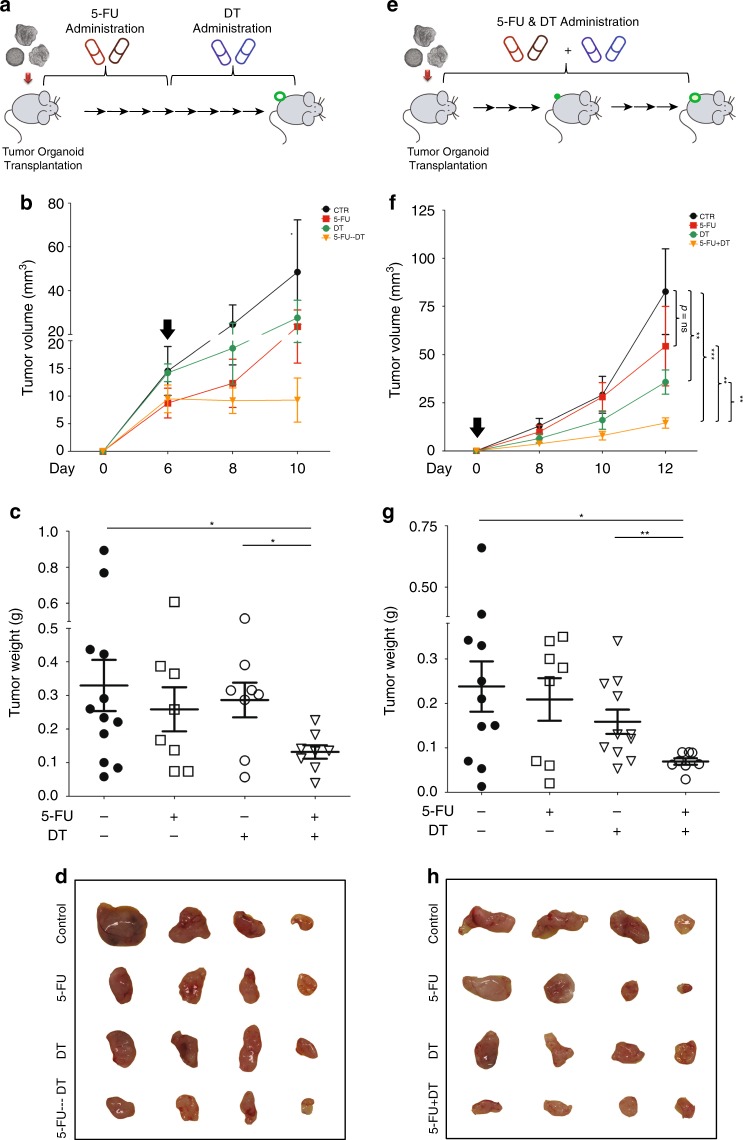
Cancer stem cells (CSCs) or tumor-initiating cells (TICs) are thought to be the main drivers for disease progression and treatment resistance across various cancer types. Identifying and targeting these rare cancer cells, however, remains challenging with respect to therapeutic benefit. Here, we report the enrichment of LGR5 expressing cells, a well-recognized stem cell marker, in mouse liver tumors, and the upregulation of LGR5 expression in human hepatocellular carcinoma. Isolated LGR5 expressing cells from mouse liver tumors are superior in initiating organoids and forming tumors upon engraftment, featuring candidate TICs. These cells are resistant to conventional treatment including sorafenib and 5-FU. Importantly, LGR5 lineage ablation significantly inhibits organoid initiation and tumor growth. The combination of LGR5 ablation with 5-FU, but not sorafenib, further augments the therapeutic efficacy in vivo. Thus, we have identified the LGR5+ compartment as an important TIC population, representing a viable therapeutic target for combating liver cancer.


Conflict of interest statement

The authors declare no competing interests.

Figures

Fig. 1
Fig. 1. Primary murine liver tumors are enriched with LGR5-expressing cells.
a Principle of Lgr5–DTR–GFP transgenic mouse strategy used in this study. b Principle of the experimental strategy used to induce primary murine tumors in the context of this study. c The percentage of LGR5+ cells, as determined by flow cytometry, is significantly higher in liver tumors from DEN-treated (7.29 ± 1.76%, n = 55) as compared with livers from untreated animals (0 ± 0%, n = 8) or injured livers from CCl4-treated animals (0.11 ± 0.022%, n = 17) (Welch test, P = 0.0001). d The percentage of LGR5–GFP+ cells is significantly increased in liver tumors (7.29 ± 1.76%, n = 55) as compared with the tumor-surrounding tissues (2.93 ± 1.15%, n = 34) of the same mice (Welch test, P = 0.0407). e Liver tumor-derived LGR5–GFP+ cells showed increased fluorescence intensity when compared with LGR5–GFP+ cells derived from CCl4-injured livers. f Representative images showing LGR5–GFP+ cells as present in liver tumors. Yellow arrow: LGR5–GFP+ cell. DAPI: blue. Upper panels: scale bar = 50 µm; lower panels: scale bar = 20 µm. g, h Representative confocal images showing the expression of the cholangiocyte marker (g, CK19, yellow) and the hepatocyte-specific marker (h, HNF4α, red) in LGR5–GFP-expressing cells, Scale bar = 50 µm. Mean ± SEM. Source data are provided as a Source Data file.
Fig. 2
Fig. 2. The expression of LGR5 is upregulated in human HCC tissues.
a Upregulation of LGR5 expression in HCC tissues (n = 74) compared with tumor-free liver tissues (TFL, n = 75) from the Erasmus MC cohort (paired T test, P = 0.0066). GUSB (beta-glucuronidases), HPRT1 (hypoxanthine phosphoribosyltransferase 1), and PMM1 (phosphomannomutase 1) were used as reference genes for normalization. b The expression of LGR5 in HCC tissues compared with TFL stratified based on the etiologies of HCC (paired T test). FHCC fibrolamellar carcinoma, HBV hepatitis B virus, HCV hepatitis C virus, NASH nonalcoholic steatohepatitis, Alc alcohol. Patient number: alcohol (n = 16); FHCC (n = 3); HBV (n = 9); HCV (n = 5); HCV + alcohol (n = 6); NASH (n = 8); unknown (n = 21); HBV + Alc/NASH/HCV (n = 5). c Kaplan–Meier curve of HCC patient survival with high (n = 37) and low (n = 37) LGR5 expression (cutoff value based on median value—0.047). Mean ± SEM. Source data are provided as a Source Data file.
Fig. 3
Fig. 3. Maintenance of LGR5-expressing cells in liver tumor organoids and allograft tumors.
a, b Representative pictures showing organoid lines that predominately express the hepatocyte marker HNF4ɑ (a) or the cholangiocyte marker CK19 (b) (upper panels: IF staining; lower panels: bright-field microscopic pictures, scale bar = 50 µm). c Representative pictures showing the presence of LGR5- expressing cells in organoids. LGR5-driven GFP: green. Scale bar = 50 µm. d An outline of the experimental strategy used to transplant tumor organoid lines into immunodeficient mice. e The percentages of LGR5-expressing cells in allograft tumors and the corresponding primary tumors (primary vs. allograft: 2.8 ± 0.8% vs. 6.8 ± 5.6%, n = 11, P = 0.3577). f, g Representative pictures of allograft tumors that mainly express either the hepatocyte marker HNF4ɑ (f) or the cholangiocyte marker CK19 (g). Scale bar = 50 µm. Mean ± SEM. Source data are provided as a Source Data file.
Fig. 4
Fig. 4. Single LGR5+ cells from liver tumors are superior in organoid and tumor initiation.
a An outline of the experimental strategy for studying ex vivo organoid initiation of cells derived from primary murine liver tumors. b A representative picture of organoids derived from single LGR5+ cells. Scale bar = 50 µm. c Representative confocal micrograph of a single LGR5+ cell-initiated organoid dominated by LGR5-expressing cells. LGR5-driven GFP: green. Scale bar = 20 µm.  d Organoid initiation efficiency of LGR5–GFP+ and LGR5–GFP cells, isolated from primary tumors (LGR5+ cells: 25 out of 71 tissues, 35.2%; LGR5 cells: 11 out of 71 tissues, 15.5%) (paired T test, 2.13 ± 0.67% vs. 0.065 ± 0.023%, n = 30, P = 0.0048). e An outline of the strategy used to study ex vivo organoid initiation of allograft tumor-derived cells. f Efficiency of organoid initiation by allograft liver tumor-derived LGR5–GFP+ and LGR5–GFP cells (paired T test, 40.46 ± 10.19% vs. 9.84 ± 3.93%, n = 10, P = 0.0187). g Outline of the experimental strategy used to assess in vivo tumor initiation of cells isolated from primary murine liver tumors. h Weight of tumors initiated by LGR5+ and LGR5 cells (LGR5+ vs. LGR5: 0.46 ± 0.046 g vs. 0.10 ± 0.10 g, n = 3) (formed tumor number: LGR5+ cells—3 out of 9; LGR5 cells—1 out of 9). i LGR5 expression in single LGR5+ cell-derived allograft tumors and the corresponding primary tumors (17.42 ± 15.29% vs. 2.47 ± 1.27%, n = 3). jn Representative pictures showing that LGR5–GFP+ and LGR5–GFP cells (k) were isolated from DEN-induced primary liver tumors (j). Then, LGR5–GFP+ cells (green arrow) initiated allograft tumors in immunodeficient mouse (ln). The initiated allograft tumors sustained LGR5 expression (n). o An outline of the experimental strategy for in vivo tumor initiation assay of cells isolated from allograft murine liver tumors. p, q Tumor weight (p) and macroscopic aspect (q) of allografts initiated by LGR5–GFP+ cells and LGR5–GFP cells (isolated from allograft tumors) (0.64 ± 0.19 g vs. 0.27 ± 0.08 g, n = 11, P = 0.0418). Mean ± SEM. Source data are provided as a Source Data file.
Fig. 5
Fig. 5. Anticancer treatment selects for LGR5+ cells.
a Outline of the ex vivo experimental strategy used to assess the effects of drug treatment on the size of the LGR5+ compartment. b The fraction of LGR5–GFP+ cells is significantly increased upon treatment with sorafenib or 5-FU (vehicle control vs. 10 µM sorafenib vs. 10 µM 5-FU: 2.6 ± 0.5% vs. 4.6 ± 0.4% vs. 21.3 ± 1.9%). c, d Representative FACS plots (c) and confocal pictures (d) demonstrating that the fraction of LGR5–GFP+ cells is increased upon treatment with sorafenib or 5-FU, scale bar = 50 µm. e An outline of the experimental strategy used for testing the effects of drug administration in vivo. f The percentages of LGR5–GFP+ cells is increased upon administration of sorafenib or 5-FU to allografted animals (vehicle control vs. sorafenib vs. 5-FU: 0.13 ± 0.04%, n = 6 vs. 0.42 ± 0.13 %, n = 8 vs. 0.66 ± 0.17%, n = 7). g Representative confocal pictures showing that both single LGR5–GFP+ and LGR5–GFP cell-initiated organoids contain LGR5-expressing cells, and the relative fraction of LGR5-expressing cells is increased in treatment-resistant organoids. LGR5-driven GFP: green, scale bar = 50 µm. h A volcano plot showing the most significantly differentially expressed genes between 5-FU treated/untreated LGR5+ cells. i Gene enrichment analysis (with the library of Wiki2019) within the differentially expressed genes. Mean ± SEM. Source data are provided as a Source Data file.
Fig. 6
Fig. 6. LGR5 lineage ablation inhibits organoid and tumor growth.
a, b The outlines of the ex vivo experimental strategy to assess the effects of anticancer drug treatment on organoid initiation, and delineate its temporal aspect (a) or during organoid expansion (b). c The response of wild-type tumor organoids (left) and Lgr5–DTR–GFP mice-derived tumor organoids, with relatively high LGR5 expression (the percentage of LGR5 expression is greater than 1%) (middle) or low LGR5 expression (the percentage of LGR5 expression is lesser than 1%) (right) during regular expansion to DT/sorafenib treatment. −/+: drug treatment during the expansion period; +/+: drug treatment since the initial culture day (unpaired T test). d, e Representative FACS plots showing that LGR5–GFP+ cells are depleted by DT treatment, for high LGR5 expression organoid strains (d) and low LGR5 expression organoid strains (e). f Outlines of the experimental strategy used to assess the efficacy of DT/sorafenib/5-FU administration on allograft tumors in mice. g Representative FACS plots from experiments validating the strategy to deplete LGR5+ cells. h A representative growth curve showing the volumes of tumors derived from the vehicle control group and the DT-administered group (n = 8, two-way ANOVA). i The weight of tumors from vehicle control, DT, 5-FU, or sorafenib-treated groups, on the day of mice sacrifice (control vs. sorafenib vs. 5-FU vs. DT: 0.34 ± 0.078 g, n = 18 vs. 0.18 ± 0.047 g, n = 15 vs. 0.19 ± 0.033 g, n = 15 vs. 0.15 ± 0.027 g, n = 19). Mean ± SEM. Source data are provided as a Source Data file.
Fig. 7
Fig. 7. Combination of LGR5 lineage ablation with sorafenib does not enhance the efficacy.
a Outline of the experimental strategy to assess the combinatory effect of LGR5 lineage ablation with sorafenib. Sorafenib and DT were administered every other day for in total 10 days since visualization of tumor formation after organoid engraftment. b Representative growth curves showing tumor volumes in the vehicle control (CTR), sorafenib, DT, and sorafenib + DT-treated groups. Black arrow: onset of administration. c Tumor masses from these four groups (CTR vs. sorafenib vs. DT. vs. sorafenib + DT: 0.45 ± 0.09 g, n = 8 vs. 0.25 ± 0.06 g, n = 8 vs. 0.28 ± 0.043 g, n = 8 vs. 0.29 ± 0.09, n = 8). d Images showing tumors from these four groups. e Outlines of the experimental strategy for assessing the effects of combining LGR5 lineage ablation and sorafenib treatment. Sorafenib, DT, or the combination were administered immediately since transplantation of the organoids every other day, for in total 10 days. f Representative growth curves showing tumor volumes of the four groups. Black arrow: onset of administration. g The tumor masses of these four groups (CTR vs. sorafenib vs. DT vs. sorafenib + DT: 0.21 ± 0.03 g, n = 8 vs. 0.16 ± 0.03 g, n = 8 vs. 0.09 ± 0.02 g, n = 8 vs. 0.12 ± 0.03 g, n = 8). h Images showing the tumors from the different groups. Mean ± SEM. Source data are provided as a Source Data file.
Fig. 8
Fig. 8. Combination of LGR5 lineage ablation with 5-FU results in enhanced anticancer efficacy.
a Outline of the experimental strategy to assess the combinatory effect of LGR5 lineage ablation with 5-FU. Following tumor organoid allografting, 5-FU was administered for the first half of the experiment (every other day, for in total 6 days). DT was administered for the second half of the experiment (every other day, for in total 6 days). b Representative growth curves showing tumor volumes in the vehicle control group (CTR), the 5-FU monotherapy group, the DT administration-only group, and the hybrid 5-FU/DT group. Black arrow: onset of DT administration. c Tumor masses from these four groups (control vs. 5-FU vs. DT vs. 5-FU-DT: 0.33 ± 0.076 g, n = 12 vs. 0.25 ± 0.066 g, n = 8 vs. 0.29 ± 0.052 g, n = 8 vs. 0.13 ± 0.020 g, n = 8). d Representative images showing tumors from these four groups. e Outlines of the experimental strategy for assessing the effects of combined LGR5 lineage ablation and 5-FU treatment. 5-FU, DT, or the combination were administered since organoid engraftment every other day, for in total 12 days. f Representative growth curves showing tumor volumes of the four groups. Black arrow: onset of administration (two-way ANOVA). g The tumor masses of these four groups (control vs. 5-FU vs. DT vs. 5-FU + DT: 0.24 ± 0.056, n = 11 vs. 0.21 ± 0.048 g, n = 8 vs. 0.16 ± 0.027 g, n = 11 vs. 0.069 ± 0.007 g, n = 8). h Representative images showing the tumors from the different groups. Mean ± SEM. Source data are provided as a Source Data file.

References

    1. Clevers H. The cancer stem cell: premises, promises and challenges. Nat. Med. 2011;17:313–319. doi: 10.1038/nm.2304. - DOI - PubMed
    1. Batlle E, Clevers H. Cancer stem cells revisited. Nat. Med. 2017;23:1124–1134. doi: 10.1038/nm.4409. - DOI - PubMed
    1. Ebben JD, et al. The cancer stem cell paradigm: a new understanding of tumor development and treatment. Expert Opin. Ther. Targets. 2010;14:621–632. doi: 10.1517/14712598.2010.485186. - DOI - PMC - PubMed
    1. Huch M, et al. In vitro expansion of single Lgr5+ liver stem cells induced by Wnt-driven regeneration. Nature. 2013;494:247–250. doi: 10.1038/nature11826. - DOI - PMC - PubMed
    1. Barker N, et al. Identification of stem cells in small intestine and colon by marker gene Lgr5. Nature. 2007;449:1003–1007. doi: 10.1038/nature06196. - DOI - PubMed

Publication types

MeSH terms