. 2020 Apr 9:11:263.
doi: 10.3389/fgene.2020.00263. eCollection 2020.

Comparing Alternative Single-Step GBLUP Approaches and Training Population Designs for Genomic Evaluation of Crossbred Animals

Affiliations

Comparing Alternative Single-Step GBLUP Approaches and Training Population Designs for Genomic Evaluation of Crossbred Animals

Amanda B Alvarenga et al. Front Genet. .

Abstract

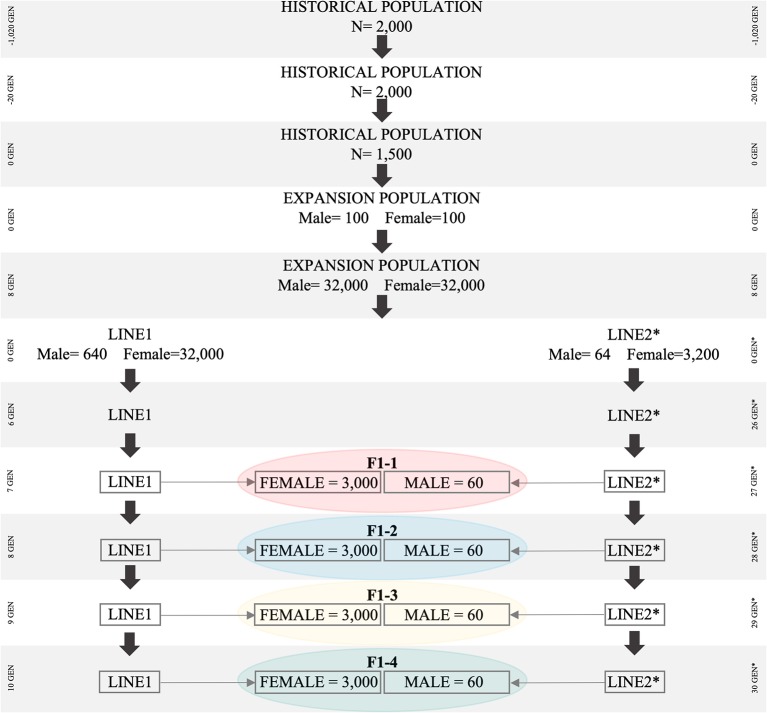
As crossbreeding is extensively used in some livestock species, we aimed to evaluate the performance of single-step GBLUP (ssGBLUP) and weighted ssGBLUP (WssGBLUP) methods to predict Genomic Estimated Breeding Values (GEBVs) of crossbred animals. Different training population scenarios were evaluated: (SC1) ssGBLUP based on a single-trait model considering purebred and crossbred animals in a joint training population; (SC2) ssGBLUP based on a multiple-trait model to enable considering phenotypes recorded in purebred and crossbred training animals as different traits; (SC3) WssGBLUP based on a single-trait model considering purebred and crossbred animals jointly in the training population (both populations were used for SNP weights' estimation); (SC4) WssGBLUP based on a single-trait model considering only purebred animals in the training population (crossbred population only used for SNP weights' estimation); (SC5) WssGBLUP based on a single-trait model and the training population characterized by purebred animals (purebred population used for SNP weights' estimation). A complex trait was simulated assuming alternative genetic architectures. Different scaling factors to blend the inverse of the genomic (G -1) and pedigree ( A 22 - 1 ) relationship matrices were also tested. The predictive performance of each scenario was evaluated based on the validation accuracy and regression coefficient. The genetic correlations across simulated populations in the different scenarios ranged from moderate to high (0.71-0.99). The scenario mimicking a completely polygenic trait ( h Q T L 2 = 0) yielded the lowest validation accuracy (0.12; for SC3 and SC4). The simulated scenarios assuming 4,500 QTLs affecting the trait and h Q T L 2 = h 2 resulted in the greatest GEBV accuracies (0.47; for SC1 and SC2). The regression coefficients ranged from 0.28 (for SC3 assuming polygenic effect) to 1.27 (for SC2 considering 4,500 QTLs). In general, SC3 and SC5 resulted in inflated GEBVs, whereas other scenarios yielded deflated GEBVs. The scaling factors used to combine G -1 and A 22 - 1 had a small influence on the validation accuracies, but a greater effect on the regression coefficients. Due to the complexity of multiple-trait models and WssGBLUP analyses, and a similar predictive performance across the methods evaluated, SC1 is recommended for genomic evaluation in crossbred populations with similar genetic structures [moderate-to-high (0.71-0.99) genetic correlations between purebred and crossbred populations].

Keywords: WssGBLUP; crossbred performance; simulated dataset; ssGBLUP; training population design.


Figures

Figure 1
Figure 1
Simulated population scheme representing bottleneck in historical population, breed differentiation, and origin of F1 for all simulated scenarios. The Bos taurus indicus population is represented by Line1, Bos taurus taurus is represented by Line2.
Figure 2
Figure 2
Principal component decomposition of the genomic relationship matrix of repetition 1 colored by breed-group. Letters represent the simulated scenarios: (A) Simulated scenario with heritability explained by the quantitative trait loci (hQTL2) equal to zero (SIM1); (B) hQTL2 equal to 1/3 of trait heritability (h2) (i.e., hQTL2 equal to 0.11), and the number of QTLs equal to 198 (SIM2); (C) hQTL2 equal to 0.11 and the number of QTLs equal to 4,500 (SIM3); (D) hQTL2 equal to trait h2 (0.33), and the number of QTLs equal to 198 (SIM4); and (E) hQTL2 equal to 0.33 and the number of QTLs equal to 4,500 (SIM5).
Figure 3
Figure 3
Consistency of gametic phase (Pearson correlations of signed r values) at given distances for three population pairs. SIM1: simulated scenario with heritability explained by the quantitative trait loci (hQTL2) equal to zero; SIM2: hQTL2 equal to 1/3 of trait heritability (h2) (i.e., hQTL2 equal to 0.11), and the number of QTLs equal to 198; SIM3: hQTL2 equal to 0.11 and the number of QTLs equal to 4,500; SIM4: hQTL2 equal to trait h2 (0.33), and the number of QTLs equal to 198; and SIM5: hQTL2 equal to 0.33 and the number of QTLs equal to 4,500.
Figure 4
Figure 4
Heatmap of accuracy (r) for all combinations of τ and ω scaling factors to blend G−1 and A22-1 matrices when building the H matrix, using the dataset from the simulated scenario with heritability explained by the quantitative trait loci (hQTL2) equal to the trait heritability (h2) of 0.33 and 4,500 QTLs.
Figure 5
Figure 5
Heatmap of regression coefficient (β1) for all combinations of τ and ω scaling factors to blend G−1 and A22-1 matrices when building the H matrix, using the dataset from the simulated scenario with heritability explained by the quantitative trait loci (hQTL2) equal to the trait heritability (h2) of 0.33 and 4,500 QTLs.
Figure 6
Figure 6
Trend line for average validation accuracy (r, A,C) and regression coefficient (β1, B,D) across all scenarios: ssGBLUP based on a single-trait model considering both purebred and crossbred animals in the training population (SC1); ssGBLUP based on a multiple-trait model to consider phenotypes recorded on purebred and crossbred training animals as different traits (SC2); WssGBLUP based on a single-trait model considering both purebred and crossbred animals in the training population (and information from both populations to estimate the SNP weights (SC3); WssGBLUP based on a single-trait model considering only purebred animals in the training population (and only the information from crossbred animals to estimate the SNP weights) (SC4); and WssGBLUP based on a single-trait model considering only purebred animals in the training population (and their information to estimate the SNP weights) (SC5); and simulated scenarios: heritability explained by the quantitative trait loci (h2QTL) equal to zero (SIM1); hQTL2 equal to 1/3 of trait heritability (h2) (i.e., hQTL2 equal to 0.11), and the number of QTLs equal to 198 (SIM2); hQTL2 equal to 0.11 and the number of QTLs equal to 4,500 (SIM3); hQTL2 equal to trait h2 (0.33), and the number of QTLs equal to 198 (SIM4); and hQTL2 equal to 0.33 and the number of QTLs equal to 4,500 (SIM5). (A,B) represent F1-3 validation population and (C,D) represent F1-4 validation population.
Figure 7
Figure 7
Average validation accuracies (rA,C,E,G,I) and regression coefficients (β1B,D,F,H,J) with, respectively standard deviations and different letters for each scenario representing significant differences (P < 0.05) for F1-3 validation population: ssGBLUP based on a single-trait model considering both purebred and crossbred animals in the training population (SC1); ssGBLUP based on a multiple-trait model to consider phenotypes recorded on purebred and crossbred training animals as different traits (SC2); WssGBLUP based on a single-trait model considering both purebred and crossbred animals in the training population (and information from both populations to estimate the SNP weights) (SC3); WssGBLUP based on a single-trait model considering only purebred animals in the training population (and only the information from crossbred animals to estimate the SNP weights) (SC4); and WssGBLUP based on a single-trait model considering only purebred animals in the training population (and their information to estimate the SNP weights) (SC5). Simulated scenarios: heritability explained by the quantitative trait loci (hQTL2) equal to zero (SIM1); hQTL2 equal to 1/3 of trait heritability (h2) (i.e., hQTL2 equal to 0.11), and the number of QTLs equal to 198 (SIM2); hQTL2 equal to 0.11 and the number of QTLs equal to 4,500 (SIM3); hQTL2 equal to trait h2 (0.33), and the number of QTLs equal to 198 (SIM4); and hQTL2 equal to 0.33 and the number of QTLs equal to 4,500 (SIM5).
Figure 8
Figure 8
Average validation accuracies (rA,C,E,G,I) and regression coefficients (β1B,D,F,H,J) with, respectively standard deviations and different letters for each scenario representing significant differences (P < 0.05) for F1-4 validation population: ssGBLUP based on a single-trait model considering both purebred and crossbred animals in the training population (SC1); ssGBLUP based on a multiple-trait model to consider phenotypes recorded on purebred and crossbred training animals as different traits (SC2); WssGBLUP based on a single-trait model considering both purebred and crossbred animals in the training population (and information from both populations to estimate the SNP weights) (SC3); WssGBLUP based on a single-trait model considering only purebred animals in the training population (and only the information from crossbred animals to estimate the SNP weights) (SC4); and WssGBLUP based on a single-trait model considering only purebred animals in the training population (and their information to estimate the SNP weights) (SC5). Simulated scenarios: heritability explained by the quantitative trait loci (hQTL2) equal to zero (SIM1); hQTL2 equal to 1/3 of trait heritability (h2) (i.e., hQTL2 equal to 0.11), and the number of QTLs equal to 198 (SIM2); hQTL2 equal to 0.11 and the number of QTLs equal to 4,500 (SIM3); hQTL2 equal to trait h2 (0.33), and the number of QTLs equal to 198 (SIM4); and hQTL2 equal to 0.33 and the number of QTLs equal to 4,500 (SIM5).

References

    1. Aguilar I., Misztal I., Johnson D. L., Legarra A., Tsuruta S., Lawlor T. J. (2010). Hot topic: a unified approach to utilize phenotypic, full pedigree, and genomic information for genetic evaluation of Holstein final score. J. Dairy Sci. 93, 743–752. 10.3168/jds.2009-2730 - DOI - PubMed
    1. Aguilar I., Misztal I., Tsuruta S., Legarra A., Wang H. (2014). PREGSF90 – POSTGSF90: computational tools for the implementation of single-step genomic selection and genome-wide association with ungenotyped individuals in BLUPF90 programs, in Proceedings, 10th World Congress of Genetics Applied to Livestock Production (Vancouver, BC: ).
    1. Ali A., Al-Tobasei R., Lourenco D., Leeds T., Kenney B., Salem M. (2019). Genome-wide association study identifies genomic loci affecting filet firmness and protein content in rainbow trout. Front. Genet. 10:386. 10.3389/fgene.2019.00386 - DOI - PMC - PubMed
    1. Bijma P., van Arendonk J. A. M. (1998). Maximizing genetic gain for the sire line of a crossbreeding scheme utilizing both purebred and crossbred information. Anim. Sci. 66, 529–542. 10.1017/S135772980000970X - DOI
    1. Bijma P., Woolliams J. A., Arendonk J. A. M. (2001). Genetic gain of pure line selection and combined crossbred purebred selection with constrained inbreeding. Anim. Sci. 72, 225–232. 10.1017/S1357729800055715 - DOI