Review
. 2020 Apr 9:10:447.
doi: 10.3389/fonc.2020.00447. eCollection 2020.

Changing Technologies of RNA Sequencing and Their Applications in Clinical Oncology

Affiliations
Review

Changing Technologies of RNA Sequencing and Their Applications in Clinical Oncology

Ye Wang et al. Front Oncol. .

Abstract

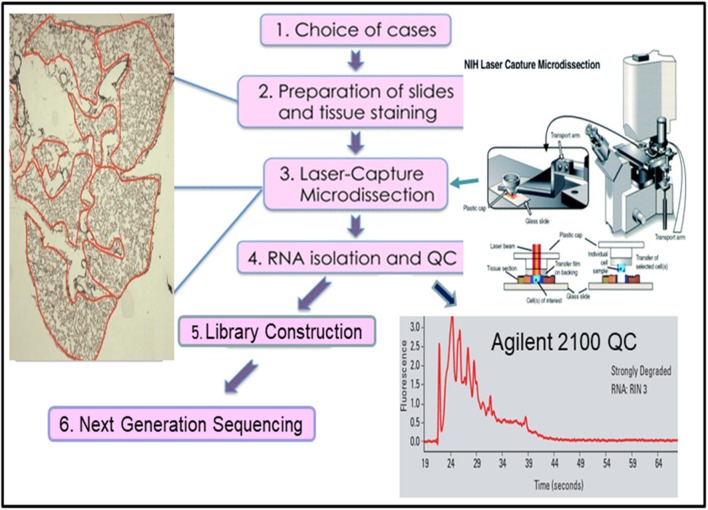
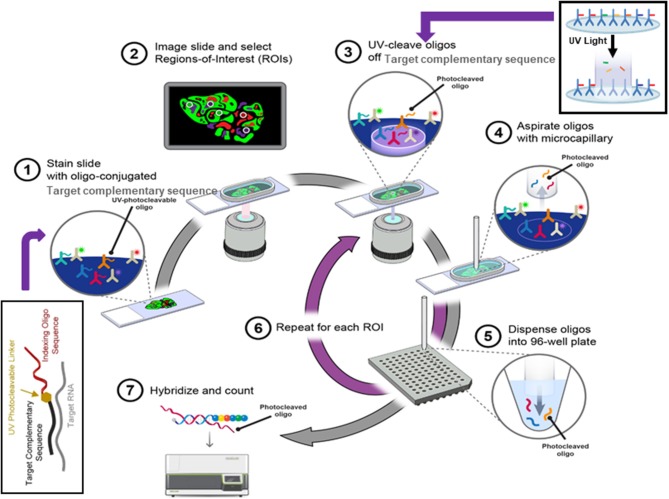
RNA sequencing (RNAseq) is one of the most commonly used techniques in life sciences, and has been widely used in cancer research, drug development, and cancer diagnosis and prognosis. Driven by various biological and technical questions, the techniques of RNAseq have progressed rapidly from bulk RNAseq, laser-captured micro-dissected RNAseq, and single-cell RNAseq to digital spatial RNA profiling, spatial transcriptomics, and direct in situ sequencing. These different technologies have their unique strengths, weaknesses, and suitable applications in the field of clinical oncology. To guide cancer researchers to select the most appropriate RNAseq technique for their biological questions, we will discuss each of these technologies, technical features, and clinical applications in cancer. We will help cancer researchers to understand the key differences of these RNAseq technologies and their optimal applications.

Keywords: LCM-RNAseq; RNA sequencing; bulk RNAseq; digital spatial profiling; fourth-generation RNAseq; next generation sequencing; single-cell RNAseq; spatial transcriptomics.


Figures

Figure 1
Figure 1
Outline of two different types of RNA sequencing. Top is for differential gene expression and bottom is for transcriptome analysis.
Figure 2
Figure 2
The workflow of laser capture micro-dissected RNA sequencing.
Figure 3
Figure 3
The single cell RNASeq. (1) The dissociation of tissue cells and removal of dead cells and cell debris, (2) Viable cells are resuspended in the desired buffer at a correct concentration. (3) Cell suspension is combined with RT reagents and, along with gel beads and immersion oil, introduced into Chromium Controller chip. (4) Microfluidics chip generates single cell GEMs, a gel bead bound to a cell's RNA molecules. (4.5) Gel beads and cell suspension, in RT mix, are pushed into the immersion oil. (5) GEMs are transferred into PCR tubes and undergo RT-PCR to produce cDNA. (6) The cDNA, suspended in oil, is released from GEMs, removed from oil, and amplified via PCR. (7) Libraries are completed by fragmenting the cDNA to proper insert size, followed by end repair, A-tailing, and ligation of Illumina read 2 index, all occurring in a single PCR step. (8) Sample-specific index are added and the sequence-ready libraries are sequenced by using Illumina sequencer (NextSeq 500, HiSeq3000/4000 or NovaSeq6000). (9) The 10x single cell data analysis pipeline employs Cell Ranger to align reads and perform cluster and gene expression analysis, followed by Cell Loupe Browser to visualize and analyze the Cell Ranger data output.
Figure 4
Figure 4
The digital spatial profiling. (1) Apply high-plex oligo-labeled probes to FFPE slide. (2) Use visible wavelength low-plex imaging to establish tissue “geography.” Select regions-of-interest (ROIs) for high-plex profiling. (3) UV-release oligo tags at selected ROIs. (4, 5) Collect and dispense released tags in microtiter plate. (6) Repeat the procedures for each ROI. (7) Index, hybridize, and count the tags per ROI and analyze the data with nSolver™ Advanced Analysis Software.
Figure 5
Figure 5
The spatial transcriptomes. (1) A freshly frozen tissue section is prepared and attached onto the chip. (2) The chip contains an array of distinguishable capture probes. The Poly-T tails of these capture probes can bind the Poly-A tails of RNA molecules. (3) The tissue section is fixed and imaged, which makes it possible to overlay the cell tissue image and the gene expression data in a later step. (4) The tissue is permeabilized and RNA molecules can exit the cells through small holes created in the cell membrane, and bind to the adjacent capture probes on the chip. (5) cDNA synthesis is performed on the chip. (6) The cDNA-RNA-hybrids are cleaved off the chip, followed by library construction. (7) The libraries are sequenced. (8) Data are visualized to determine where genes are expressed and in what quantity.

References

    1. Emrich SJ, Barbazuk WB, Li L, Schnable PS. Gene discovery and annotation using LCM-454 transcriptome sequencing. Genome Res. (2007) 17:69–73. 10.1101/gr.5145806 - DOI - PMC - PubMed
    1. Stark R, Grzelak M, Hadfield J. RNA sequencing: the teenage years. Nat Rev Genet. (2019) 20:631–56. 10.1038/s41576-019-0150-2 - DOI - PubMed
    1. Wang Z, Gerstein M, Snyder M. RNA-Seq: a revolutionary tool for transcriptomics. Nat Rev Genet. (2009) 10:57–63. 10.1038/nrg2484 - DOI - PMC - PubMed
    1. Ozsolak F, Milos PM. RNA sequencing: advances, challenges and opportunities. Nat Rev Genet. (2011) 12:87–98. 10.1038/nrg2934 - DOI - PMC - PubMed
    1. Buzdin A, Sorokin M, Garazha A, Glusker A, Aleshin A, Poddubskaya E, et al. RNA sequencing for research and diagnostics in clinical oncology. Semin Cancer Biol. (2019) 60:311–23. 10.1016/j.semcancer.2019.07.010 - DOI - PubMed

LinkOut - more resources