

Real-life insights on menstrual cycles and ovulation using big data
- PMID: 32328534
- PMCID: PMC7164578
- DOI: 10.1093/hropen/hoaa011
Real-life insights on menstrual cycles and ovulation using big data
Abstract
Study question: What variations underlie the menstrual cycle length and ovulation day of women trying to conceive?
Summary answer: Big data from a connected ovulation test revealed the extent of variation in menstrual cycle length and ovulation day in women trying to conceive.
What is known already: Timing intercourse to coincide with the fertile period of a woman maximises the chances of conception. The day of ovulation varies on an inter- and intra-individual level.
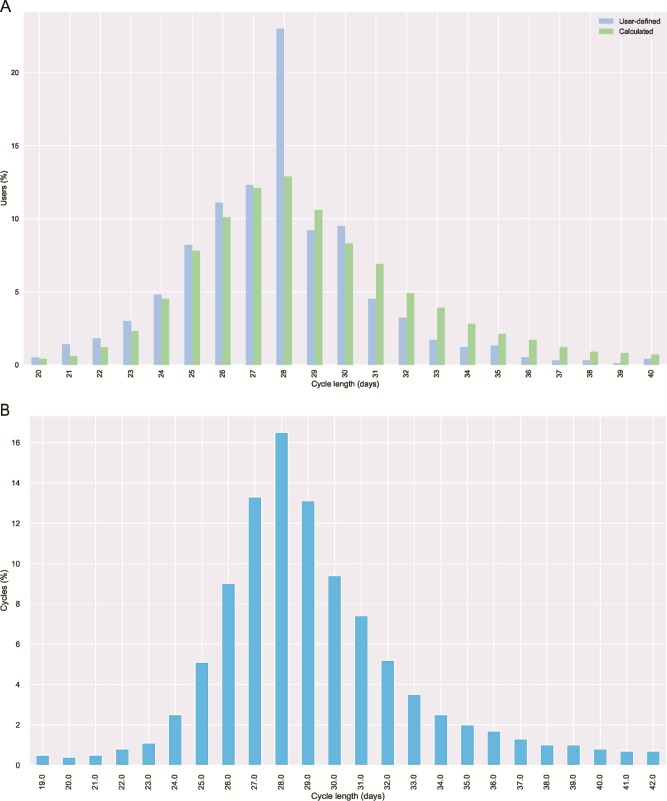
Study design size duration: A total of 32 595 women who had purchased a connected ovulation test system contributed 75 981 cycles for analysis. Day of ovulation was determined from the fertility test results. The connected home ovulation test system enables users to identify their fertile phase. The app benefits users by enabling them to understand their personal fertility information. During each menstrual cycle, users input their perceived cycle length into an accessory application, and data on hormone levels from the tests are uploaded to the application and stored in an anonymised cloud database. This study compared users' perceived cycle characteristics with actual cycle characteristics. The perceived and actual cycle length information was analysed to provide population ranges.
Participants/materials setting methods: This study analysed data from the at-home use of a commercially available connected home ovulation test by women across the USA and UK.
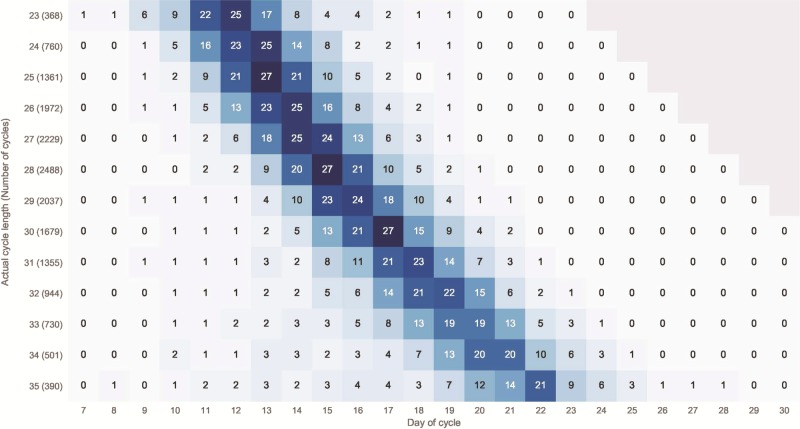
Main results and the role of chance: Overall, 25.3% of users selected a 28-day cycle as their perceived cycle length; however, only 12.4% of users actually had a 28-day cycle. Most women (87%) had actual menstrual cycle lengths between 23 and 35 days, with a normal distribution centred on day 28, and over half of the users (52%) had cycles that varied by 5 days or more. There was a 10-day spread of observed ovulation days for a 28-day cycle, with the most common day of ovulation being Day 15. Similar variation was observed for all cycle lengths examined. For users who conducted a test on every day requested by the app, a luteinising hormone (LH) surge was detected in 97.9% of cycles.
Limitations reasons for caution: Data were from a self-selected population of women who were prepared to purchase a commercially available product to aid conception and so may not fully represent the wider population. No corresponding demographic data were collected with the cycle information.
Wider implications of the findings: Using big data has provided more personalised insights into women's fertility; this could enable women trying to conceive to better time intercourse, increasing the likelihood of conception.
Study funding/competing interests: The study was funded by SPD Development Company Ltd (Bedford, UK), a fully owned subsidiary of SPD Swiss Precision Diagnostics GmbH (Geneva, Switzerland). I.S., B.G. and S.J. are employees of the SPD Development Company Ltd.
Keywords: connected ovulation test systems; menstrual cycle; menstrual cycle length; menstrual cycle variability; ovulation.
© The Author(s) 2020. Published by Oxford University Press on behalf of the European Society of Human Reproduction and Embryology.
Figures
References
-
- Behre HM, Kuhlage J, Gassner C, Sonntag B, Schem C, Schneider HP, Nieschlag E. Prediction of ovulation by urinary hormone measurements with the home use ClearPlan fertility monitor: comparison with transvaginal ultrasound scans and serum hormone measurements. Hum Reprod 2000;15:2478–2482. - PubMed
-
- Brezina PR, Haberl E, Wallach E. At home testing: optimizing management for the infertility physician. Fertil Steril 2011;95:1867–1878. - PubMed
-
- Chiazze LBFJ, Macisco JJ Jr, Parker MP, Duffy BJ. The length and variability of the human menstrual cycle. JAMA 1968;377–380. - PubMed
-
- Fertility Fairness What is ‘Infertility’? Available at: https://www.fertilityfairness.co.uk/nhs-fertility-services/what-is-infer... (10 January 2020, date last accessed).
LinkOut - more resources
Full Text Sources
Research Materials