. 2020 Apr 6;219(4):e201910084.
doi: 10.1083/jcb.201910084.

Asymmetric assembly of centromeres epigenetically regulates stem cell fate

Affiliations

Asymmetric assembly of centromeres epigenetically regulates stem cell fate

Anna Ada Dattoli et al. J Cell Biol. .

Abstract

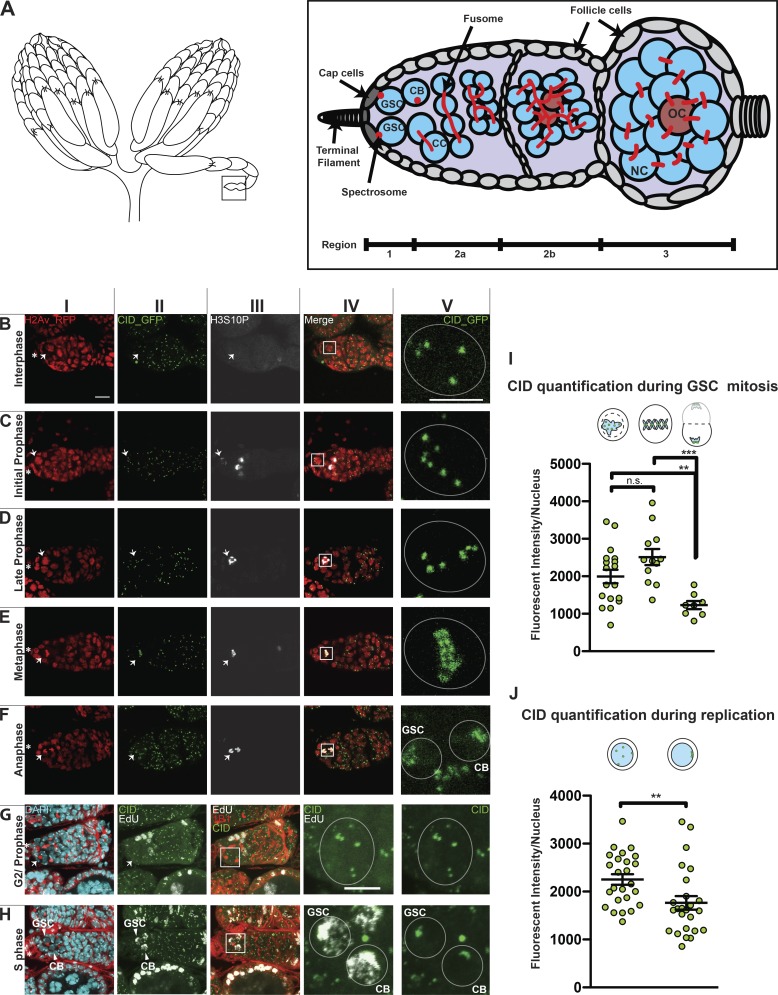
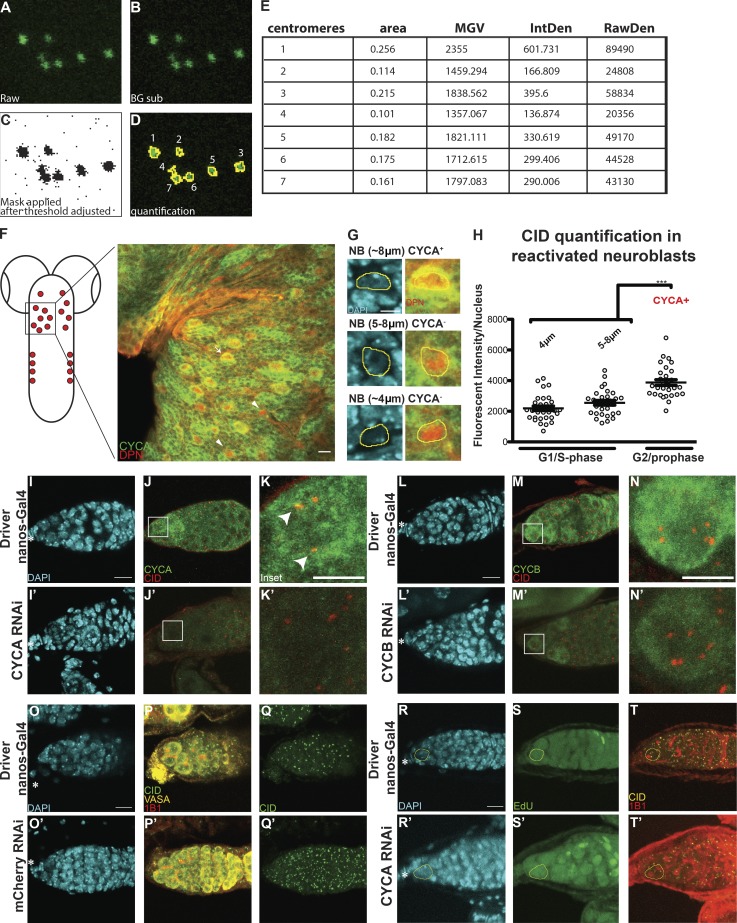
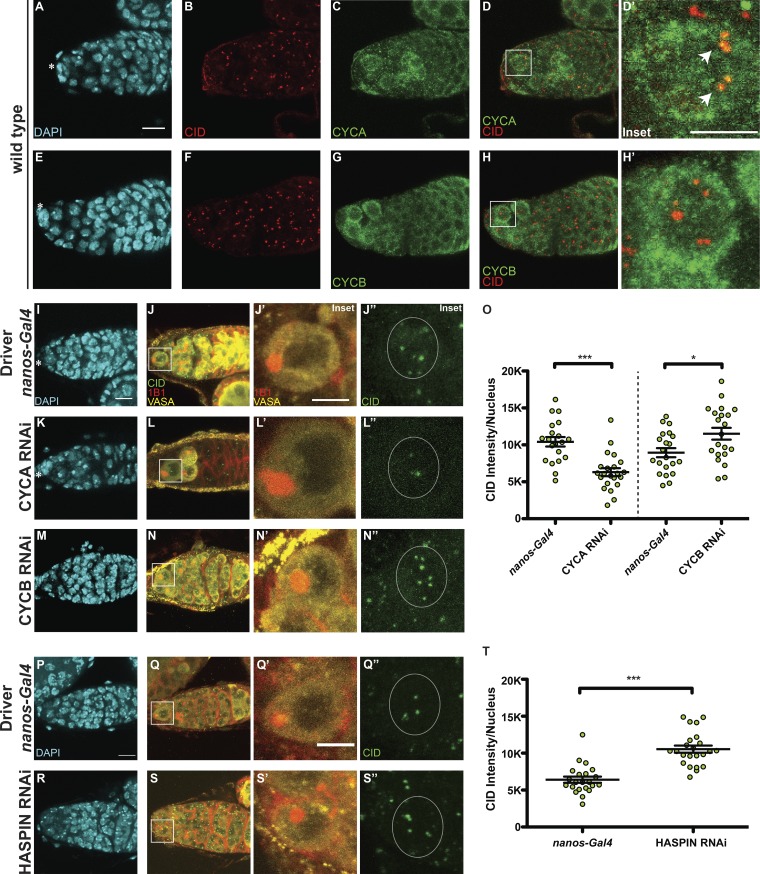
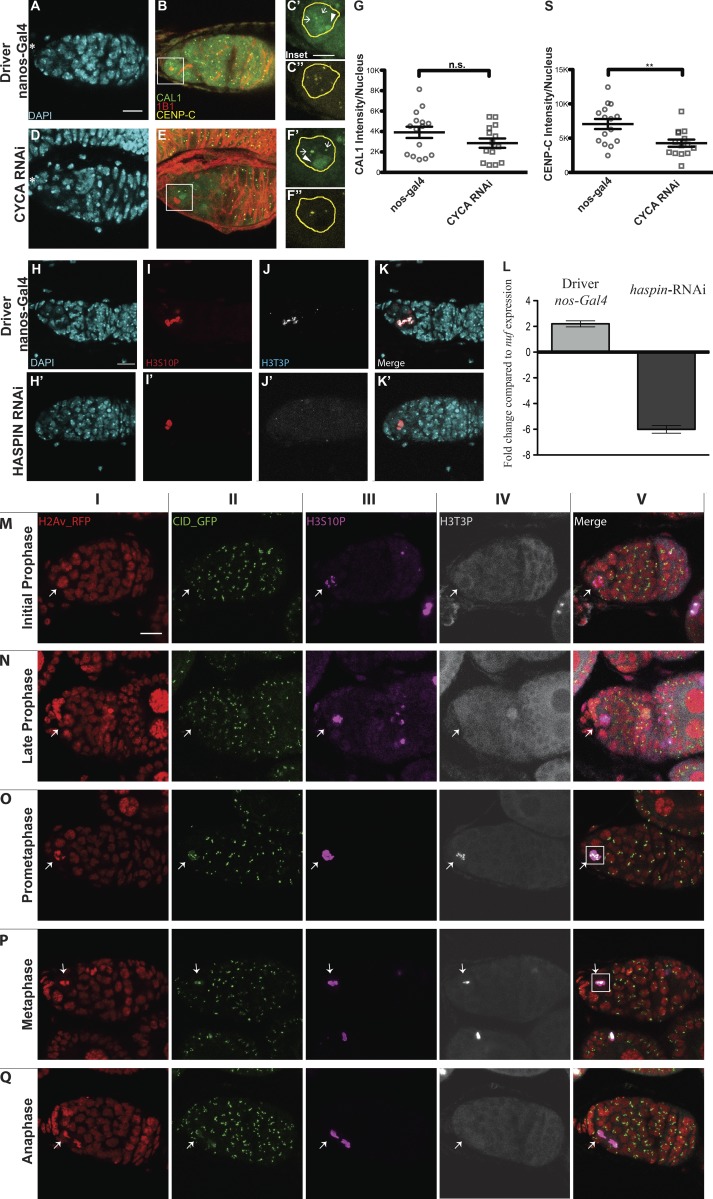
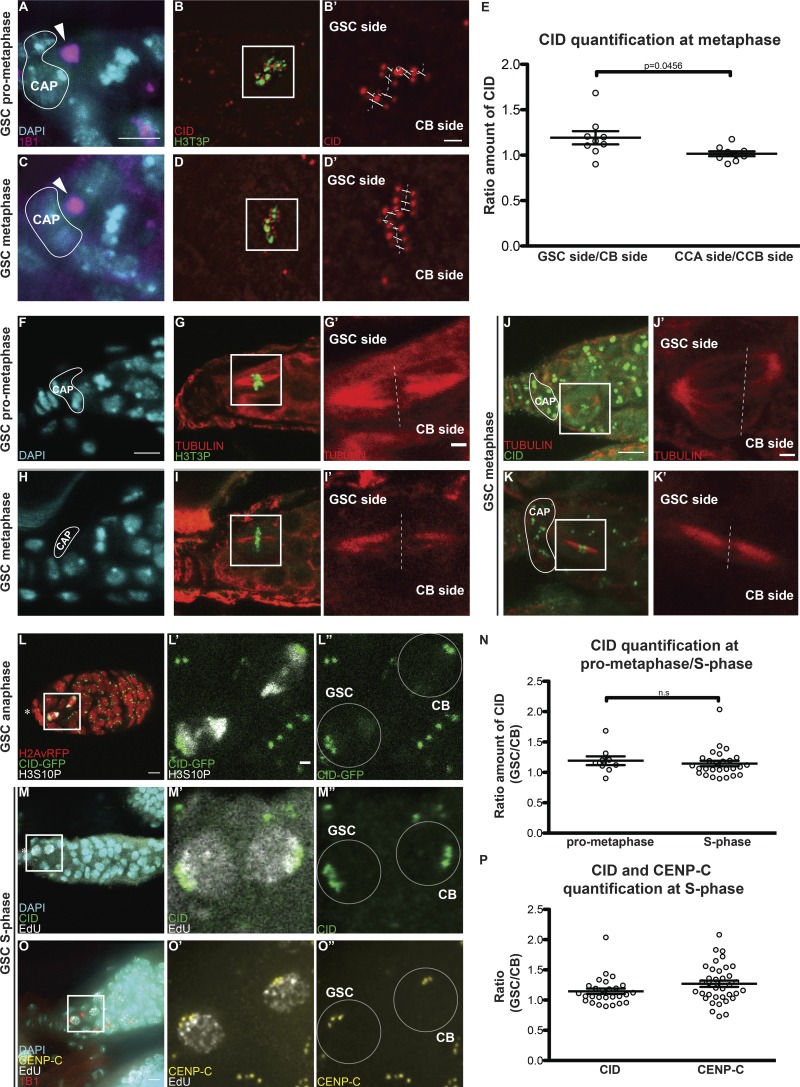
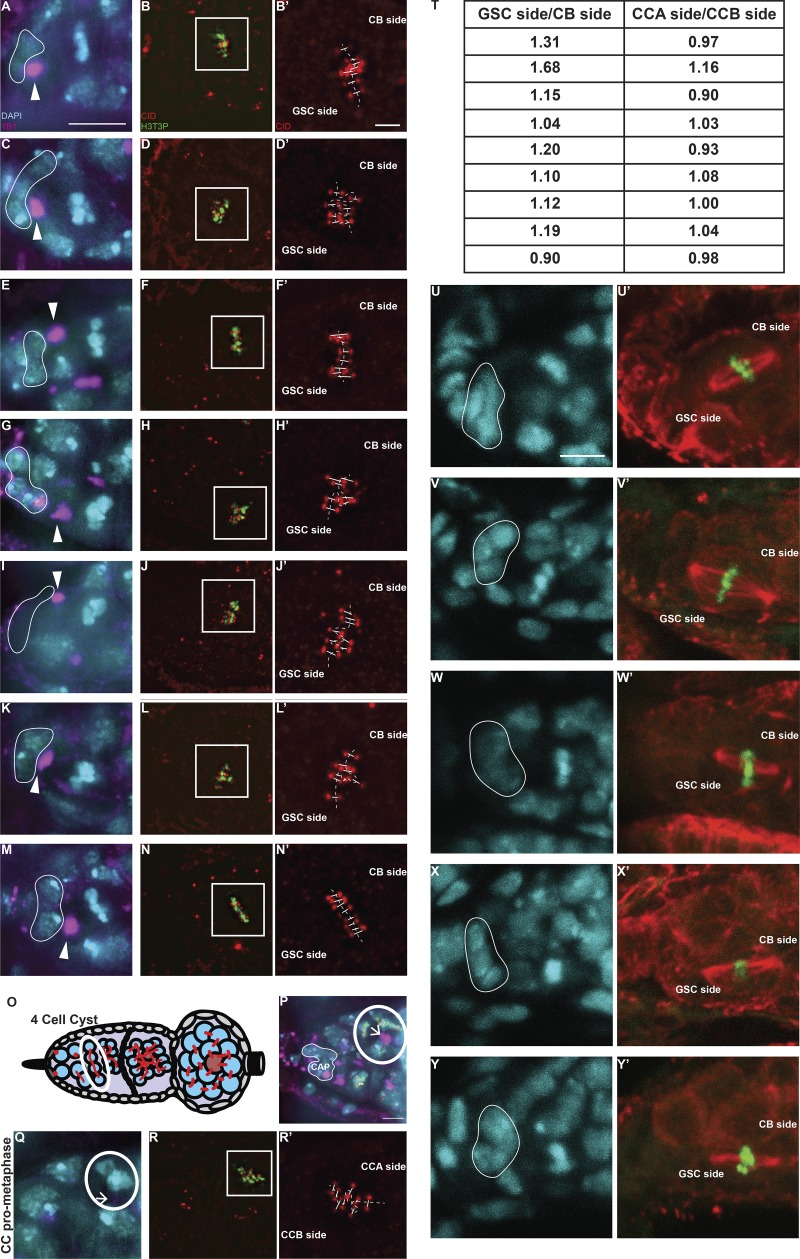
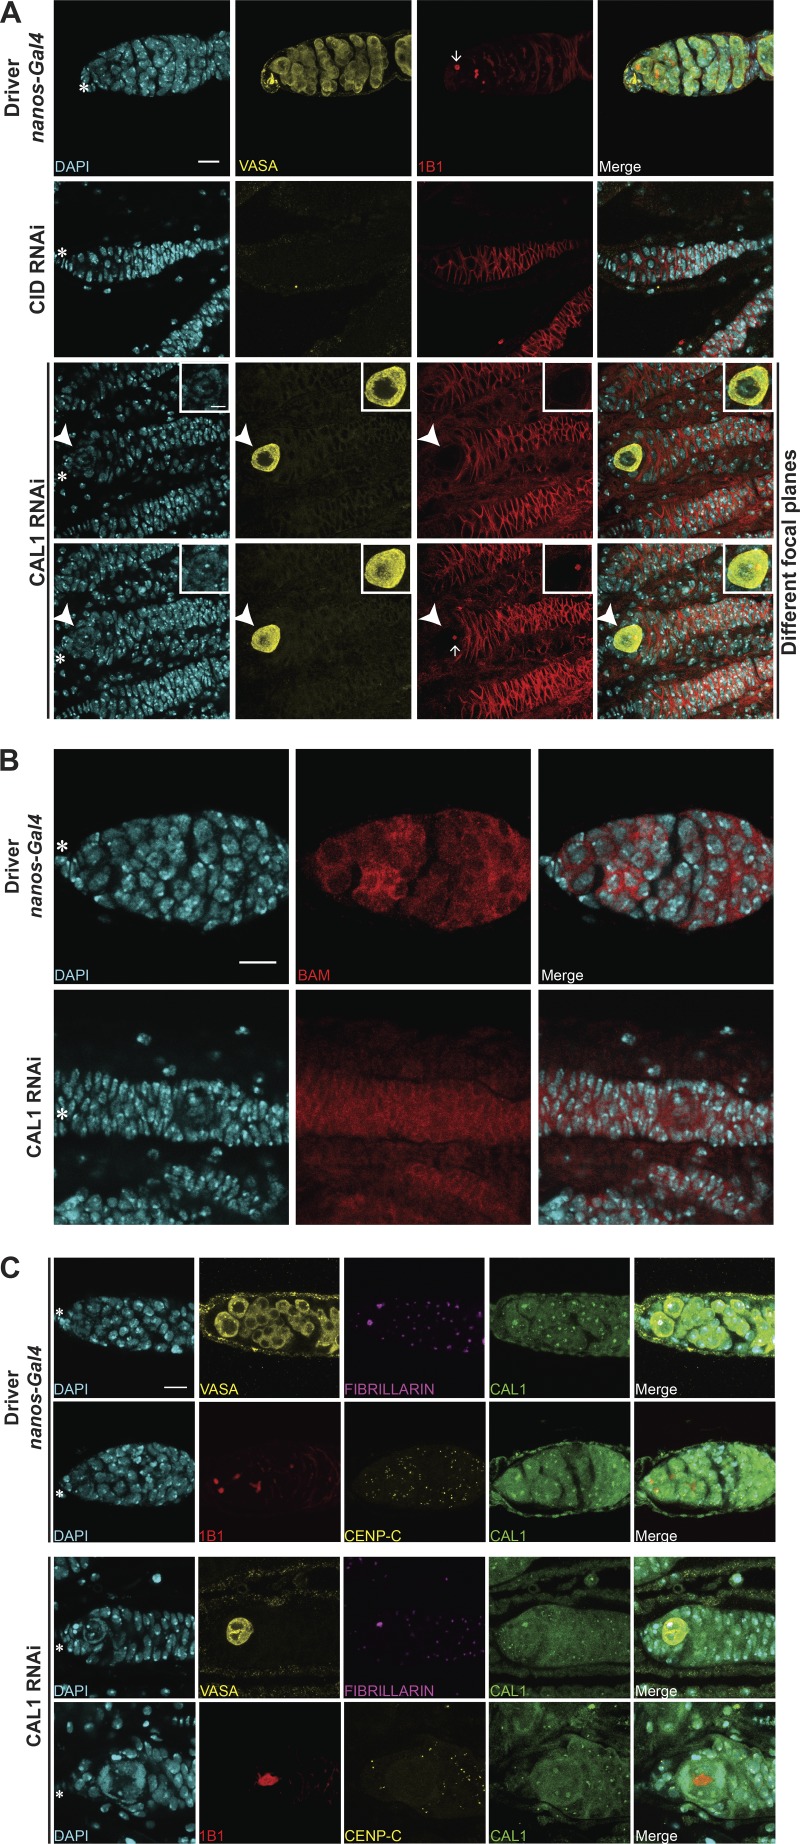
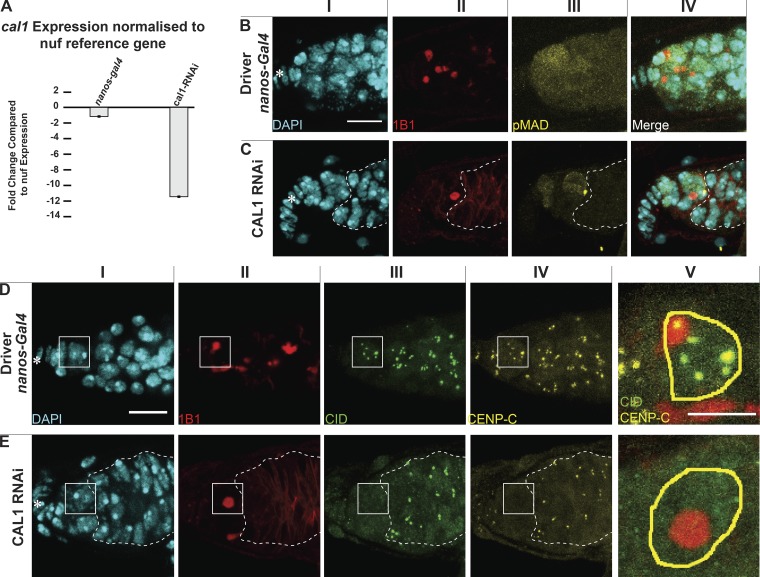
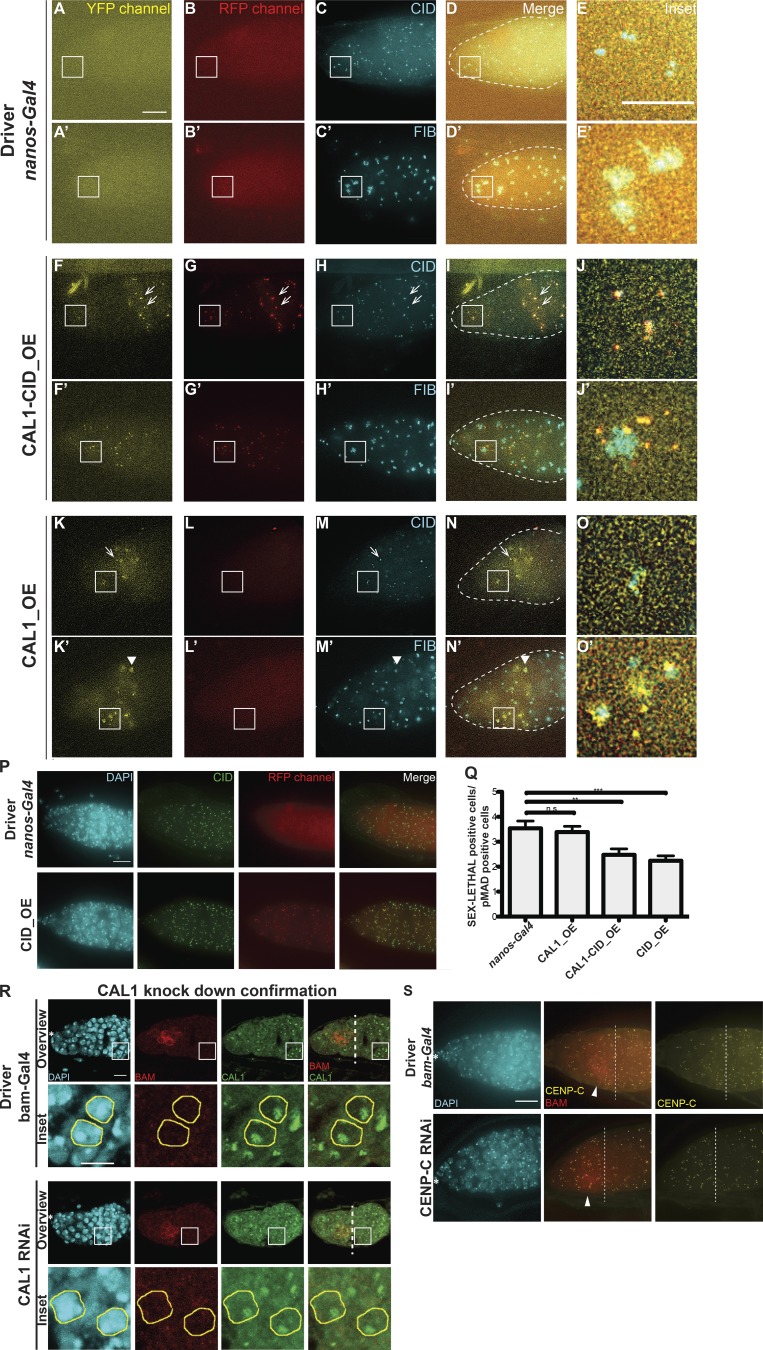
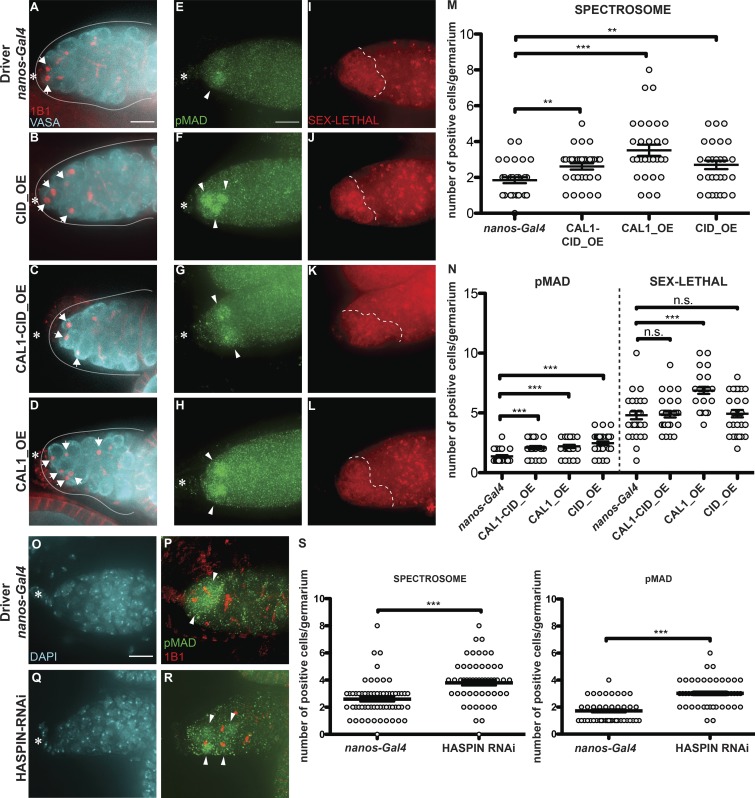
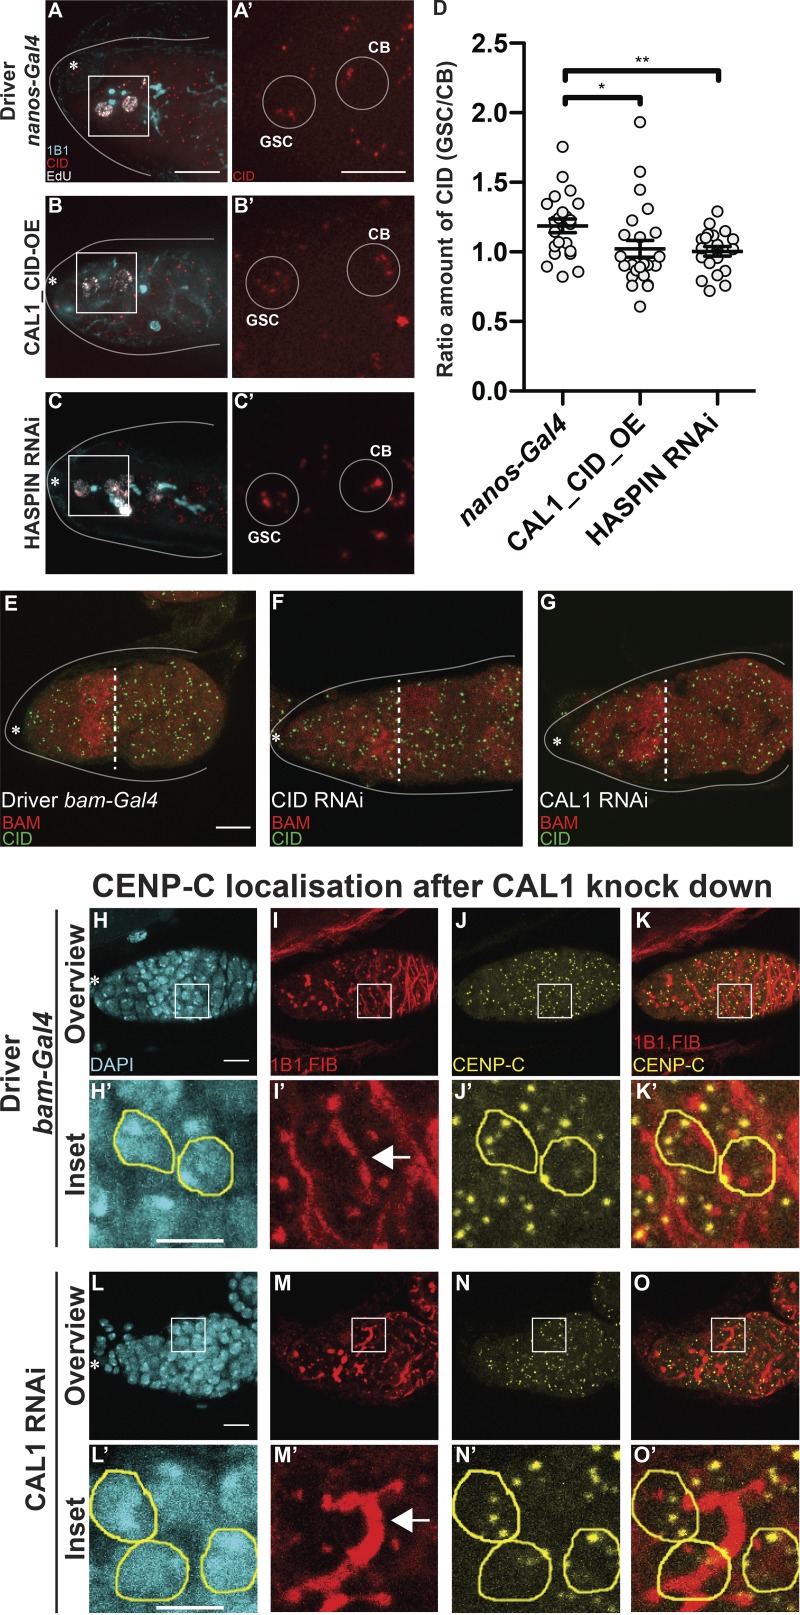
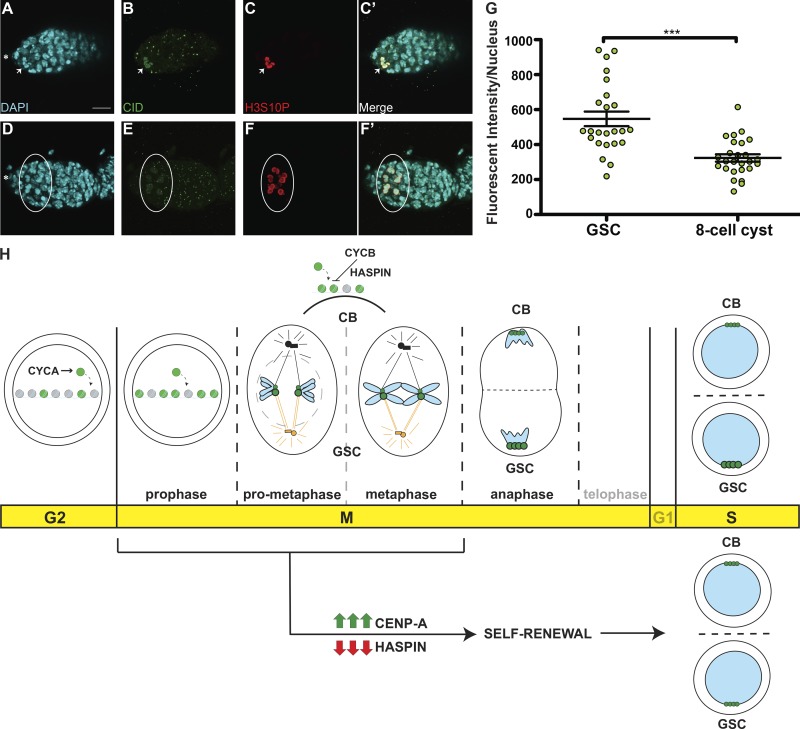
Centromeres are epigenetically defined by CENP-A-containing chromatin and are essential for cell division. Previous studies suggest asymmetric inheritance of centromeric proteins upon stem cell division; however, the mechanism and implications of selective chromosome segregation remain unexplored. We show that Drosophila female germline stem cells (GSCs) and neuroblasts assemble centromeres after replication and before segregation. Specifically, CENP-A deposition is promoted by CYCLIN A, while excessive CENP-A deposition is prevented by CYCLIN B, through the HASPIN kinase. Furthermore, chromosomes inherited by GSCs incorporate more CENP-A, making stronger kinetochores that capture more spindle microtubules and bias segregation. Importantly, symmetric incorporation of CENP-A on sister chromatids via HASPIN knockdown or overexpression of CENP-A, either alone or together with its assembly factor CAL1, drives stem cell self-renewal. Finally, continued CENP-A assembly in differentiated cells is nonessential for egg development. Our work shows that centromere assembly epigenetically drives GSC maintenance and occurs before oocyte meiosis.


Figures

Figure 1.
Figure 1.
Centromere assembly in GSCs occurs after replication but before chromosome segregation. (A) Diagram of Drosophila ovary (left) and germarium containing the germline stem cell (GSC) niche (right). NC, nurse cell; OC, oocyte; CB, cystoblast; CC, cystocyte. The spectrosome (red) connects GSCs to the cap cells (dark gray). (B–F) Confocal z-stack projection of a germarium expressing H2Av-RFP (red; I) and CID-GFP (green; II) and stained for H3S10P (white; III) showing centromere localization in GSC nuclei throughout the cell cycle; inset (V) marked by box in merged image (IV). Interphase (B), initial and late prophase (C and D), metaphase (E), anaphase (F). (G and H) Wild type germarium stained for DAPI (cyan), EdU (white), anti-CID (green), and anti-1B1 (red); G2/prophase GSCs (G) and EdU-positive (S phase) GSC and CB (H). (I and J) Quantification of CID-GFP fluorescence intensity observed at centromeres at prophase, metaphase, and anaphase (I) or antibody staining at replication and G2/prophase (J). Star indicates the terminal filament; arrows indicate GSCs; arrowheads indicate GSC and CB; <1-d-old heterozygous CID-GFP/H2Av-RFP and wild-type females; scale bar 10 µm (I–IV) or 5 µm (V). Cartoons indicate the cell cycle phase. Fluorescence Intensity is expressed as integrated density after background subtraction (see Materials and methods); data are represented as the mean ± SEM; **, P < 0.005; ***, P < 0.0005, n.s., not significant; calculated with unpaired t test with Welch’s correction.
Figure S1.
Figure S1.
Centromere assembly occurs after replication but before chromosome segregation. (A–E) Example image used for quantification (from Fig. 1 C, not oriented; see Materials and methods). (F) Diagram of Drosophila larval brain containing NBs (red) and confocal z-stack projection of a section of the tVNC stained with for DAPI (cyan), anti-CYCA (green), anti-DPN (red), and anti-CID (not depicted). (G) NBs in the tVNC are present in different sizes. (H) Quantification of fluorescence intensity of CID at centromeres in CYCA-negative and -positive NBs. Fluorescence intensity is expressed as integrated density after background subtraction (see Materials and methods); ***, P < 0.0005. (I–N′) Confocal z-stack projection of a nanos-Gal4 (I–N), CYCA RNAi (I′–K′), and CYCB RNAi (L–N′) germarium at 25°C, stained for DAPI (blue), anti-CID (red), and anti-CYCA and or CYC B (green). (O–Q′) Confocal z-stack projection of a nanos-Gal4 (O–Q), mCherry RNAi (O′–Q′) germarium. (R–T′) Confocal z-stack projection of a nanos-Gal4 (R–T), CYCA RNAi (R′–T′) germarium stained for DAPI (cyan), EdU (green), anti-CID (yellow), and anti-1B1 (spectrosome, red). Scale bar, 10 µm; inset, 5 µm.
Figure 2.
Figure 2.
CID deposition in GSCs requires CYCA, CYCB, and HASPIN. (A–H) Wild-type germaria stained for DAPI (cyan), anti-CID (red), and anti-CYCA or anti-CYCB (green). (I–N″) Confocal z-stack projection of nanos-Gal4 (I–J″), CYCA RNAi (K–L″), CYCB RNAi (M–N″) germaria, stained for DAPI (cyan), anti-VASA (yellow), anti-CID (green), and anti-1B1 (spectrosome, red). (O) Quantification of CID fluorescence intensity at centromeres per nucleus (L). (P–S″) Confocal z-stack projection of nanos-Gal4 (P–Q″) and HASPIN RNAi germaria (R–S″), stained for DAPI (cyan), anti-VASA (yellow), anti-CID (green), and anti-1B1 (spectrosome, red). (T) Quantification of CID fluorescence intensity (MGVs) at centromeres per nucleus. Data are represented as the mean ± SEM; ***, P < 0.0005; *, P < 0.05, calculated with unpaired t test with Welch’s correction. Star indicates the terminal filament and arrows indicate centromeres; 3-d-old female flies; scale bar, 10 µm; inset, 5 µm.
Figure S2.
Figure S2.
CID deposition requires CYCA, CYCB, and HASPIN in Drosophila female GSCs. (A–F″) Confocal z-stack projection of nanos-Gal4 (A–C″), CYCA RNAi (D–F″) germaria stained for DAPI (blue), anti-CAL1 (green), anti-CENP-C (yellow), and anti-1B1 (spectrosome, red). (G) Quantification of fluorescence intensity of centromeric CAL1 per nucleus, using CENP-C as a centromeric marker based on two biological replicates. n.s., not significant. (S) Quantification of fluorescence intensity of CENP-C per nucleus, based on two biological replicates; **, P < 0.005. (H–K′) Confocal z-stack projection of nanos-Gal4 (H–K), HASPIN RNAi (H′–K′) germaria, stained for DAPI (blue), anti-H3S10P (red), and anti-H3T3P (gray). (L) HASPIN knockdown confirmation by real-time qPCR. (M–Q) Time course of the H3T3P (white) and H3S10P (magenta) signal appearance. Scale bar, 10 µm; inset, 5 µm.
Figure 3.
Figure 3.
Sister chromatids of GSCs and CBs retain differential amounts of CID and CENP-C. (A–D′) Superresolution (N-SIM) z-stack projection of a GSC at prometaphase (A–B′) and metaphase (C–D′) stained for DAPI (cyan), anti-1B1 (spectrosome, magenta), anti-CID (red), and anti-H3T3P (green). (E) Ratio of the total amount of CID detected on the chromosomes of the GSC side and the total amount of CID detected on the chromosomes of the CB side, and similarly for the control CCA and CCB sides of cyst cells (CC). (F–I′) Confocal z-stack projection of a GSC at prometaphase (F–G′) and metaphase (H–I′) stained for DAPI (cyan), anti-TUBULIN (red), and anti-H3T3P (green). (J–K′) Confocal z-stack projection of a GSC at metaphase stained for anti-TUBULIN (red), anti-CID (green). (L–L″) Confocal z-stack projection of a H2Av-RFP/CID-GFP germarium, capturing a GSC and CB at anaphase. (M–M″) Confocal z-stack projection capturing a GSC and CB at S phase stained for DAPI (cyan), EdU (white), and anti-CID (green). (N) Comparison of the ratio of the total amount of CID detected on the chromosomes of the GSC side and the total amount of CID detected on the chromosomes of the CB side at prometaphase, and the amount of CID detected between GSCs and CBs at S phase. (O–O″) Confocal z-stack projection of a GSC and CB at S phase stained for DAPI (cyan), EdU (white), and anti-CENP-C (yellow). (P) Comparison of the ratio of CID and CENP-C between GSCs and CBs at S phase. White line, cap cells; arrowheads, spectrosome. Data are represented as the mean ± SEM; P value in E calculated through the use of different tests: unpaired t test with Welch’s correction (plotted); Mann–Whitney U test P value = 0.0244; Wilcoxon matched-pairs signed rank test P value = 0.0195; n.s., not significant. In A–L″, 30-min-old female flies; in N–O″, <1-d-old female flies; scale bar, 5 µm; inset, 1 µm.
Figure S3.
Figure S3.
Chromosomes retain differential amounts of CID and CENP-C upon centromere assembly in Drosophila female GSCs. (A–N′) Superresolution SIM z-stack projection of a Drosophila GSC of a wild-type germarium in prometaphase and metaphase, stained for DAPI (blue), anti-CID (red), anti-H3T3P (green), and anti-SPECTROSOME (magenta). (O) Diagram of Drosophila germarium, highlighting the four-cell cyst stage containing four CCs. (P) Superresolution SIM z-stack projection of a germarium capturing four CCs in prometaphase/metaphase, which divide synchronously. (Q–R′) Superresolution SIM z-stack projection of a CC at prometaphase. (T) Table of the ratio values obtained for each cell analyzed. (U–Y′) Confocal z-stack projection of a GSC of a wild-type germarium in prometaphase and metaphase, stained for DAPI (cyan), anti-TUBULIN (red), and anti-H3T3P (green). White line highlights the cap cells; arrowheads, spectrosome; arrows, fusome (not yet visible in the z-stacks projected); scale bar, 5 µm; inset, 1 µm.
Figure S4.
Figure S4.
CAL1 knockdown blocks cell proliferation. (A) Confocal z-stack projection of nanos-Gal4, CID RNAi, and CAL1 RNAi germaria, stained for DAPI (blue), anti-VASA (yellow), and anti-1B1 (spectrosome, red). (B) Confocal z-stack projection of bam-Gal4, CID RNAi, and CAL1 RNAi germaria, stained for DAPI (blue) and anti-BAM (red). (C) Confocal z-stack projection of a nanos-Gal4 (20°C) germarium stained for DAPI (blue) and anti-VASA (yellow), anti-FIBRILLARIN (magenta), and anti-CAL1 (green) and stained for DAPI (blue), anti-1B1 (red), anti-CENP-C (yellow), and anti-CAL1 (green). Confocal z-stack projection of a CAL1 RNAi (20°C) stained for DAPI (blue), anti-VASA (yellow), anti-FIBRILLARIN (magenta), and anti-CAL1 (green) and stained for DAPI (blue), anti-1B1 (red), anti-CENP-C (yellow), and anti-CAL1 (green). Star indicates the position of the terminal filament; 3-d-old female flies; scale bar, 10 µm.
Figure 4.
Figure 4.
CAL1 knockdown blocks cell proliferation. (A) CAL1 knockdown confirmation by real time qPCR. (B and C) Confocal z-stack projection of nanos-Gal4 (B) and CAL1 RNAi (C) germaria, stained for DAPI (cyan), anti-1B1 (spectrosome, red), and anti-pMAD (labels GSCs, yellow). (D and E) Confocal z-stack projection of nanos-Gal4 (D) and CAL1 RNAi germaria (E), stained for DAPI (cyan), anti-1B1 (spectrosome, red), anti-CID (green), and anti-CENP-C (yellow). Star indicates the terminal filament; dotted lines represent follicle cells; 3-d-old female flies; scale bar, 10 µm; DV and EV, 5 µm.
Figure S5.
Figure S5.
CID and CAL1 overexpression and HASPIN knockdown promote stem cell self-renewal. (A–O′) Wide-field z-stack projection of nanos-Gal4, UAS_CAL1-YFP_UAS_CID-mCherry (CID-CAL1_OE), and UAS-CAL1-YFP (CAL1_OE) germaria, stained for anti-CID and or anti-FIB (cyan). Star, terminal filament; arrows, centromeres; arrowheads, nucleolus; 3-d-old female flies. (P) Wide-field z-stack projection of nanos-Gal4 and UAS_CID-mCherry germaria stained for DAPI (cyan) and anti-CID (green). (Q) Ratio of the number of SXL-positive cells to the number of pMAD-positive cells. n.s., not significant; **, P < 0.005; ***, P < 0.0005. (R) Confocal z-stack projection bam-Gal4 and CAL1 RNAi germaria stained for DAPI (blue), anti-BAM (red) and anti-CAL1 (green). Germ cells belonging to the 16-cell cyst chamber were selected based on the VASA marker (not depicted) and the lack of BAM signal in the control and in the CAL1 RNAi. (S) Confocal z-stack projection of bam-Gal4 and CENP-C RNAi germaria, stained for DAPI (blue), anti-BAM (red), and anti-CENP-C (yellow). Star, terminal filament; white dotted line in R and S, the end of the BAM-positive region; arrowheads, BAM-positive cells. Scale bar, 10 µm; inset, 5 µm.
Figure 5.
Figure 5.
CID and CAL1 overexpression and HASPIN knockdown promote stem cell self-renewal. (A–D) Wide-field z-stack projection of nanos-Gal4 (A), UAS_ CID-mCherry (CID_OE; B) UAS_CAL1-YFP_UAS_CID-mCherry (CAL1-CID_OE; C), and UAS_CAL1-YFP (CAL1_OE; D) germaria, stained for VASA (cyan) and anti-1B1 (spectrosome, red). (E–L) Confocal z-stack projection of nanos-Gal4 (E and I), CID_OE (F and J), CAL1-CID_OE (G and K), and CAL1_OE (H and L) germaria, stained for anti-pMAD (green) and anti-SXL (red). (M) Spectrosome quantification. (N) pMAD and SXL quantification. (O–R) Wide-field z-stack projection of nanos-Gal4 (O and P) and HASPIN RNAi (Q and R) germaria stained for DAPI (cyan), anti-pMAD (green), and anti-1B1 (spectrosome red). (S) Spectrosome (left) and pMAD (right) quantitation in nanos-Gal4 and HASPIN RNAi. Data are represented as the mean ± SEM; ***, P < 0.0005; **, P < 0.005, n.s., not significant; calculated with unpaired t test with Welch’s correction. Star, terminal filament; arrows, spectrosome; arrowheads, pMAD-positive cells; dotted line, SXL regions; solid line, germarium; 3-d-old female flies; scale bar, 10 µm.
Figure 6.
Figure 6.
GSC self-renewal disrupts CID asymmetric inheritance. (A–C′) Wide-field z-stack projection of nanos-Gal4 (A and A′), CAL1-CID_OE (B and B′), and HASPIN RNAi (C and C′) germaria stained for 1B1 (spectrosome, cyan), EdU (white), anti-CID (red). (D) Ratio of the total amount of CID detected in the GSC and the total amount of CID detected in the CB at S phase. (E–G) Confocal z-stack projection of bam-Gal4 (E), CID RNAi (F), and CAL1 RNAi (G) germaria, stained for anti-BAM (red) and anti-CID (green). (H–O′) Confocal z-stack projection of bam-Gal4 (H–K′) and CAL1 RNAi (L–O′) germaria, stained for DAPI (blue), anti-1B1 (red), anti-FIBRILLARIN (red), and anti-CENP-C (yellow). 16-cell cysts were selected based on the fusome morphology (arrow) in the control (H′–K′) and in the CAL1 RNAi (L′–O′). Data are represented as the mean ± SEM; *, P < 0.05; **, P < 0.005, calculated with unpaired t test with Welch’s correction. Star, terminal filament; dotted line, end of the BAM-positive region; arrow, fusome; solid line, germarium; 3-d-old female flies; scale bar, 10 µm; inset, 5 µm.
Figure 7.
Figure 7.
Cyst cells incorporate less CID compared with GSCs. (A–F′) Confocal z-stack projection of a nanos-Gal4 germarium, stained for DAPI (cyan), anti-CID (green), and anti-H3S10P (red), to highlight a GSC (A–C′, arrow) and eight-cell cysts (D–F′, circle) in prophase. (G) Quantification of CID fluorescence intensity (integrated density) at centromeres in GSCs and eight-cell cysts at prophase obtained using wide-field microscopy. Data are represented as the mean ± SEM; ***, P < 0.0001. Star, terminal filament; 3-d-old female flies; scale bar, 10 µm. (H) Model for centromere assembly during the cell cycle. After replication, at early G2 phase, centromere assembly starts, promoted by CYCA, and centromeric nucleosomes (green) replace canonical nucleosomes (gray). This process continues until at least prophase. Excessive CID deposition is prevented by CYCB through HASPIN. At prometaphase, microtubules from centrosomes attach to centromeres through the kinetochore. At this point, sister chromatid pairs are loaded with differential amounts of CID (green) and CENP-C (not depicted) at centromeres. Chromosomes that retain more CID (bigger centromeres, figurative), make bigger kinetochores and attract more microtubules nucleating from the daughter centrosome (orange) and will be inherited by the GSC. At anaphase, and at replication, centromeres are clustered at the opposite sides of the two daughter nuclei. CID and CENP-C asymmetry is detected also at S phase. Telophase and G1 are shown as transparent because of the lack of data for these two phases. CID overexpression or HASPIN knockdown promotes GSC self-renewal and disrupts CID asymmetric inheritance.

References

    1. Ables E.T., and Drummond-Barbosa D.. 2013. Cyclin E controls Drosophila female germline stem cell maintenance independently of its role in proliferation by modulating responsiveness to niche signals. Development. 140:530–540. 10.1242/dev.088583 - DOI - PMC - PubMed
    1. Ahmad K., and Henikoff S.. 2001. Centromeres are specialized replication domains in heterochromatin. J. Cell Biol. 153:101–110. 10.1083/jcb.153.1.101 - DOI - PMC - PubMed
    1. Allshire R.C., and Karpen G.H.. 2008. Epigenetic regulation of centromeric chromatin: old dogs, new tricks? Nat. Rev. Genet. 9:923–937. 10.1038/nrg2466 - DOI - PMC - PubMed
    1. Bade D., Pauleau A.L., Wendler A., and Erhardt S.. 2014. The E3 ligase CUL3/RDX controls centromere maintenance by ubiquitylating and stabilizing CENP-A in a CAL1-dependent manner. Dev. Cell. 28:508–519. 10.1016/j.devcel.2014.01.031 - DOI - PubMed
    1. Barnhart M.C., Henning P., Kuich J.L., Stellfox M.E., Ward J.A., Bassett E.A., Black B.E., and Foltz D.R.. 2011. HJURP Is a CENP-A Chromatin Assembly Factor Sufficient to Form a Functional de Novo Kinetochore. J. Cell Biol. 194:229–243. 10.1083/jcb.201012017 - DOI - PMC - PubMed

Publication types