. 2020 Apr 6;219(4):e201907213.
doi: 10.1083/jcb.201907213.

Oocytes mount a noncanonical DNA damage response involving APC-Cdh1-mediated proteolysis

Affiliations

Oocytes mount a noncanonical DNA damage response involving APC-Cdh1-mediated proteolysis

Goutham Narayanan Subramanian et al. J Cell Biol. .

Abstract

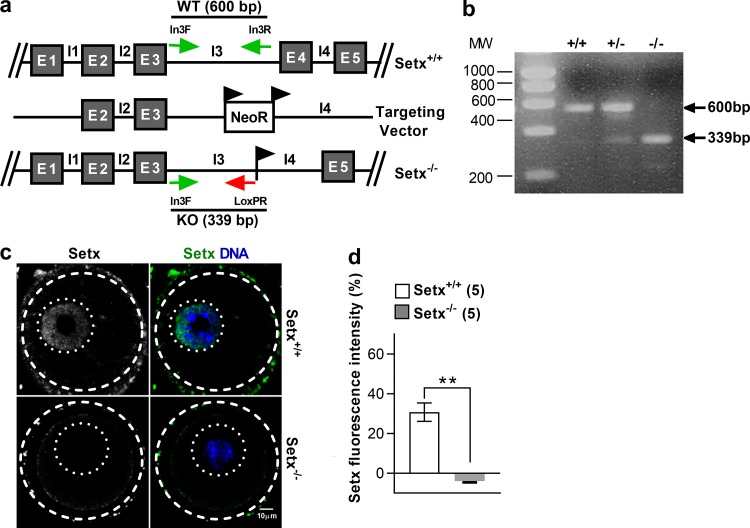
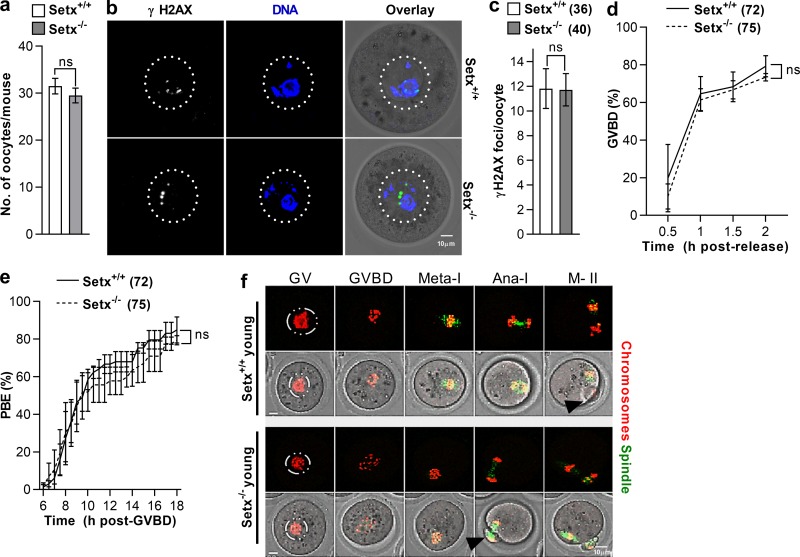
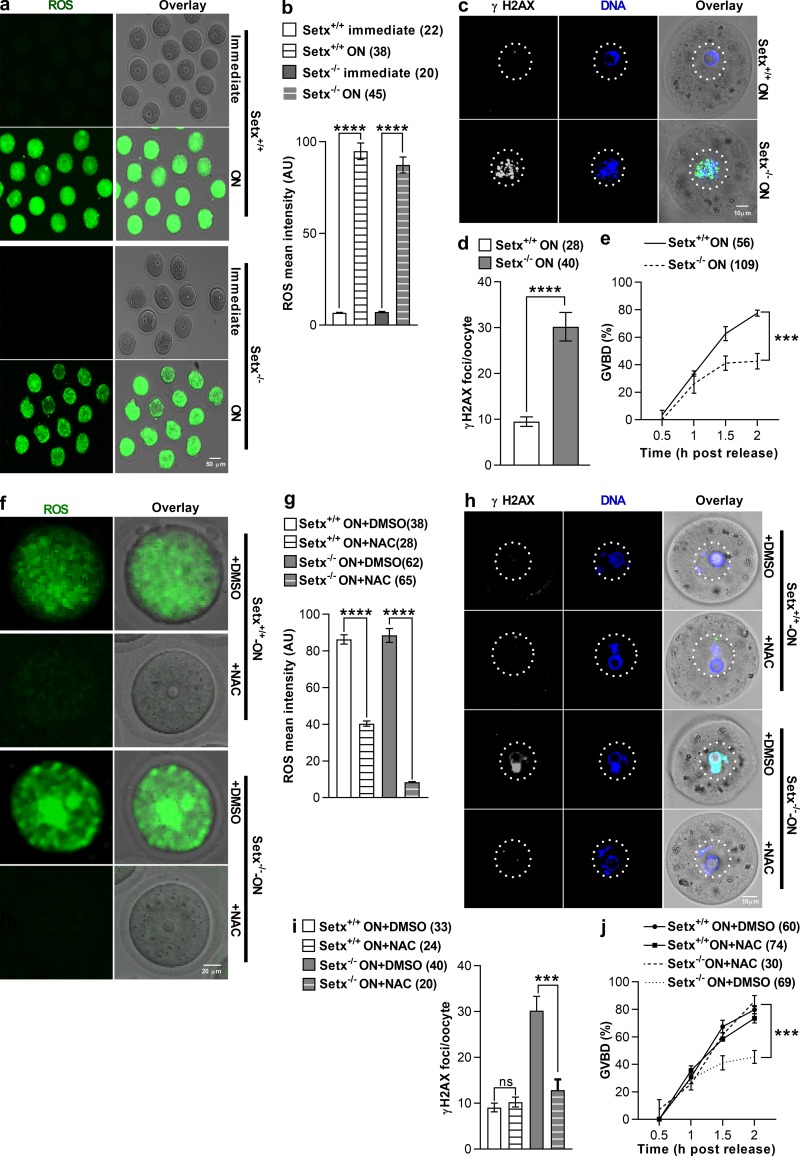
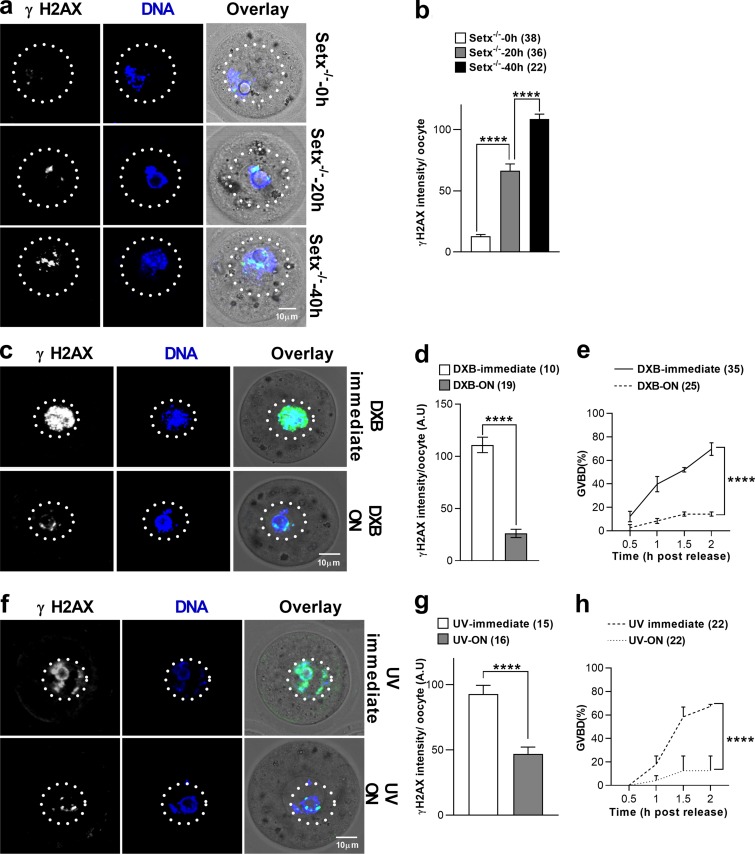
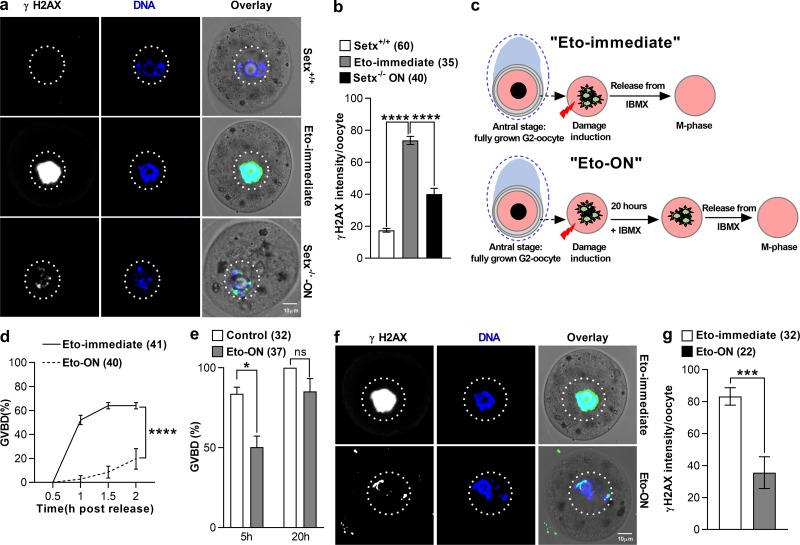
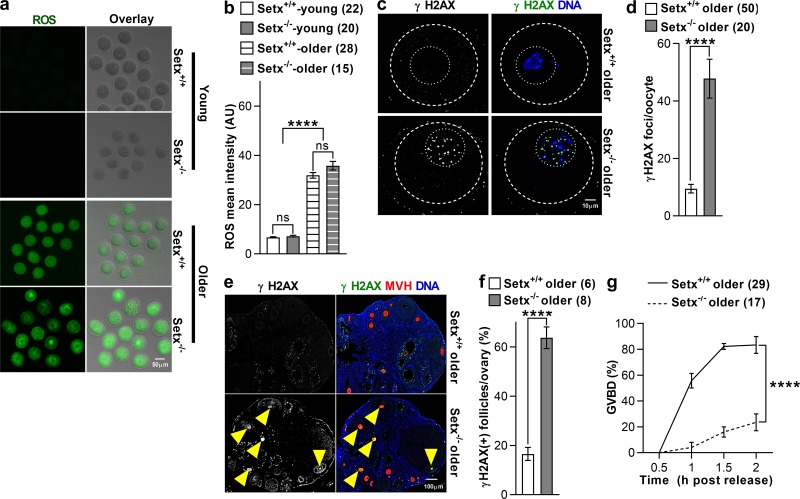
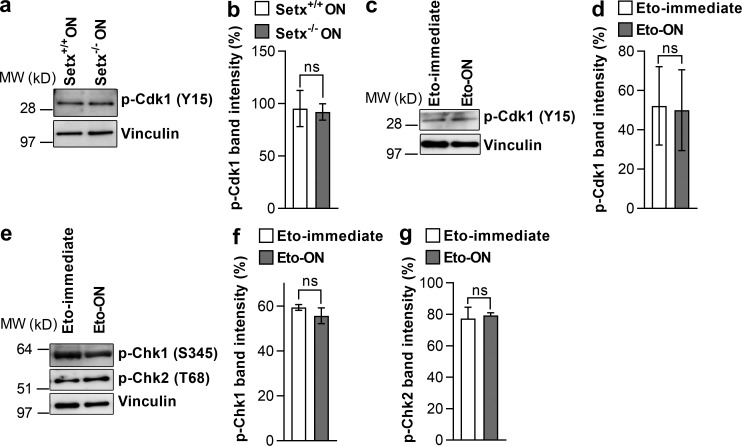
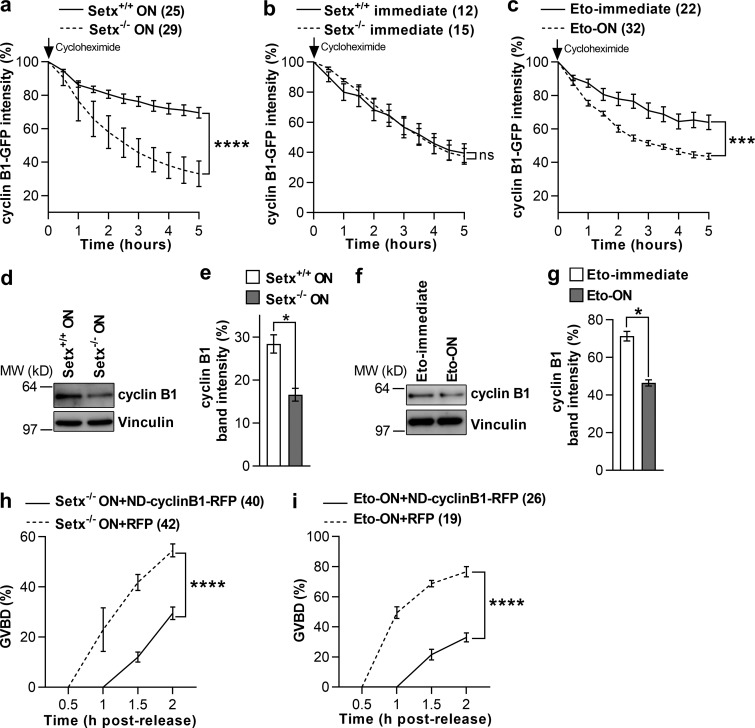
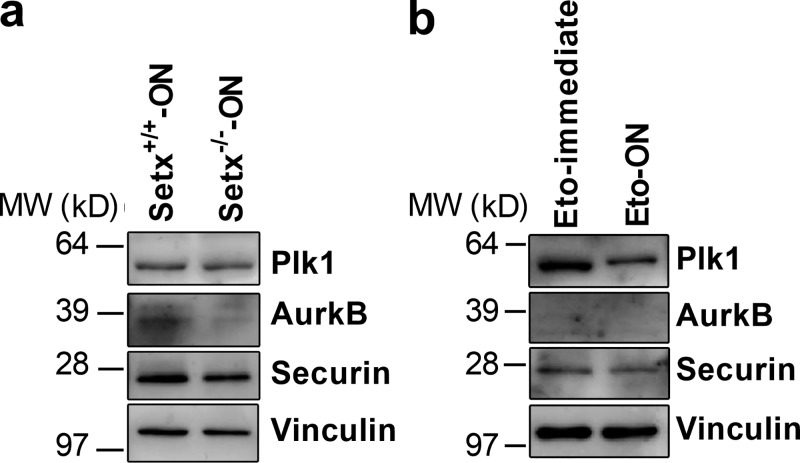
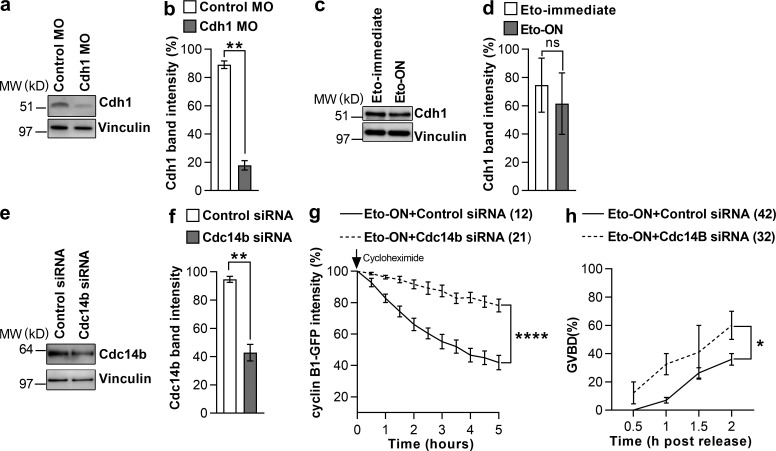
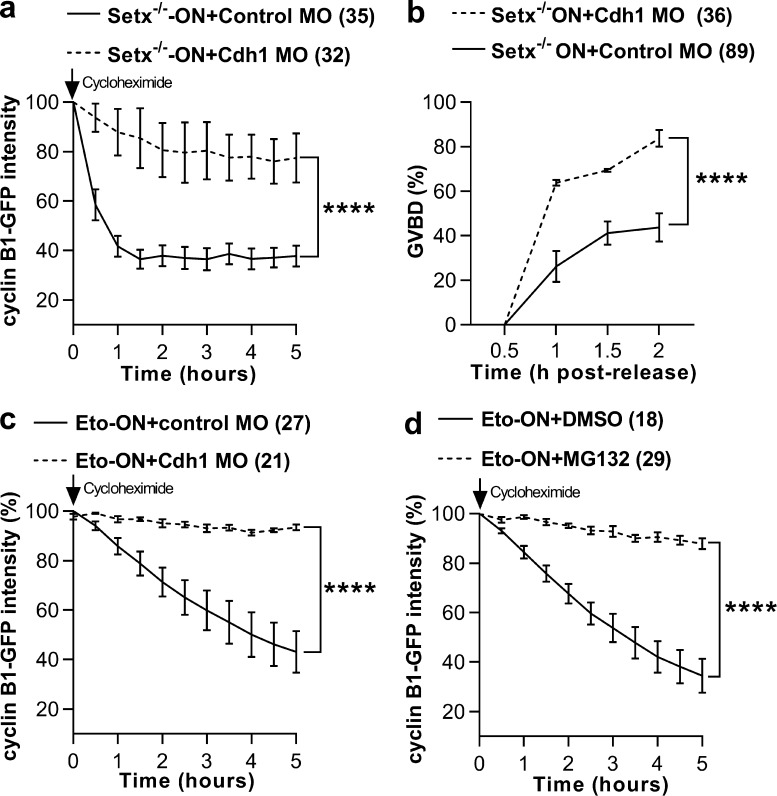
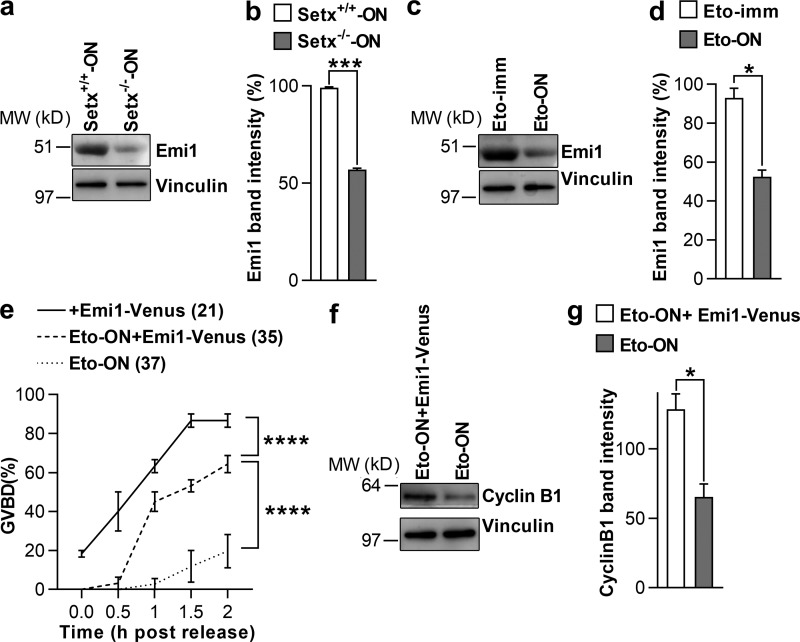
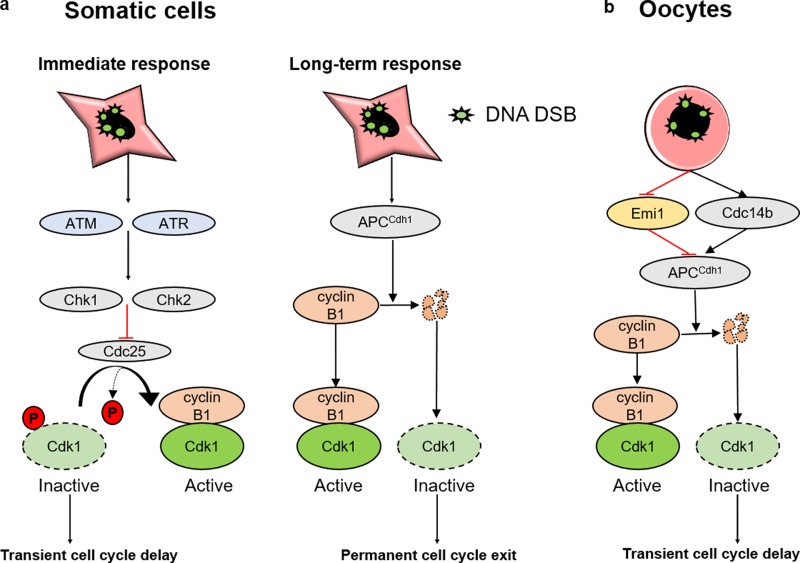
In mitotic cells, DNA damage induces temporary G2 arrest via inhibitory Cdk1 phosphorylation. In contrast, fully grown G2-stage oocytes readily enter M phase immediately following chemical induction of DNA damage in vitro, indicating that the canonical immediate-response G2/M DNA damage response (DDR) may be deficient. Senataxin (Setx) is involved in RNA/DNA processing and maintaining genome integrity. Here we find that mouse oocytes deleted of Setx accumulate DNA damage when exposed to oxidative stress in vitro and during aging in vivo, after which, surprisingly, they undergo G2 arrest. Moreover, fully grown wild-type oocytes undergo G2 arrest after chemotherapy-induced in vitro damage if an overnight delay is imposed following damage induction. Unexpectedly, this slow-evolving DDR is not mediated by inhibitory Cdk1 phosphorylation but by APC-Cdh1-mediated proteolysis of the Cdk1 activator, cyclin B1, secondary to increased Cdc14B-dependent APC-Cdh1 activation and reduced Emi1-dependent inhibition. Thus, oocytes are unable to respond immediately to DNA damage, but instead mount a G2/M DDR that evolves slowly and involves a phosphorylation-independent proteolytic pathway.


Figures

Figure S1.
Figure S1.
Targeted deletion of SETX gene and oocyte Setx expression. (a) Schematic representation of the wild-type SETX allele, the targeting vector with the neomycin resistance (NeoR) cassette, and the Setx knockout (Setx−/−) allele. The primers (ln3F, ln3R, and LoxPR) used and the sizes of the predicted PCR products obtained for wild type (WT; 600 bp) and knockout (KO; 339 bp) alleles are shown. E, exon; I, intron. Triangles denote the LoxP sites. (b) Products produced by undertaking PCR using primers in panel a on whole genomic DNA obtained from tail-tips of Setx+/+, Setx+/−, and Setx−/− animals. (c) Representative images of Setx+/+ and Setx−/− oocytes immunostained for Setx and DNA. Outer dashed circle outlines the oocyte; inner dotted circle outlines the GV. Scale bar, 10 µm. (d) Quantification of Setx fluorescence intensity within the GV. Oocyte numbers are shown in parentheses. Error bars depict mean ± SEM. Two-tailed Student’s t test used for statistical analysis. **, P < 0.01.
Figure 1.
Figure 1.
Loss of Setx does not affect oocyte maturation in young mice. (a) Quantification of fully grown GV-stage oocytes per mouse (six mice per genotype). (b and c) Representative images of γH2AX and DNA labeling in fully grown Setx+/+ and Setx−/− oocytes (b) and quantification of γH2AX-intensity per oocyte (c). (d and e) GVBD (d) and first polar body extrusion (PBE; e) rates of oocytes from Setx+/+ and Setx−/− mice (four mice per genotype). (f) Representative time-lapse series of young Setx+/+ and Setx−/− oocytes at GV, shortly after GVBD, followed by metaphase I, anaphase I, and metaphase II arrest (M-II). Black arrows depict the first polar body. Scale bars, 10 µm. Oocyte numbers are shown in parentheses from a minimum of three independent experiments. Error bars are mean ± SEM. Two-tailed Student’s t test (a and c) or two-way ANOVA (d and e) was used for statistical analysis; ns, P > 0.05.
Figure 2.
Figure 2.
Gradual emergence of DNA damage in Setx−/− oocytes induces G2 arrest. (a and b) Representative images of ROS fluorescence in oocytes (a) and quantification of ROS levels in Setx+/+ and Setx−/− oocytes immediately after harvesting (immediate) and after overnight culture (ON) in vitro (b). (c and d) Representative images of γH2AX and DNA labeling in Setx+/+-ON and Setx−/−-ON oocytes (c) and quantification of γH2AX-intensity per oocyte (d). (e) GVBD rates for Setx+/+-ON and Setx−/−-ON oocytes. (f and g) Representative images of ROS fluorescence (f) and quantification of ROS levels (g) in Setx+/+-ON and Setx−/− oocytes treated with either DMSO or NAC during overnight culture (ON) in vitro. (h and i) Representative images of γH2AX and DNA labeling in Setx+/+-ON and Setx−/−-ON oocytes treated with either DMSO or NAC (h) and quantification of γH2AX-intensity per oocyte (i). (j) GVBD rates for Setx+/+-ON and Setx−/−-ON oocytes treated with either DMSO or NAC. Oocyte numbers are shown in parentheses from a minimum of three independent experiments. Error bars are mean ± SEM. Two-tailed Student’s t test (b, d, g, and i) or two-way ANOVA (e and j) was used for statistical analysis. ***, P < 0.001; ****, P < 0.0001.
Figure S2.
Figure S2.
DNA damage in Setx−/− oocytes during in vitro culture and response to treatment with either DXB or UV-B irradiation. (a and b) Representative images of γH2AX and DNA labeling (a) and quantification of γH2AX intensity (b) in Setx−/− oocytes immediately after harvesting (0 h) and after 20 and 40 h in vitro culture. (c and d) Representative images of γH2AX and DNA labeling (c) and quantification of γH2AX intensity (d) in DXB-immediate and DXB-ON oocytes. (e) GVBD rates for DXB-immediate and DXB-ON oocytes. (f and g) Representative images of γH2AX and DNA labeling (f) and quantification of γH2AX intensity (g) in UV-immediate, and UV-ON oocytes. (h) GVBD rates for UV-immediate and UV-ON oocytes. Oocyte numbers are shown in parentheses. Error bars are mean ± SEM. Two-tailed Student’s t test (b, d, and g) or two-way ANOVA (e and h) was used for statistical analysis. ***, P < 0.001; ****, P < 0.0001.
Figure 3.
Figure 3.
Chemotherapy-induced DNA damage induces G2 arrest after a delay. (a and b) Representative images of γH2AX and DNA labeling (a) and quantification of γH2AX intensity (b) in Setx+/+ (untreated), Setx+/+ oocytes immediately after treatment with Eto (Eto-immediate), and Setx−/−-ON oocytes. (c) Schematic depicting experimental models of “Eto-immediate” and “Eto-ON” oocytes. (d) GVBD rates for Eto-immediate and Eto-ON oocytes. (e) GVBD rates 5 and 20 h after release from IBMX for DMSO-treated control and Eto-ON oocytes. (f and g) Representative images of γH2AX and DNA labeling (f) and quantification of γH2AX intensity (g) in Eto-immediate and Eto-ON oocytes. Oocyte numbers are shown in parentheses from a minimum of three independent experiments. Error bars are mean ± SEM. Two-tailed Student’s t test (b, e, and g) or two-way ANOVA (d) was used for statistical analysis. ns, P > 0.05; *, P < 0.05; ***, P < 0.001; ****, P < 0.0001.
Figure 4.
Figure 4.
DNA damage acquired in vivo during natural aging inhibits M-phase entry. (a and b) Representative images of ROS fluorescence in oocytes (a) and quantification of ROS levels (b) in young and older Setx+/+ and Setx−/− oocytes immediately after harvesting. (c and d) Representative images of γH2AX and DNA labeling (c) and quantification of γH2AX-intensity (d) in Setx−/−-older oocytes. (e and f) Representative images of γH2AX, MVH, and DNA labeling (e) and quantification of proportion of γH2AX-positive follicles (f). MVH is a germ cell–specific marker (Toyooka et al., 2000) that was used for identifying oocytes. (g) GVBD rates for Setx+/+-older and Setx−/−-older oocytes. Oocyte numbers are shown in parentheses from a minimum of three independent experiments. Error bars are mean ± SEM. Two-tailed Student’s t test (b, d, and f) or two-way ANOVA (g) was used for statistical analysis. ns, P > 0.05; ****, P < 0.0001.
Figure S3.
Figure S3.
G2 arrest was not due to the canonical phosphorylation pathway. (a–d) Representative immunoblots (a and c) and quantification of p-Cdk1(Y15) (b and d) band intensities in Setx+/+-ON and Setx−/−-ON oocytes and Eto-immediate and Eto-ON oocytes (65 oocytes/group). (e–g) Representative immunoblots (e) and quantification of p-Chk1(S345) (f) and p-Chk2(T68) (g) band intensities in Eto-immediate and Eto-ON oocytes (60 oocytes/group). Data are from a minimum of three independent experiments. Error bars are mean ± SEM. Two-tailed Student’s t test was used for statistical analysis. ns, P > 0.05.
Figure 5.
Figure 5.
The DDR in oocytes involves increased proteolysis. (a–c) Quantification of cyclin B1-GFP fluorescence decline in Setx+/+-ON and Setx−/−-ON (a), Setx+/+-immediate and Setx−/−-immediate (b), and Eto-immediate and Eto-ON (c) GV-stage oocytes. (d and e) Representative immunoblot (d) and quantification of cyclin B1 band intensities (e) in Setx+/+-ON and Setx−/−-ON oocytes (30 oocytes per lane). (f and g) Representative immunoblot (f) and quantification of cyclin B1 band intensities (g) in Eto-immediate and Eto-ON oocytes (30 oocytes per lane). (h and i) GVBD rates for Setx+/+-ON (h) and Eto-ON (i) oocytes microinjected with either RFP or ND-Cyclin B1-RFP cRNA. Oocyte numbers are shown in parentheses from a minimum of three independent experiments. Error bars are mean ± SEM. Two-tailed Student’s t test (e and g) or two-way ANOVA (a, b, c, h, and i) was used for statistical analysis. *, P < 0.05; ***, P < 0.001; ****, P < 0.0001; ns, P > 0.05. In immunoblots, vinculin served as a loading control.
Figure S4.
Figure S4.
Reduced levels of APC-Cdh1 substrates in Setx−/−-ON and Eto-ON oocytes. (a and b) Representative immunoblots of Plk1, Aurora kinase B (AurkB), and securin in Setx+/+-ON and Setx−/−-ON oocytes (a) as well as Eto-immediate and Eto-ON oocytes (b). Vinculin in blots served as a loading control.
Figure S5.
Figure S5.
Morpholino-induced depletion of Cdh1, Eto treatment does not affect Cdh1 levels, and Cdc14B activity increases following DNA damage and inhibits M-phase entry. (a and b) Representative immunoblot (a) and quantification of Cdh1 band intensities (b) in oocytes injected with either a control morpholino (Control MO) or a CDH1-targeting morpholino (Cdh1 MO; 30 oocytes/group). (c and d) Representative immunoblot (c) and quantification of Cdh1 band intensities (d) in Eto-immediate and Eto-delay GV-stage oocytes (30 oocytes/group). (e–g) Representative immunoblot (e) and quantification of Cdc14B band intensities (f) in GV-stage oocytes microinjected with either control or CDC14B-targeting siRNAs (30 oocytes/group). Quantification of cyclin B1-GFP fluorescence (g) in Eto-ON oocytes microinjected with either control or CDC14B-targeting siRNAs. (h) GVDB rates for Eto-ON oocytes injected with either control or CDC14B-targeting siRNAs. Vinculin in blots served as a loading control. Oocyte number are shown in parentheses from a minimum of three independent experiments. Error bars are mean ± SEM. Two-tailed Student’s t test (b, d, and f) or two-way ANOVA (g and h) was used for statistical analysis. ns, P > 0.05; *, P < 0.05; **, P < 0.01; ****, P < 0.0001.
Figure 6.
Figure 6.
APC-Cdh1 mediates increased proteolysis with DNA damage. (a) Quantification of cyclin B1-GFP fluorescence decline in Setx−/−-ON GV-stage oocytes that were either Cdh1 depleted or mock depleted. (b) GVBD rates for Setx−/−-ON oocytes that were either Cdh1 depleted or mock depleted. (c and d) Quantification of cyclin B1-GFP fluorescence decline in Eto-ON GV-stage oocytes that were either Cdh1 depleted or mock depleted (c) and Eto-ON oocytes that were either DMSO treated (Control) or MG132 treated (d). Oocyte numbers are shown in parentheses from a minimum of three independent experiments. Error bars are mean ± SEM. Two-way ANOVA used for statistical analysis. ****, P < 0.0001.
Figure 7.
Figure 7.
Reduced Emi1 levels inhibit M-phase entry following DNA damage. (a and b) Representative immunoblot (a) and quantification of Emi1 band intensities (b) in Setx+/+-ON and Setx−/−-ON oocytes (50 oocytes per lane). (c and d) Representative immunoblot (c) and quantification of Emi1 band intensities (d) in Eto-immediate and Eto-ON oocytes (50 oocytes per lane). (e) GVBD rates for oocytes microinjected with EMI1-Venus cRNA, Eto-ON oocytes microinjected with EMI1-Venus cRNA, and uninjected Eto-ON oocytes. Note that ∼20% of oocytes overexpressing Emi1-Venus overcame IBMX-mediated inhibition. (f and g) Representative immunoblot (f) and quantification of cyclin B1 band intensities (g) in Eto-ON oocytes with or without Emi1-venus overexpression (80 oocytes per lane). Oocyte numbers are shown in parentheses from a minimum of three independent experiments. Error bars are mean ± SEM. Two-tailed Student’s t test (b, d, and g) or two-way ANOVA (e) was used for statistical analysis. *, P < 0.05; ***, P < 0.001; ****, P < 0.0001. In immunoblots, vinculin served as loading control.
Figure 8.
Figure 8.
Schematic of G2/M DDR in somatic cells compared with oocytes. (a) During mitosis, the downstream target of the immediate-response DDR that causes a transient delay in cell cycle progression to enable DNA repair is inhibitory Cdk1 phosphorylation. Mitotic cells mount another type of response to extended periods of genotoxic stress, which activates APC-Cdh1–mediated cyclin B1 destruction to cause irreversible withdrawal from the cell cycle. (b) In contrast, in oocytes, a transient DDR that furnishes time for DNA repair evolves slowly and does not target inhibitory Cdk1 phosphorylation but instead activates APC-Cdh1–mediated destruction of cyclin B1, thereby preventing Cdk1 activation required for entry into M phase.

References

    1. Adhikari D., and Liu K.. 2014. The regulation of maturation promoting factor during prophase I arrest and meiotic entry in mammalian oocytes. Mol. Cell. Endocrinol. 382:480–487. 10.1016/j.mce.2013.07.027 - DOI - PubMed
    1. Adhikari D., Busayavalasa K., Zhang J., Hu M., Risal S., Bayazit M.B., Singh M., Diril M.K., Kaldis P., and Liu K.. 2016. Inhibitory phosphorylation of Cdk1 mediates prolonged prophase I arrest in female germ cells and is essential for female reproductive lifespan. Cell Res. 26:1212–1225. 10.1038/cr.2016.119 - DOI - PMC - PubMed
    1. Bassermann F., Frescas D., Guardavaccaro D., Busino L., Peschiaroli A., and Pagano M.. 2008. The Cdc14B-Cdh1-Plk1 axis controls the G2 DNA-damage-response checkpoint. Cell. 134:256–267. 10.1016/j.cell.2008.05.043 - DOI - PMC - PubMed
    1. Becherel O.J., Yeo A.J., Stellati A., Heng E.Y., Luff J., Suraweera A.M., Woods R., Fleming J., Carrie D., McKinney K., et al. 2013. Senataxin plays an essential role with DNA damage response proteins in meiotic recombination and gene silencing. PLoS Genet. 9:e1003435 10.1371/journal.pgen.1003435 - DOI - PMC - PubMed
    1. Bolcun-Filas E., Rinaldi V.D., White M.E., and Schimenti J.C.. 2014. Reversal of female infertility by Chk2 ablation reveals the oocyte DNA damage checkpoint pathway. Science. 343:533–536. 10.1126/science.1247671 - DOI - PMC - PubMed

Publication types

MeSH terms