. 2020 Jun;24(11):6137-6148.
doi: 10.1111/jcmm.15228. Epub 2020 Apr 24.

RNA demethylase ALKBH5 promotes ovarian carcinogenesis in a simulated tumour microenvironment through stimulating NF-κB pathway

Affiliations

RNA demethylase ALKBH5 promotes ovarian carcinogenesis in a simulated tumour microenvironment through stimulating NF-κB pathway

Yi Jiang et al. J Cell Mol Med. 2020 Jun.

Abstract

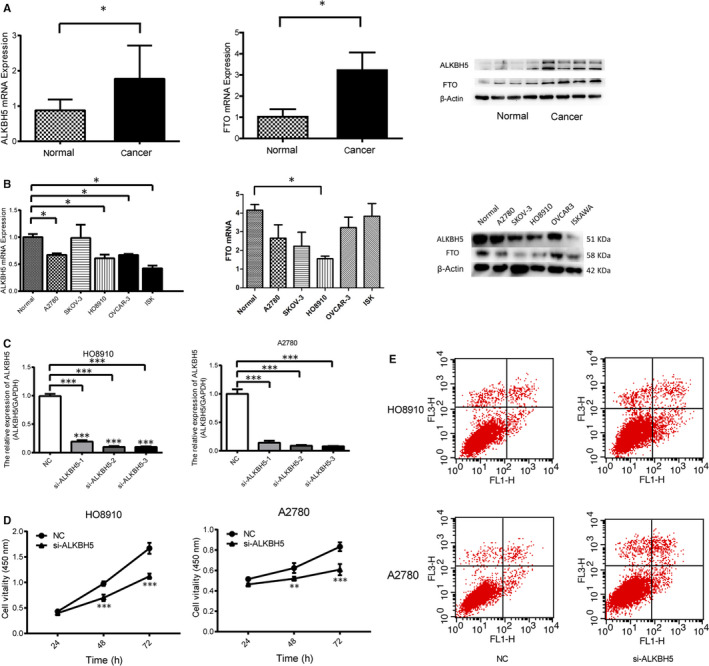
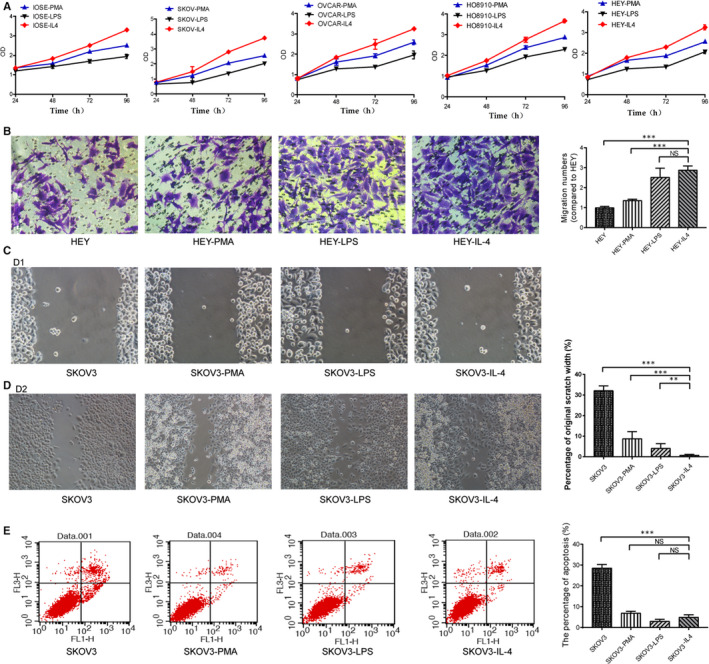
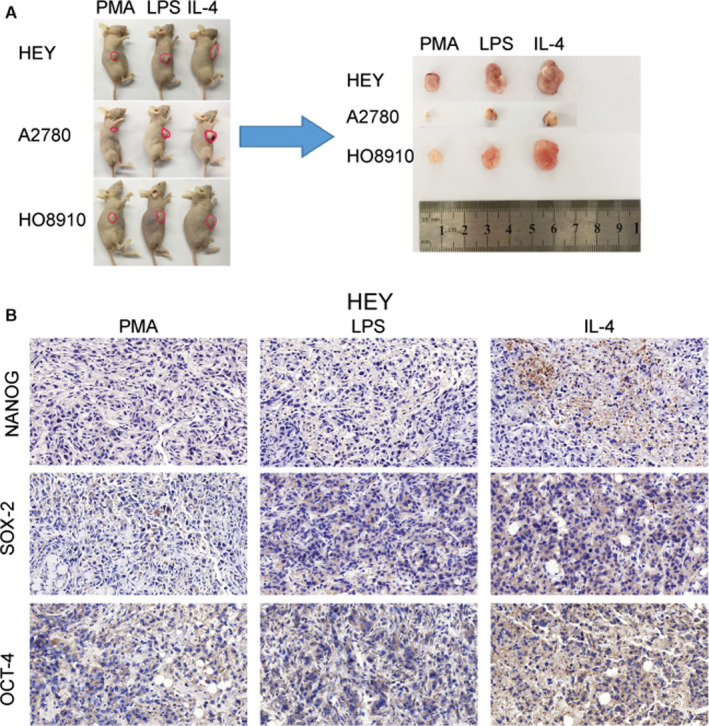
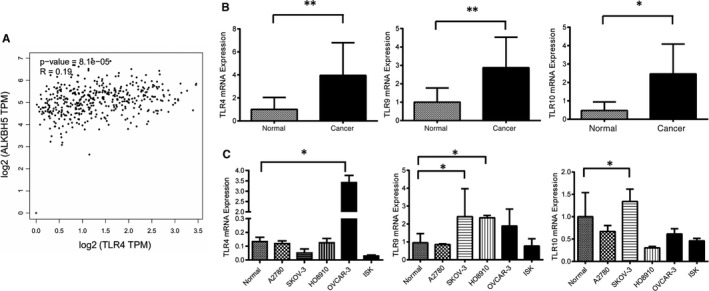
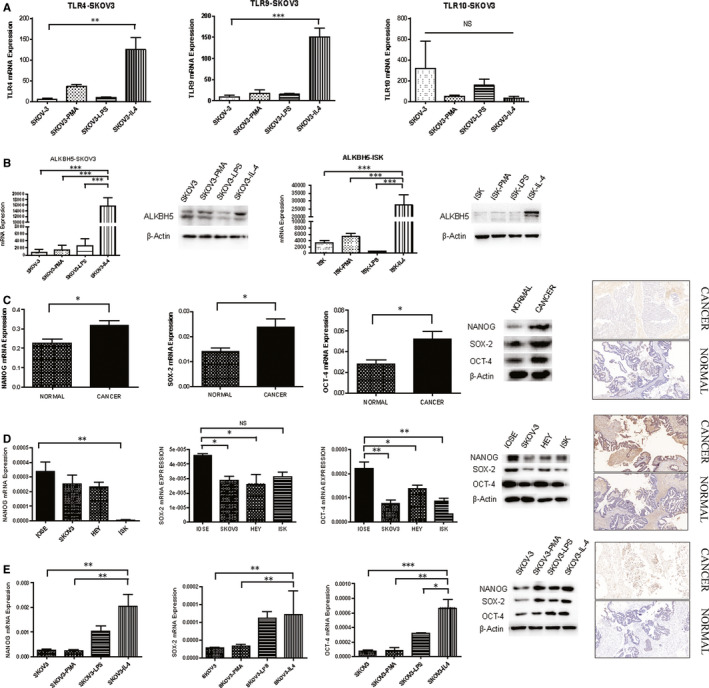
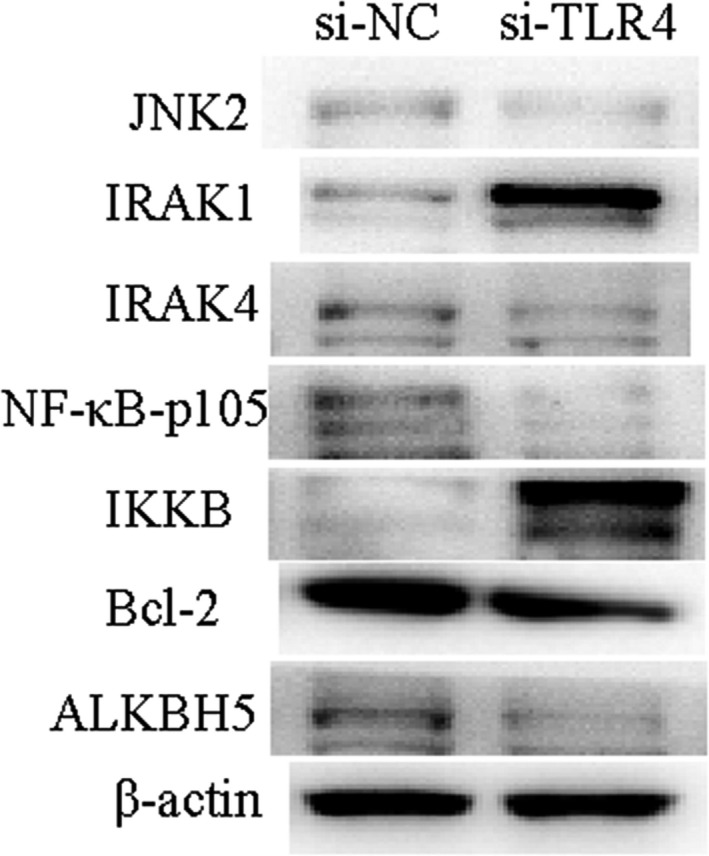
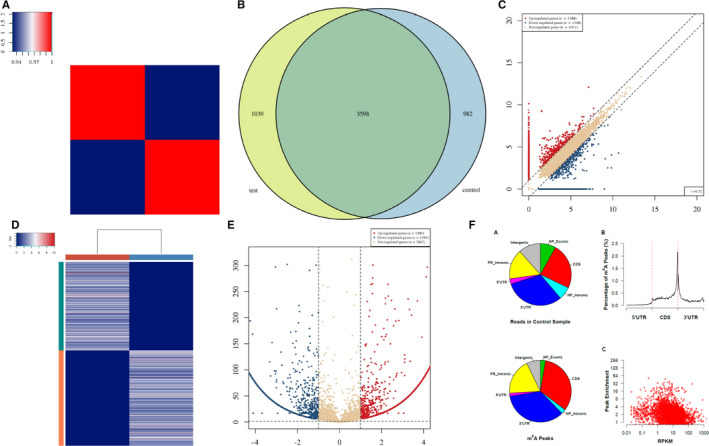
Methylation is the main form of RNA modification. N6-methyladenine (m6A) regulates the splicing and translation of mRNA. Alk B homologue 5 (ALKBH5) participates in the biological regulation of various cancers. However, its role in ovarian carcinogenesis has not been unveiled. In the present study, ALKBH5 showed higher expression in ovarian cancer tissue than in normal ovarian tissue, but lower expression in ovarian cancer cell lines than in normal ovarian cell lines. Interestingly, Toll-like receptor (TLR4), a molecular functioning in tumour microenvironment (TME), demonstrated the same expression trend. To investigate the effect of abnormal TME on ovarian carcinogenesis, we established an in vitro model in which macrophages and ovarian cancer cells were co-cultured. In the ovarian cancer cells co-cultured with M2 macrophages, the expression of ALKBH5 and TLR4 increased. We also verified that TLR4 up-regulated ALKBH5 expression via activating NF-κB pathway. Depending on transcriptome sequencing, m6A-Seq and m6A MeRIP, we found that NANOG served as a target in ALKBH5-mediated m6A modification. NANOG expression increased after mRNA demethylation, consequently enhancing the aggressiveness of ovarian cancer cells. In conclusion, highly expressed TLR4 activated NF-κB pathway, up-regulated ALKBH5 expression and increased m6A level and NANOG expression, all contributing to ovarian carcinogenesis. Our study revealed the role of m6A in ovarian carcinogenesis, providing a clue for inventing new target therapy.

Keywords: ALKBH5; RNA methylation; ovarian cancer; tumour microenvironment.


Conflict of interest statement

The authors declare that they have no conflict interest in the study or preparation of the manuscript.

Figures

FIGURE 1
FIGURE 1
ALKBH5 and FTO expression in ovarian cancer tissues and normal ovarian tissues. A, Relative expression of ALKBH5 and FTO in EOC tissues (n = 73) compared with normal tissues (n = 37). ALKBH5 and FTO mRNA expressions were examined by qPCR and normalized to GAPDH expression, and examined by Western blot which were normalized to β‐actin expression. ALKBH5 and FTO have higher expression in ovarian epithelial cancer tissues than normal ones (*P < .05). B, qRT‐PCR and Western blot analysis of ALKBH5 and FTO mRNA and protein expression in normal ovarian cells (IOSE), EOC cell (A2780, SKOV3, HO‐8910 and OVCAR‐3) and endometrial cancer cell line (Ishikawa). ALKBH5 and FTO have lower expression in ovarian cancer cell lines than normal one (*P < .05). Representative images and data based on three independent experiments. C, Small interfering RNA (siRNA) knocks down the expression of ALKBH5 and detects its interference efficiency separately. The interference sequence si‐ALKBH5 3# has the highest interference efficiency and is selected as the experimental interference sequence. D, Knockdown of ALKBH5 expression could reduce proliferation of A2780 and HO8910 ovarian cancer cells. E, Flow cytometry results show the apoptotic rate was higher in A2780 and HO8910 cells transfected with si‐ALKBH5 than those of controls
FIGURE 2
FIGURE 2
Ovarian cancer cells are co‐cultured with M2 macrophages, the proliferation and invasion ability are enhanced, and the apoptosis ability is decreased. A, Proliferation assessment using CCK8 assay shows that the proliferation rate and activity of ovarian cancer cells in M2 co‐culture group increase, whereas the proliferation rate and activity decrease in M1 co‐culture group. B, Transwell assay shows the increased invasion of the ovarian cancer cells in M2 co‐culture group. One‐way ANOVA indicates differences between groups. C/D, Migration assessment shows in cell wound healing assay, singly cultured cells have decreased migration than cells in M2 co‐cultured group. By comparison, M2 co‐cultured cells have the most significant migration among the groups. E, Flow cytometry Annexin V‐FITC/PI for detection of apoptosis. Ovarian cancer cells (SKOV3, HEY, HO8910, OVCAR3) co‐cultured with M2 macrophages have significantly decreased apoptosis, indicating their increased anti‐apoptotic property compared to the M1 co‐cultured cells and the control
FIGURE 3
FIGURE 3
ALKBH5 significantly promoted ovarian carcinogenesis in vivo, after co‐culture of ovarian cancer cells with M2 macrophages. The co‐cultured ovarian cancer cells were subcutaneously inoculated into nude mice (n = 3) in each groups. The tumour volume formed under the skin of ovarian cancer cell lines with M2 co‐cultured group is significantly larger than that of M1 co‐cultured group. The size of tumour formed in the subcutaneous implantation mice model is monitored every 2 days. IHC indicates the overexpression of NANOG, SOX‐2 and OCT‐4 in the nude mice tumours
FIGURE 4
FIGURE 4
A, The relationship between ALKBH5 and TLR4 was analysed in TCGA data sets. Scatter plot indicated TLR4 and ALKBH5 had positive relationship (R = 0.19). B, Relative expression of TLR4 in EOC tissues (n = 73) compared with normal tissues (n = 37). TLR4 mRNA expression was examined by qPCR and normalized to GAPDH expression. TLR4 has higher expression in ovarian epithelial cancer tissues than normal ones (**P < .01). C, Relative expression of TLR4 in normal ovarian cell line (IOSE) compared with ovarian cancer cell line (OVCAR3). TLR4 mRNA expression was examined by qPCR and normalized to GAPDH expression. TLR4 has higher expression in OVCAR3 cell line than normal one (***P < .00)
FIGURE 5
FIGURE 5
Expression of TLR4, ALKBH5 and NANOG genes after co‐culture of ovarian cancer cells with M2 macrophages. A, The expression of TLR‐related factors in co‐cultured cells. The expression levels of TLR4 and TLR9 in M2‐type co‐cultured cells are significantly higher than those in control cells (***P < .001, **P < .01). B, The expression levels of ALKBH5 significantly increase in SKOV‐3 and Ishikawa M2‐type co‐cultured group cells. ALKBH5 mRNA expression was examined by qPCR and normalized to GAPDH expression, and examined by Western blot which were normalized to β‐actin expression in SKOV3 cell groups. ALKBH5 has higher expression in M2 co‐cultured cells than other groups (***P < .00). C‐D, The expression of NANOG, SOX‐2 and OCT‐4 in normal and malignant ovarian tissues and cell lines. Relative expression of NANOG, SOX‐2 and OCT‐4 in EOC tissues (n = 73) compared with normal tissues (n = 37). NANOG, SOX‐2 and OCT‐4 mRNA expressions were examined by qPCR and normalized to GAPDH expression, and examined by Western blot which were normalized to β‐actin expression. NANOG, SOX‐2 and OCT‐4 have higher expression in ovarian epithelial cancer tissues than normal ones (*P < .05). Relative expression of NANOG, SOX‐22 and OCT‐4 in normal ovarian cell line (IOSE) compared with different ovarian cancer cell lines (SKOV3, HEY) and endometrial cancer cell line (Ishikawa). NANOG, SOX‐2 and OCT‐4 have lower expression in ovarian cancer cell lines than normal one (**P < .01, *P < .05). E, The expression level of NANOG in M2‐type co‐cultured cells was significantly higher than that in other co‐cultured groups (***P < .001, **P < .01, *P < .05)
FIGURE 6
FIGURE 6
siRNA is used to inhibit the expression of TLR4 in co‐cultured cells. The expression of ALKBH5 decreases; meanwhile, each protein in NF‐κB signalling pathway is detected by Western blot assay. The results show that IRAK1 and IKKB proteins are up‐regulated in si‐TLR4 cells, whereas IRAK4 and NF‐κB‐p105, Bcl‐2 protein expressions decrease
FIGURE 7
FIGURE 7
A, Heat map of correlation coefficient from test group and control group. The colours in the panel represent the correlation coefficient of the two samples. Blue shows the two samples have a low correlation coefficient, and red shows the high similarity of the two samples. The plots are performed in R gplots package. B, Venn diagram of the genes number. The plot shows the number of genes methylated in both groups and the number of specific methylated genes. These plots are performed in R VennDiagram package. C, Scatter plot between two groups. RPM values of all identified methylated genes are plotted. The values of X and Y axes in the scatter plot are the averaged RPM values from each group (log2‐scaled). Genes above the top line (red dots, up‐regulation) or below the bottom line (blue dots, down‐regulation) indicate more than 2.0 fold change (default fold change value is 2.0) between the two compared groups. Brown dots indicate methylation level without differentially expression. D, Heat map of gene expression. The heat map shows the 500 genes with the largest coefficient of variation (CV) based on RPM counts. Each row represents one gene, and all the 500 genes are categorized into 10 clusters based on K‐means clustering. Each column represents one sample. The colour in the panel represents the relative expression level (log2‐transformed). The colour scale is shown below: blue represents an expression level below the mean; red represents an expression level above the mean. The coloured bar top at the top panel showed the sample group, and the coloured bar at the right side of the panel indicates the 10 divisions which were performed using K‐means. These plots were performed in R heatmap2 package. E, Volcano plot for test vs control. Red/blue curves indicate 2.0 fold change of differentially methylated gene with statistical significance (red: up‐regulated; blue: down‐regulated). Brown curve indicates non‐differentially methylated gene; fc or q‐value is not satisfied. The values of X and Y axes in the volcano plot are the fold change (log2‐transformed) and P‐value (‐log10‐transformed) between the two groups, respectively. F, m6A peak distribution. Transcriptome‐wide distribution of m6A peaks. Pie chart shows the percentage of non‐IP reads (top) and m6A peaks (bottom) within distinct regions of RNA; NP stands for non–protein‐coding genes, whereas PR stands for protein‐coding genes. Distribution of m6A peaks along mRNA (no figure if not all of 5’UTRs, CDSs and 3’UTRs exist). 5’UTRs, CDSs and 3’UTRs of each transcript are separately binned regions spanning 1% of their total lengths; Y‐coordinates represent percentage of m6A peaks located in each bin. Correlation between gene expression level and m6A peak enrichment. The peak enrichment value relative to the transcript abundance within the input RNA is plotted

References

    1. Siegel RL, Miller KD, Jemal A. Cancer statistics, 2018. CA Cancer J Clin. 2018;68(1):7‐30. - PubMed
    1. Lu HM, Li S, Black MH, et al. Association of breast and ovarian cancers with predisposition genes identified by large‐scale sequencing. JAMA Oncol. 2018;5:51‐57. - PMC - PubMed
    1. Macintyre G, Goranova TE, De Silva D, et al. Copy number signatures and mutational processes in ovarian cancer. Nat Genet. 2018;50(9):1262‐1270. - PMC - PubMed
    1. Yang Q, Yang Y, Zhou N, et al. Epigenetics in ovarian cancer: premise, properties, and perspectives. Mol Cancer. 2018;17(1):109. - PMC - PubMed
    1. Maldonado L, Brait M, Izumchenko E, et al. Intergrated transcriptomic and epigenomic analysis of ovarian cancer reveals epigenetically silenced GULP1. Cancer Lett. 2018;433:242‐251. - PubMed

Publication types

MeSH terms