. 2020 Apr 24;18(4):e3000700.
doi: 10.1371/journal.pbio.3000700. eCollection 2020 Apr.

TRIC-A shapes oscillatory Ca2+ signals by interaction with STIM1/Orai1 complexes

Affiliations

TRIC-A shapes oscillatory Ca2+ signals by interaction with STIM1/Orai1 complexes

Niroj Shrestha et al. PLoS Biol. .

Abstract

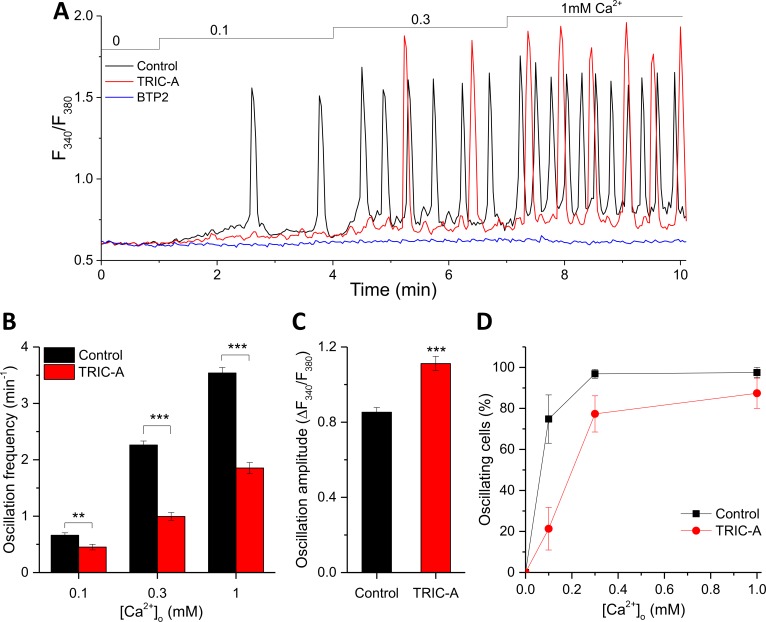
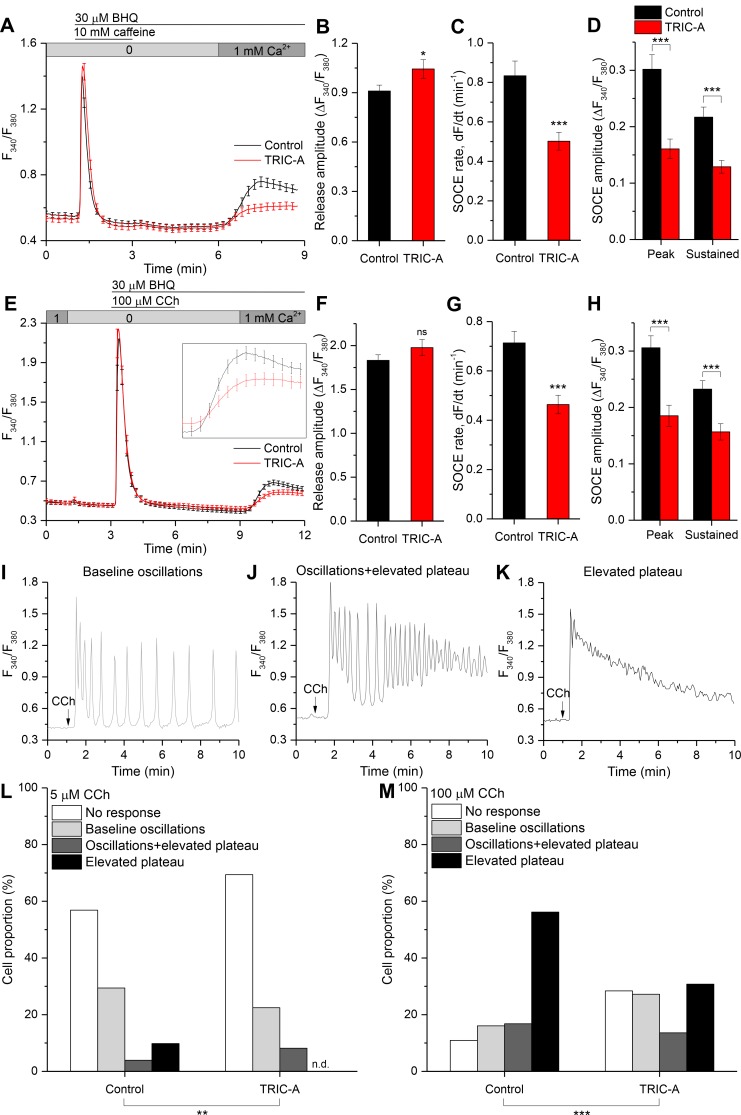
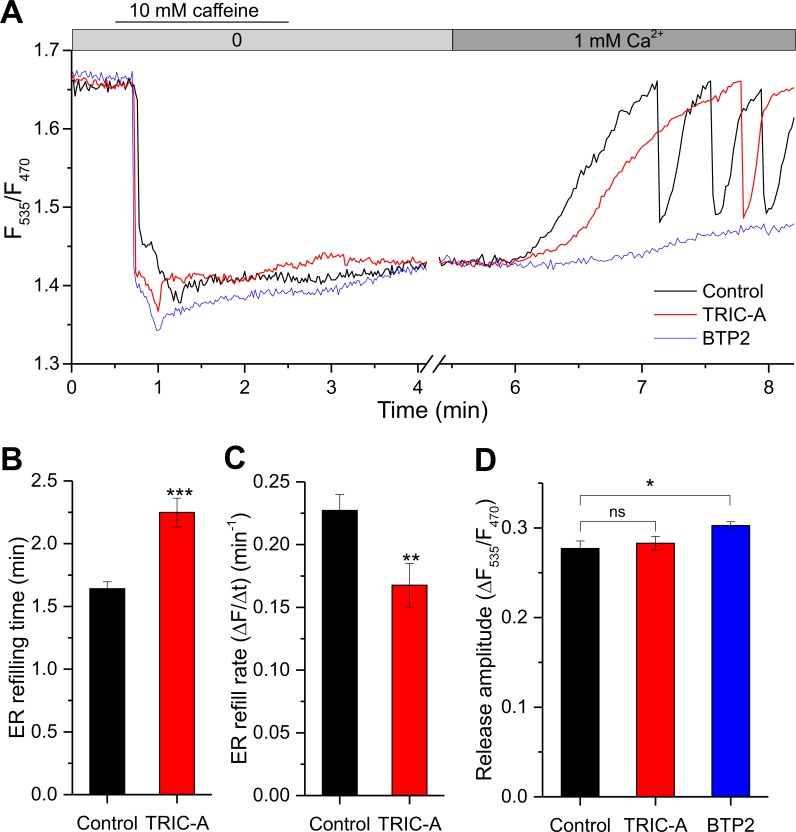
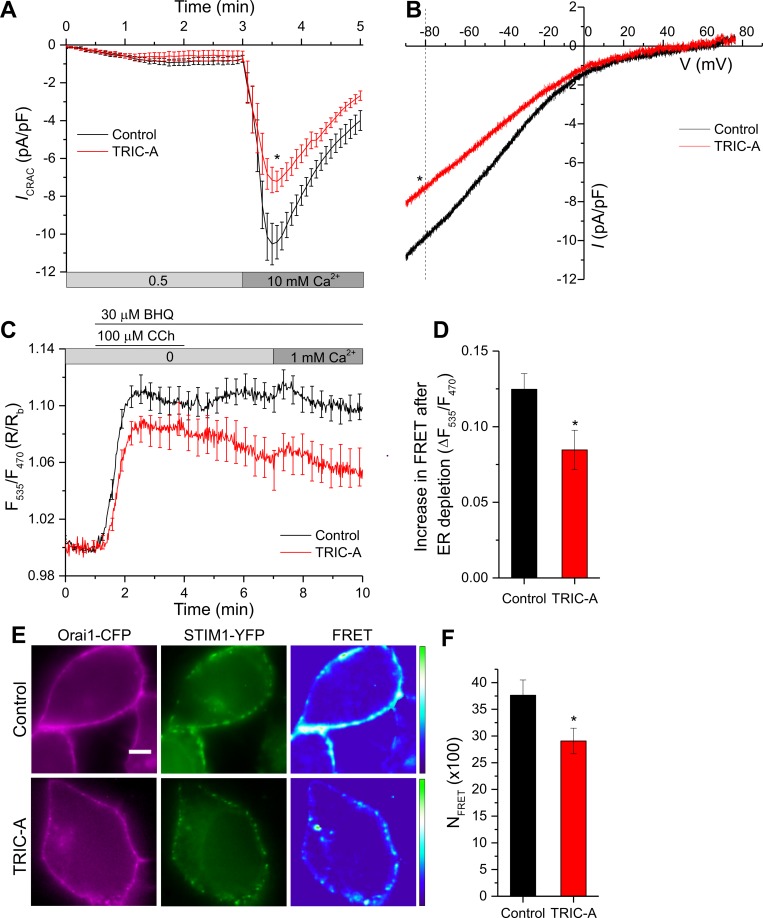
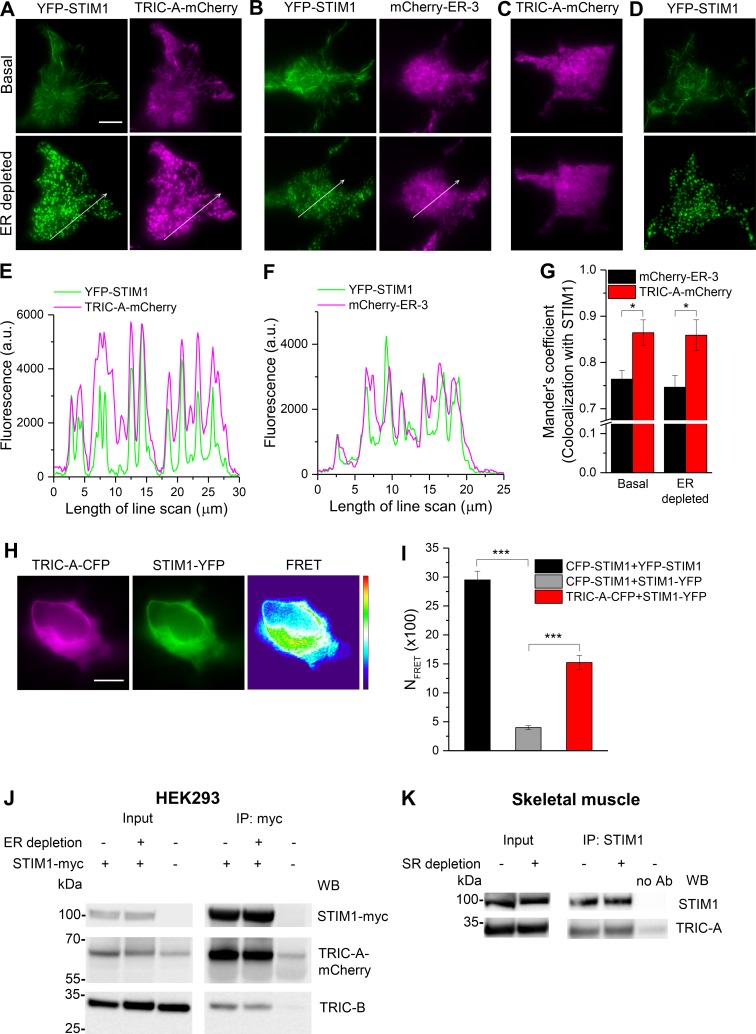
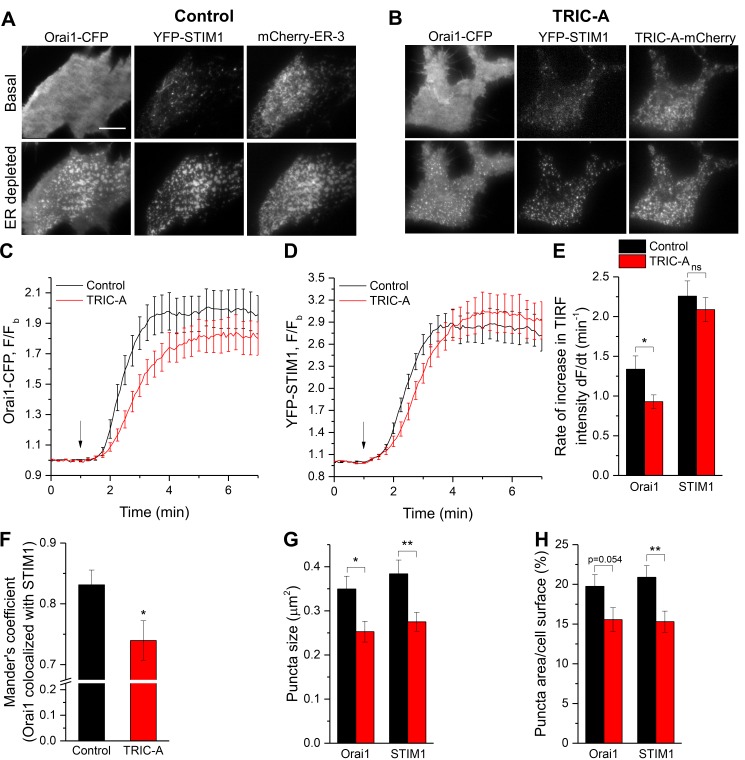
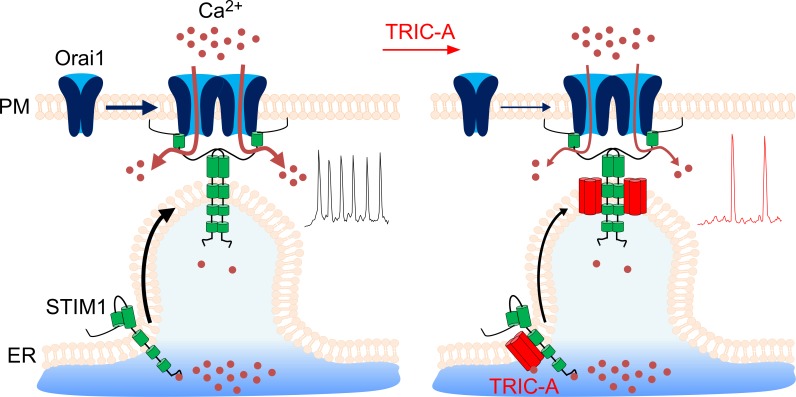
Trimeric intracellular cation (TRIC) channels have been proposed to modulate Ca2+ release from the endoplasmic reticulum (ER) and determine oscillatory Ca2+ signals. Here, we report that TRIC-A-mediated amplitude and frequency modulation of ryanodine receptor 2 (RyR2)-mediated Ca2+ oscillations and inositol 1,4,5-triphosphate receptor (IP3R)-induced cytosolic signals is based on attenuating store-operated Ca2+ entry (SOCE). Further, TRIC-A-dependent delay in ER Ca2+ store refilling contributes to shaping the pattern of Ca2+ oscillations. Upon ER Ca2+ depletion, TRIC-A clusters with stromal interaction molecule 1 (STIM1) and Ca2+-release-activated Ca2+ channel 1 (Orai1) within ER-plasma membrane (PM) junctions and impairs assembly of the STIM1/Orai1 complex, causing a decrease in Orai1-mediated Ca2+ current and SOCE. Together, our findings demonstrate that TRIC-A is a negative regulator of STIM1/Orai1 function. Thus, aberrant SOCE could contribute to muscle disorders associated with loss of TRIC-A.


Conflict of interest statement

The authors have declared that no competing interests exist.

Figures

Fig 1
Fig 1. TRIC-A modifies the frequency and amplitude of RyR2-mediated cytosolic Ca2+ oscillations.
(A) Traces of cytosolic Ca2+-sensitive Fura-2 ratio, representing SOICR-associated oscillations in mCherry-ER-3– (control, black) or TRIC-A-mCherry–transfected (TRIC-A, red) HEK293_RyR2 cell and lack of oscillations in 3 μM BTP2-incubated (BTP2, blue) control cell. (B) Ca2+ oscillation frequency at 0.1, 0.3, and 1 mM [Ca2+]o, (C) amplitude at 1 mM [Ca2+]o, and (D) proportion of oscillating cells in TRIC-A cells (n = 88) versus controls (n = 81); **p < 0.01, ***p < 0.001; mean ± SEM values are shown. Underlying data in panels (A–D) are included in S1 Data. BTP2, N-[4-[3,5-Bis(trifluoromethyl)pyrazol-1-yl]phenyl]-4-methylthiadizole-5-carboxamide; ER, endoplasmic reticulum; Fura-2, cytosolic Ca2+-sensitive fluorescent indicator; HEK293, human embryonic kidney 293; RyR, ryanodine receptor; SOICR, store-overload–induced Ca2+ release; TRIC, trimeric intracellular cation.
Fig 2
Fig 2. TRIC-A attenuates SOCE irrespective of RyR2 expression and dampens associated [Ca2+]i responses to low and high stimuli levels.
Average cytosolic Ca2+-sensitive Fura-2 traces in mCherry-ER-3 (control, black) or TRIC-A-mCherry (TRIC-A, red) transfected (A) HEK293_RyR2 cells and (E) wild-type HEK293 cells, showing SOCE after ER Ca2+ depletion with 10 mM caffeine + 30 μM BHQ and 100 μM CCh + 30 μM BHQ, respectively. Inset in (E) shows an enlarged phase of SOCE. Bar graphs show (B) ER Ca2+ release peak amplitude, (C) SOCE rate, and (D) peak and sustained SOCE amplitude in (A) TRIC-A (+) (n = 42) versus control (n = 49) HEK293_RyR2 cells. (F–H) show similar bar graphs as in (B–D) for (E) TRIC-A (+) (n = 30) versus control (n = 38) wild-type HEK293 cells. *p < 0.05, ***p < 0.001; mean values ± SEM are shown. (I–K) Representative traces showing various [Ca2+]i responses in HEK293 cells stimulated with 5 or 100 μM CCh (arrow). Proportion (%) of cell population displaying various patterns of [Ca2+]i response to (L) 5 μM and (M) 100 μM CCh. Overall patterns in TRIC-A (+) cells (n = 98 at 5 μM, n = 169 at 100 μM) were significantly different from that in controls (n = 102 at 5 μM, n = 137 at 100 μM); **p < 0.01,***p < 0.001; χ2 test. Underlying data in panels (A–M) are included in S1 Data. BHQ, 2,5-Di-t-butyl-1,4-benzohydroquinone; CCh, carbachol; ER, endoplasmic reticulum; Fura-2, cytosolic Ca2+-sensitive fluorescent indicator; HEK293, human embryonic kidney 293; ns, nonsignificant; RyR, ryanodine receptor; SOCE, store-operated Ca2+ entry; TRIC, trimeric intracellular cation.
Fig 3
Fig 3. TRIC-A delays cyclic Ca2+ refilling upon store depletion.
(A) [Ca2+]ER-sensitive D1ER traces representing ER Ca2+ depletion with 10 mM caffeine, followed by ER refilling upon 1 mM [Ca2+]o addition in an mCherry-ER-3– (control, black) or TRIC-A-mCherry (TRIC-A, red)–transfected HEK293_RyR2 cell or diminished refilling in a 3 μM BTP2-incubated control cell (BTP2, blue). Bar graphs show mean ± SEM values for (B) ER refilling time and (C) ER refill rate in TRIC-A (+) cells (n = 45) versus controls (n = 51), and (D) ER Ca2+ release peak amplitude in TRIC-A (+) cells (n = 45) and BTP2-incubated cells (n = 36) versus controls (n = 51); *p < 0.05, **p < 0.01, ***p < 0.001. Underlying data in panels (A–D) are included in S1 Data. BTP2, N-[4-[3,5-Bis(trifluoromethyl)pyrazol-1-yl]phenyl]-4-methylthiadiazole-5-carboxamide; D1ER, genetically encoded ER-targeted Ca2+ sensor; ER, endoplasmic reticulum; HEK293, human embryonic kidney 293; ns, nonsignificant; RyR, ryanodine receptor; TRIC, trimeric intracellular cation.
Fig 4
Fig 4
TRIC-A inhibits Orai1-mediated ICRAC (A, B) and STIM1–Orai1 interaction (C–F) upon store depletion. (A) Whole-cell voltage-clamp experiments show time course of ICRAC at −80 mV mediated by YFP-STIM1 + Orai1-CFP, coexpressed along with mCherry-ER-3 (control, n = 13) or TRIC-A-mCherry (TRIC-A, n = 11) in HEK293 cells. Current activation was mediated by ER store depletion with 10 mM EGTA in the patch pipette solution, and stepwise current increment was recorded at 0.5 and 10 mM Ca2+ in the bath solution. (B) Traces show representative peak I–V relationship in control and TRIC-A groups at 10 mM Ca2+. (C) Traces show dynamic FRET between STIM1-CFP and YFP-Orai1, co-transfected in HEK293 cells along with mCherry-ER-3 (control, n = 20) or TRIC-A-mCherry (TRIC-A, n = 13). (D) Increase in STIM1-Orai1 FRET shown in (C) upon ER depletion with 100 μM CCh + 30 μM BHQ in TRIC-A cells versus controls. (E) Representative epifluorescence images of ER-depleted (100 μM CCh + 30 μM BHQ) HEK293 cell expressing Orai1-CFP (left, magenta) + STIM1-YFP (middle, green) and corresponding FRET (right) in absence (Control, top) and presence (TRIC-A, bottom) of coexpressed TRIC-A. Scale bar = 5 μm. (F) Bars show NFRET (× 100) in TRIC-A-transfected cells (n = 15) versus controls (n = 16). *p < 0.05, mean values ± SEM are shown. Underlying data in panels (A–D) and (F) are included in S1 Data. BHQ, 2,5-Di-t-butyl-1,4-benzohydroquinone; CCh, carbachol; CFP, cyan fluorescent protein; ER, endoplasmic reticulum; FRET, Förster resonance energy transfer; HEK293, human embryonic kidney 293; ICRAC, Ca2+ release-activated Ca2+ current; I–V, current–voltage; NFRET, normalized FRET; Orai1, Ca2+-release–activated Ca2+ channel 1; STIM1, stromal interaction molecule 1; TRIC, trimeric intracellular cation; YFP, yellow fluorescent protein.
Fig 5
Fig 5. TRIC-A interacts with STIM1 and coclusters at ER–PM junctions upon store depletion.
Representative TIRF images of basal (top) and ER-depleted (100 μM CCh + 30 μM BHQ) (bottom) HEK293 cell expressing (A) YFP-STIM1 (left, green) and TRIC-A-mCherry (right, magenta), (B) YFP-STIM1 (left, green) and mCherry-ER-3 (right, magenta), and (C) TRIC-A-mCherry, and (D) YFP-STIM1. Scale bar = 10 μm. (E, F) Line scans of proteins in ER-depleted cell shown in (A, B). (G) Mean ± SEM bars show Mander’s coefficient for proportion of mCherry-ER-3 (n = 9) and TRIC-A-mCherry (n = 8) colocalized with STIM1 under basal and ER-depleted conditions, *p < 0.05. (H) Representative epifluorescence images of HEK293 cell coexpressing TRIC-A-CFP (left, magenta) and STIM1-YFP (middle, green) and corresponding FRET (right). Scale bar = 10 μm. (I) Bars show mean ± SEM values for NFRET (× 100) of TRIC-A-CFP + STIM1-YFP (n = 30) compared to CFP-STIM1 + YFP-STIM1 (positive control, n = 10) and CFP-STIM1 + STIM1-YFP (negative control, n = 12), ***p <0.001. (J, K) Representative Co-IP of (J) TRIC-A-mCherry and TRIC-B with STIM1-myc in HEK293 cells and (K) TRIC-A with STIM1 in murine skeletal muscles. Lysates were obtained from (J) basal (−) and ER-depleted (+) (100 μM CCh + 30 μM BHQ) HEK293 cells and (K) basal (−) and SR-depleted (+) (30 mM caffeine + 30 μM BHQ) murine skeletal muscles, n = 3 independent experiments. Underlying data in panels (E–G) and (I) are included in S1 Data. a.u., arbitrary unit; BHQ, 2,5-Di-t-butyl-1,4-benzohydroquinone; CCh, carbachol; CFP, cyan fluorescent protein; Co-IP, coimmunoprecipitation; ER, endoplasmic reticulum; FRET, Förster resonance energy transfer; HEK293, human embryonic kidney 293; NFRET, normalized FRET; PM, plasma membrane; SR, sarcoplasmic reticulum; STIM1, stromal interaction molecule 1; TIRF, total internal reflection fluorescence; TRIC, trimeric intracellular cation; WB, western blot; YFP, yellow fluorescent protein.
Fig 6
Fig 6. TRIC-A affects kinetics and extent of STIM1-Orai1 puncta formation upon store depletion.
(A, B) TIRF images of basal (top) and ER-depleted (100 μM CCh + 30 μM BHQ) (bottom) cell expressing Orai1-CFP (left, Orai1) and YFP-STIM1 (middle, STIM1) along with mCherry-ER-3 (right) (A, control) or TRIC-A-mCherry (right) (B, TRIC-A). Scale bar = 10 μm. (C, D) Traces show kinetics of Orai1-CFP and YFP-STIM1 TIRF intensity upon ER depletion (arrow) in TRIC-A (+) cells versus controls (n = 18 each). (E) Rate of increase in Orai1 and STIM1 TIRF intensity upon ER depletion shown in (C, D). (F) Mander’s coefficient showing proportion of Orai1 colocalized with STIM1, (G) average puncta size (μm2), and (H) puncta area relative to cell surface area (%) of Orai1 and STIM1 in TRIC-A (+) cells versus controls. *p < 0.05, **p < 0.01; mean values ± SEM are shown. Underlying data in panels (C–H) are included in S1 Data. BHQ, 2,5-Di-t-butyl-1,4-benzohydroquinone; CCh, carbachol; CFP, cyan fluorescent protein; ER, endoplasmic reticulum; Orai1, Ca2+-release–activated Ca2+ channel 1; STIM1, stromal interaction molecule 1; TIRF, total internal reflection fluorescence; TRIC, trimeric intracellular cation; YFP, yellow fluorescent protein.
Fig 7
Fig 7. Schematic diagram illustrating the role of TRIC-A in limiting SOCE and oscillatory Ca2+ signals by interfering with STIM1/Orai1 complex assembly.
Left: Upon ER Ca2+ depletion via RyR/IP3R, STIM1 loses bound Ca2+ from its EF-hand, undergoes a conformational change, oligomerizes, and translocates into clusters at ER–PM junctions. STIM1 then recruits Orai1 channels into the clusters and activates the Ca2+-selective pore for subsequent Ca2+ entry into the cells to sustain RyR/IP3R-triggered Ca2+ oscillations. Right: TRIC-A translocates along with STIM1 to ER–PM junctions, where it interferes with STIM1/Orai1 coupling, which consequently limits the Ca2+ influx via Orai1 (SOCE) and the frequency of cytosolic Ca2+ oscillations. ER, endoplasmic reticulum; ICRAC, Ca2+ release-activated Ca2+ current; IP3R, inositol 1,4,5-triphosphate receptor; Orai1, Ca2+-release–activated Ca2+ channel 1; PM, plasma membrane; RyR, ryanodine receptor; SOCE, store-operated Ca2+ entry; STIM1, stromal interaction molecule 1; TRIC, trimeric intracellular cation.

Comment in

References

    1. Yazawa M, Ferrante C, Feng J, Mio K, Ogura T, Zhang M, et al. TRIC channels are essential for Ca2+ handling in intracellular stores. Nature. 2007;448(7149):78–82. 10.1038/nature05928 . - DOI - PubMed
    1. Yang H, Hu M, Guo J, Ou X, Cai T, Liu Z. Pore architecture of TRIC channels and insights into their gating mechanism. Nature. 2016;538(7626):537–41. 10.1038/nature19767 . - DOI - PubMed
    1. Kasuya G, Hiraizumi M, Maturana AD, Kumazaki K, Fujiwara Y, Liu K, et al. Crystal structures of the TRIC trimeric intracellular cation channel orthologues. Cell Res. 2016;26(12):1288–301. 10.1038/cr.2016.140 - DOI - PMC - PubMed
    1. Wang XH, Su M, Gao F, Xie W, Zeng Y, Li DL, et al. Structural basis for activity of TRIC counter-ion channels in calcium release. Proc Natl Acad Sci U S A. 2019;116(10:4238–4243. 10.1073/pnas.1817271116 . - DOI - PMC - PubMed
    1. Yamazaki D, Tabara Y, Kita S, Hanada H, Komazaki S, Naitou D, et al. TRIC-A channels in vascular smooth muscle contribute to blood pressure maintenance. Cell Metab. 2011;14(2):231–41. 10.1016/j.cmet.2011.05.011 . - DOI - PubMed

Publication types

MeSH terms