. 2020 May 14;181(4):914-921.e10.
doi: 10.1016/j.cell.2020.04.011. Epub 2020 Apr 23.

The Architecture of SARS-CoV-2 Transcriptome

Affiliations

The Architecture of SARS-CoV-2 Transcriptome

Dongwan Kim et al. Cell. .

Abstract

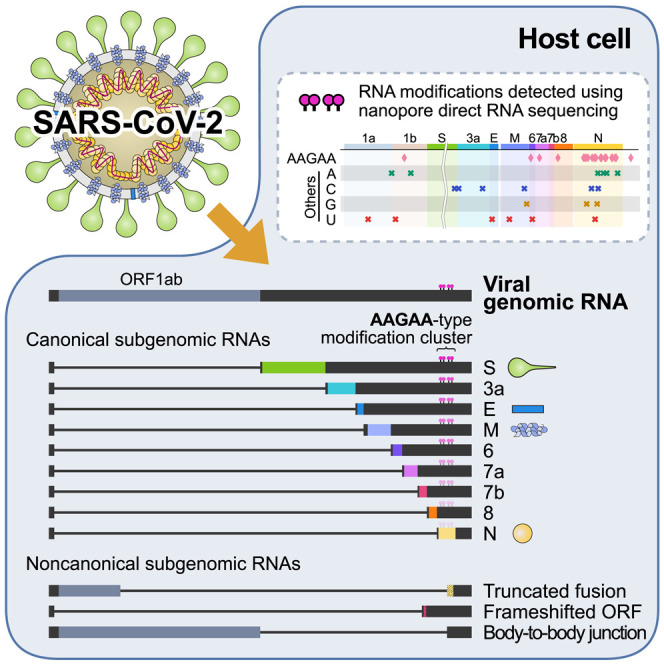
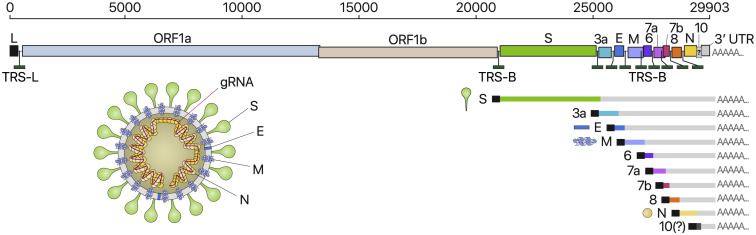
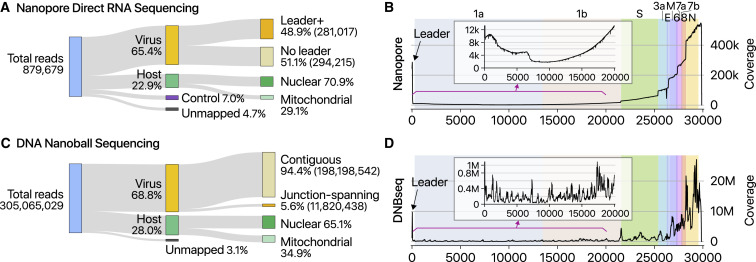
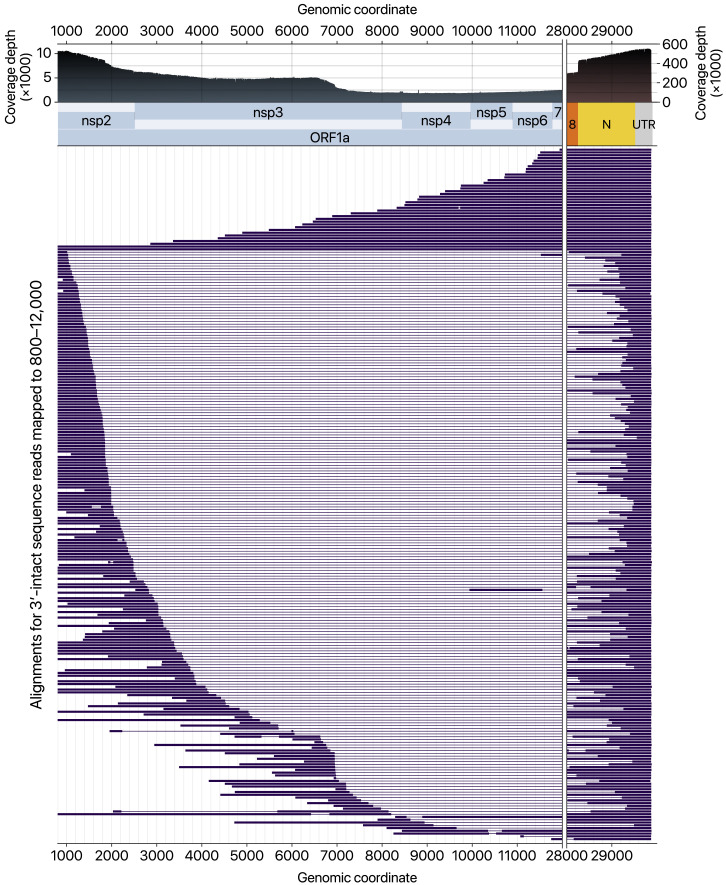
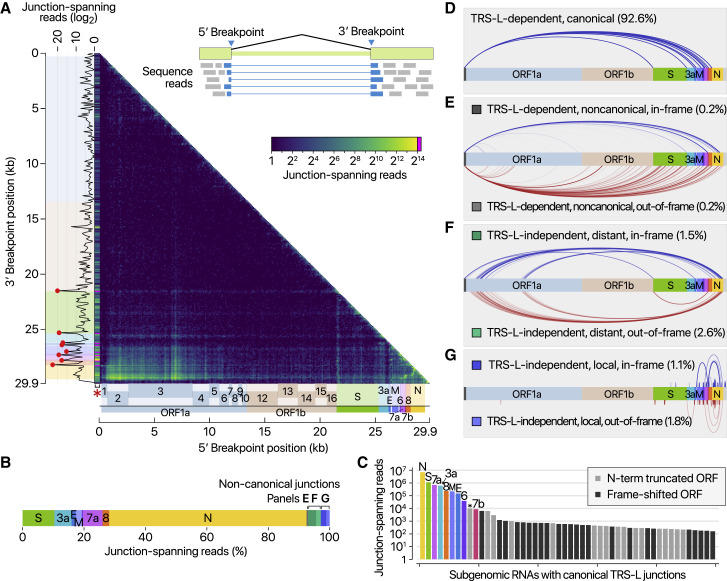
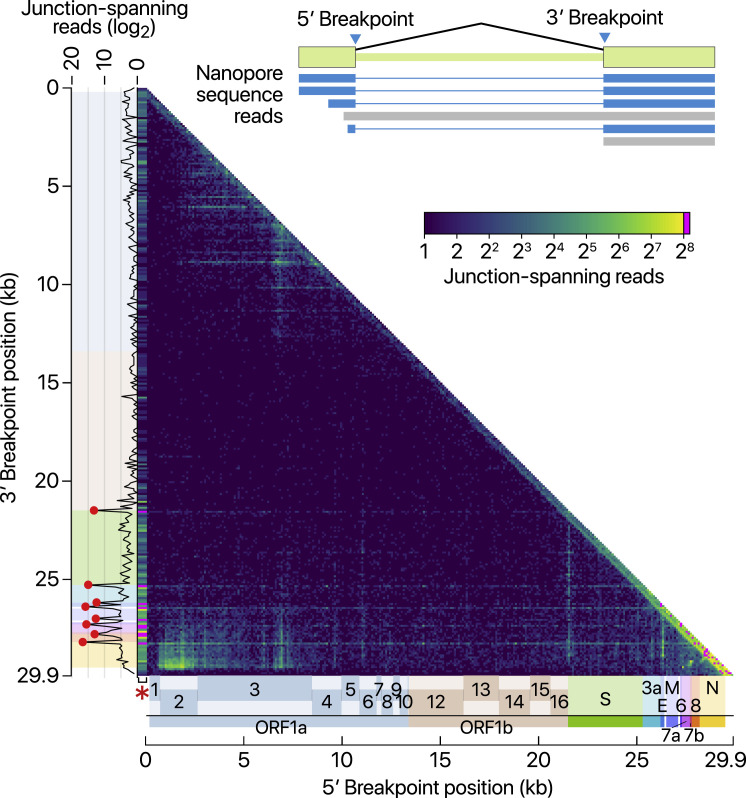
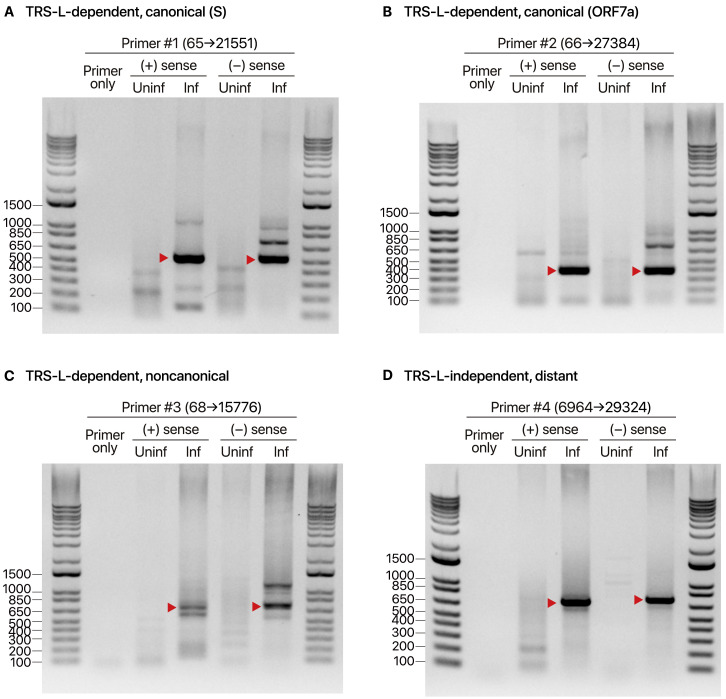
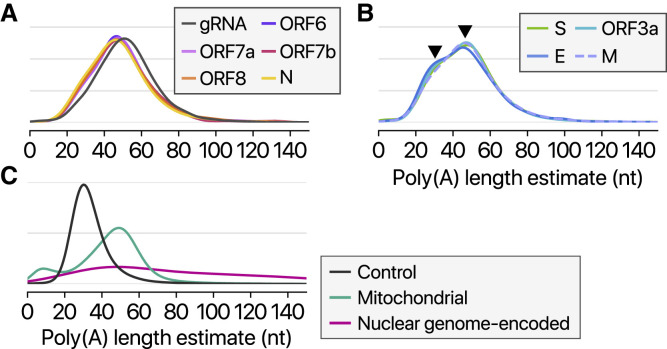
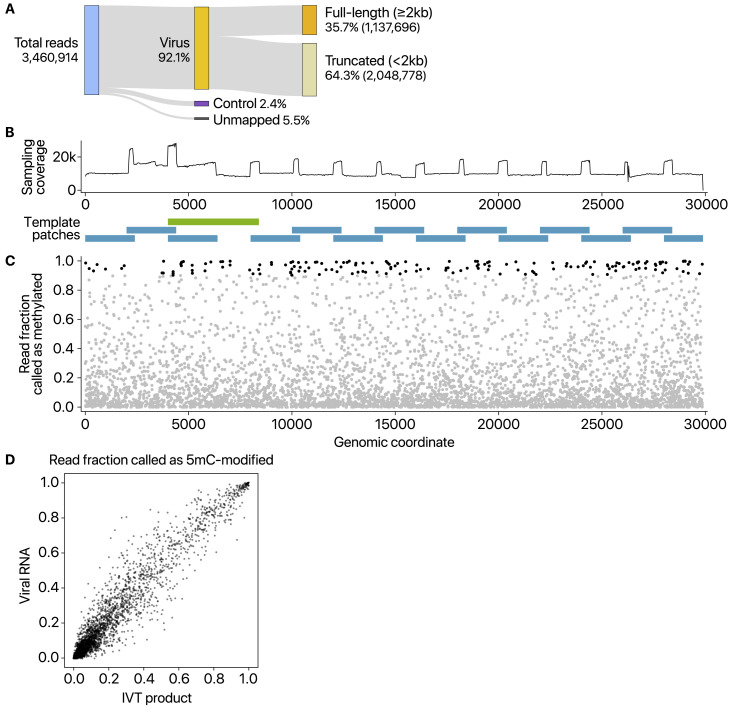
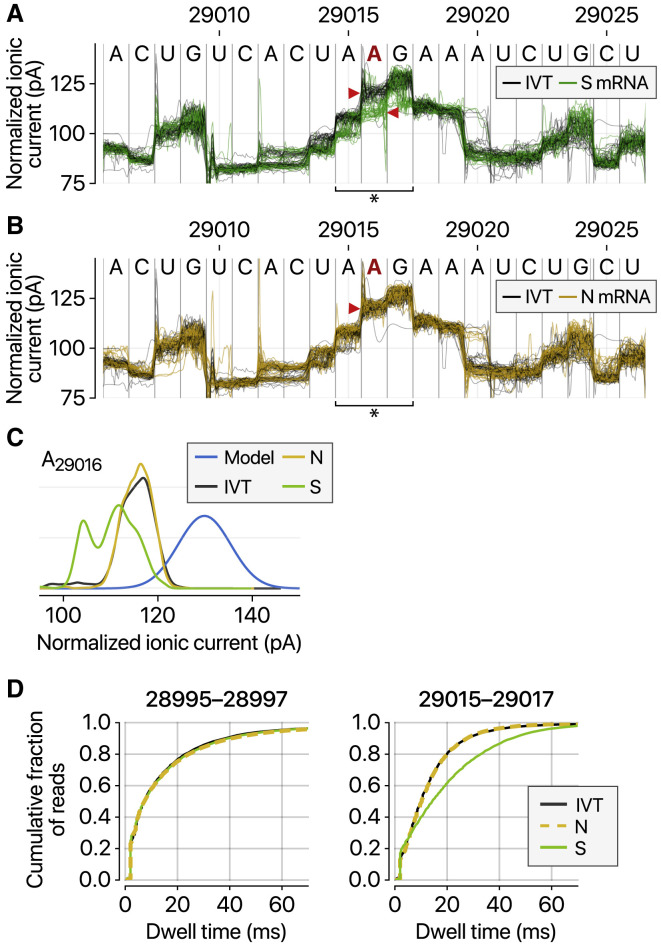
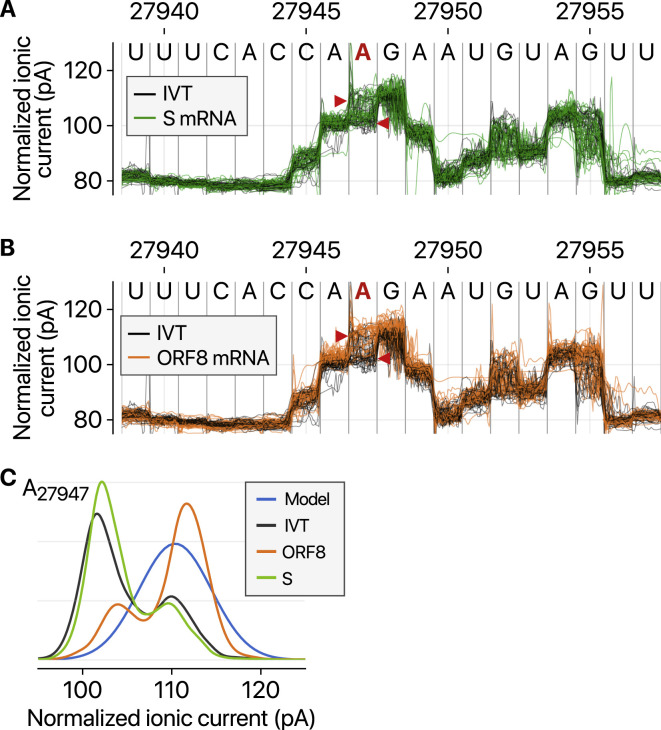
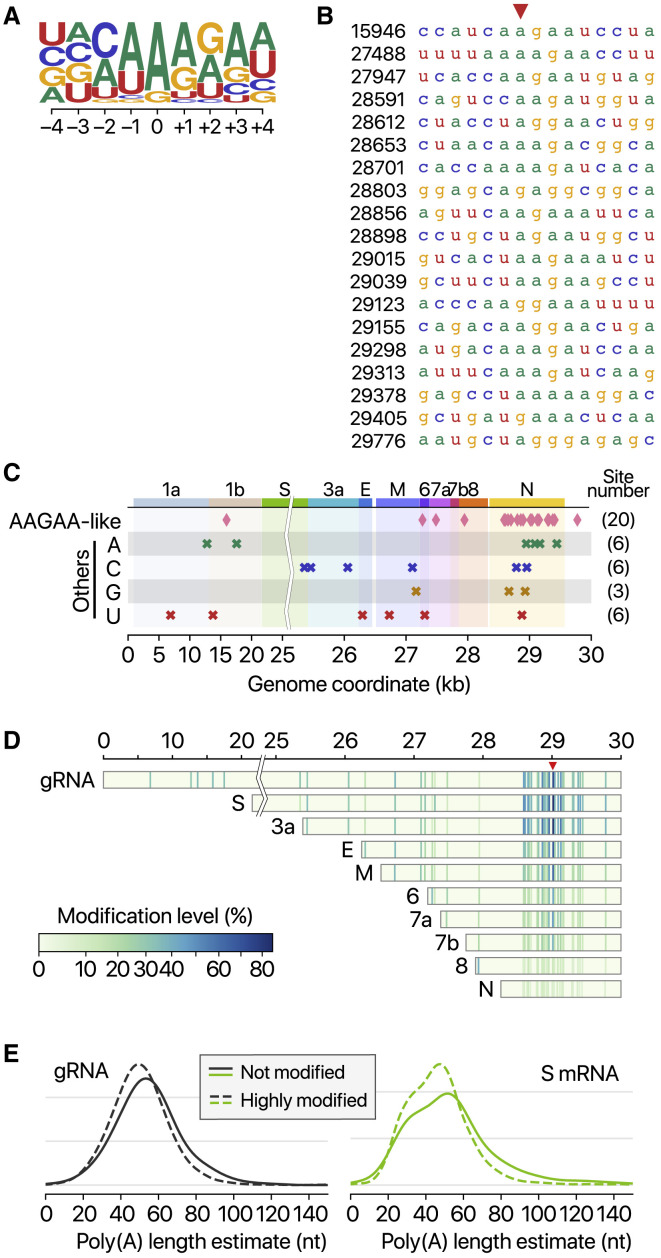
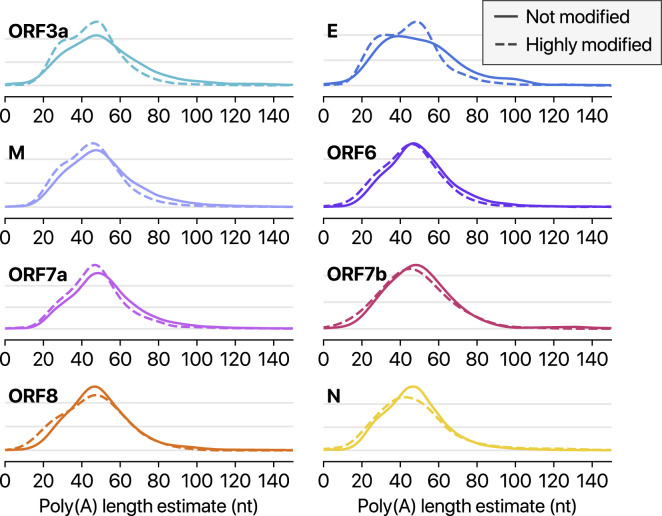
SARS-CoV-2 is a betacoronavirus responsible for the COVID-19 pandemic. Although the SARS-CoV-2 genome was reported recently, its transcriptomic architecture is unknown. Utilizing two complementary sequencing techniques, we present a high-resolution map of the SARS-CoV-2 transcriptome and epitranscriptome. DNA nanoball sequencing shows that the transcriptome is highly complex owing to numerous discontinuous transcription events. In addition to the canonical genomic and 9 subgenomic RNAs, SARS-CoV-2 produces transcripts encoding unknown ORFs with fusion, deletion, and/or frameshift. Using nanopore direct RNA sequencing, we further find at least 41 RNA modification sites on viral transcripts, with the most frequent motif, AAGAA. Modified RNAs have shorter poly(A) tails than unmodified RNAs, suggesting a link between the modification and the 3' tail. Functional investigation of the unknown transcripts and RNA modifications discovered in this study will open new directions to our understanding of the life cycle and pathogenicity of SARS-CoV-2.

Keywords: COVID-19; RNA modification; SARS-CoV-2; coronavirus; direct RNA sequencing; discontinuous transcription; epitranscriptome; nanopore; poly(A) tail; transcriptome.


Conflict of interest statement

Declaration of Interests The authors declare no competing interests.

Figures

None
Graphical abstract
Figure 1
Figure 1
Schematic Presentation of the SARS-CoV-2 Genome Organization, the Canonical Subgenomic mRNAs, and the Virion Structure From the full-length genomic RNA (29,903 nt) that also serves as an mRNA, ORF1a and ORF1b are translated. In addition to the genomic RNA, nine major subgenomic RNAs are produced. The sizes of the boxes representing small accessory proteins are bigger than the actual size of the ORF for better visualization. The black box indicates the leader sequence. Note that our data show no evidence for ORF10 expression.
Figure 2
Figure 2
Statistics of Sequencing Data (A) Read counts from nanopore direct RNA sequencing of total RNA from Vero cells infected with SARS-CoV-2. “Leader+” indicates the viral reads that contain the 5′ end leader sequence. “No leader” denotes the viral reads lacking the leader sequence. “Nuclear” reads match mRNAs from the nuclear chromosome while “mitochondrial” reads are derived from the mitochondrial genome. “Control” indicates quality control RNA for nanopore sequencing. (B) Genome coverage of the nanopore direct RNA sequencing data shown in (A). The stepwise reduction in coverage corresponds to the borders expected for the canonical sgRNAs. The smaller inner plot magnifies the 5′ part of the genome. (C) Read counts from DNA nanoball sequencing using MGISEQ. Total RNA from Vero cells infected with SARS-CoV-2 was used for sequencing. (D) Genome coverage of the DNA nanoball sequencing (DNB-seq) data shown in (C). See also Figure S1.
Figure S1
Figure S1
Subgenomic RNAs with Large Deletions between nsp2/3 and N Regions, Related to Figure 2 Sequence alignments of the 3′-intact DRS reads mapped to the genomic interval 800–12,000. The x axis highlights two separate ranges. The filled black curves on top show the read coverage. Single read alignment is shown as a set of thick bars and lines connected. Thick bars on the alignments indicate contiguous mappings consisting of matches, mismatches, insertions, and small deletions. The lines show the large gaps longer than 50 nt.
Figure 3
Figure 3
Viral Subgenomic RNAs and Their Recombination Sites (A) Frequency of discontinuous mappings in the long reads from the DNB-seq data. The color indicates the number of reads with large gaps spanning between two genomic positions (starting from a coordinate in the x axis and ending in a coordinate in the y axis). The counts were aggregated into 100-nt bins for both axes. The red asterisk on the x axis indicates the column containing the leader TRS. Please note that the leftmost column was expanded horizontally on this heatmap to improve visualization. The red dots on the sub-plot alongside the y axis denote local peaks which coincide with the 5′ end of the body of each sgRNA. (B) Transcript abundance was estimated by counting the DNBseq reads that span the junction of the corresponding RNA. (C) Top 50 sgRNAs. The asterisk indicates an ORF beginning at 27,825 that may encode the 7b protein with an N-terminal truncation of 23 amino acids. The gray bars denote minor transcripts that encode proteins with an N-terminal truncation compared with the corresponding overlapping transcript. The black bars indicate minor transcripts that encode proteins in a different reading frame from the overlapping major mRNA. (D) Canonical discontinuous transcription that is mediated by TRS-L and TRS-B. (E) TRS-L-dependent noncanonical fusion between the leader TRS and a noncanonical 3′ site in the body. (F) TRS-L-independent long-distance (>5,000 nt) fusion. (G) TRS-L-independent local joining yielding a deletion between proximal sites (20–5,000 nt distance). See also Figures S2 and S3 and Tables S2, S3, and S4.
Figure S2
Figure S2
Map of Discontinuous Transcription Detected by Direct RNA Sequencing, Related to Figure 3 Frequency of discontinuous mappings in the long reads from the nanopore DRS data. The color indicates the number of reads with large gaps spanning between two genomic positions (starting from a coordinate in the x axis and ending in a coordinate in the y axis). The counts were aggregated into 100-nt bins for both axes. The red asterisk on the x axis indicates the column containing the leader TRS. Please note that the leftmost column containing the leader TRS was expanded horizontally on this heatmap to improve visualization. The red dots on the sub-plot alongside the y axis denote local peaks which coincide with the 5′ end of the body of each sgRNA.
Figure S3
Figure S3
Validation of Discontinuous Transcription Detected by RT-PCR, Related to Figure 3 To validate the sgRNAs found by sequencing, RT-PCR was performed to detect the sgRNAs and their negative-sense counterparts. (+) sense, cDNA from positive-strand specific reverse transcription; (−) sense, cDNA from negative-strand specific reverse transcription. ‘Primer only’ does not contain a cDNA template. cDNA from uninfected Vero cells (Uninf) were used as negative controls. Ladders are presented on the left (bp). A, RT-PCR spanning the canonical junction between TRS-L and the S ORF. B, RT-PCR spanning the canonical junction between TRS-L and the ORF7a. C, RT-PCR spanning the noncanonical junction between TRS-L and the middle of ORF1. D, RT-PCR spanning a noncanonical TRS-L-independent junction. The products were run on agarose gels. Red arrowheads denote the expected amplicons.
Figure 4
Figure 4
Length of Poly(A) Tail (A and B) Kernel density plots showing poly(A) tail length distribution of viral transcripts without (A) or with (B) a subpeak near 30 nt. Arrowheads indicate peaks at ~30 and ~45 nt. (C) Kernel density plots showing poly(A) tail length distribution of quality control RNA that has a 30-nt poly(A) tail, host mRNAs from the nuclear chromosome, or host RNAs from the mitochondrial chromosome.
Figure S4
Figure S4
False-Positive Calling of 5mC Modification Demonstrated by Using Unmodified Negative Control RNAs, Related to Figure 5 A, Read counts from nanopore direct RNA sequencing of in vitro transcribed (IVT) RNAs that have viral sequences. “Control” indicates quality control RNA for nanopore sequencing. B, The 15 partially overlapping patches cover the entire genome (blue rectangles at the bottom). Each RNA is ~2.3 kb in length. One fragment marked with a green rectangle is longer than others (~4.4 kb) to circumvent difficulties in the PCR amplification. The sequenced reads were downsampled so that every region is equally covered. The resulting balanced coverage is shown in the chart at the top. C, Detected 5mC modification from in vitro transcribed unmodified RNAs (IVT product) by the “alternative base detection” mode in Tombo. Black dots indicate the sites that satisfy the estimated false discovery rate cut-off calculated using unmodified yeast ENO2 mRNA (Viehweger et al., 2019). D, Comparison between the sites called from unmodified IVT products and those from viral RNAs expressed in Vero cells.
Figure 5
Figure 5
Frequent RNA Modification Sites (A) Distinct ionic current signals (“squiggles”) from viral S transcript (green lines) and in vitro transcribed control (IVT, black lines) indicate RNA modification at the genomic position 29,016. (B) The ionic current signals from viral N transcript at the genomic position 29,016 (yellow lines) are similar to those from IVT control (black lines), indicating that modification is rare on the N sgRNA. (C) Kernel density estimations of ionic current distribution at A29016. Blue line shows the signal distribution in the standard model of tombo 1.5. (D) Dwell time difference supports RNA modification. The dwell time of the region 29,015–29,017 of the S RNA (right) is significantly longer than those of IVT control and N RNAs. On the contrary, the neighboring region 28,995–28,997 of IVT, N, and S RNA is indistinguishable (left). See also Figures S4 and S5.
Figure S5
Figure S5
Detected Modified Sites in Viral RNAs, Related to Figure 5 A, Ionic current levels near the genomic position 27,947 in viral S RNA (green lines) and IVT control RNA (black lines). B, Ionic current levels for the identical region in the viral ORF8 RNA (orange lines) and IVT control RNA (black lines). C, Kernel density plots for signal distributions at the position 27,947 in the different RNAs. The blue line shows the standard model used for modification detections without controls (“alternative base detection” and “de novo” modes) in Tombo.
Figure 6
Figure 6
Detected RNA Modifications Are Differentially Regulated (A) Position-specific base frequency of a motif enriched in the frequently modified sites. (B) Sequence alignment of the detected modification sites with “AAGAA”-like motif. Base positions on the left hand side correspond to the genomic coordinates denoted with red arrowhead. (C) Genomic location of modification sites with the AAGAA-like motif (top row) and the others grouped by the detected nucleotide base. (D) Location and modification levels in different RNA species. (E) Kernel density plots showing poly(A) length distribution of gRNA (left) and S RNA (right). Modified viral RNAs carry shorter poly(A) tails. See also Figure S6 and Table S5.
Figure S6
Figure S6
Highly Modified Viral RNAs Carry Shorter Poly(A) Tails, Related to Figure 6 Poly(A) tail length distribution of each viral transcript other than shown in Figure 6.

References

    1. Courtney D.G., Kennedy E.M., Dumm R.E., Bogerd H.P., Tsai K., Heaton N.S., Cullen B.R. Epitranscriptomic Enhancement of Influenza A Virus Gene Expression and Replication. Cell Host Microbe. 2017;22:377–386. - PMC - PubMed
    1. Dobin A., Davis C.A., Schlesinger F., Drenkow J., Zaleski C., Jha S., Batut P., Chaisson M., Gingeras T.R. STAR: ultrafast universal RNA-seq aligner. Bioinformatics. 2013;29:15–21. - PMC - PubMed
    1. Furuya T., Lai M.M. Three different cellular proteins bind to complementary sites on the 5′-end-positive and 3′-end-negative strands of mouse hepatitis virus RNA. J. Virol. 1993;67:7215–7222. - PMC - PubMed
    1. Garalde D.R., Snell E.A., Jachimowicz D., Sipos B., Lloyd J.H., Bruce M., Pantic N., Admassu T., James P., Warland A. Highly parallel direct RNA sequencing on an array of nanopores. Nat. Methods. 2018;15:201–206. - PubMed
    1. Gokhale N.S., Horner S.M. RNA modifications go viral. PLoS Pathog. 2017;13:e1006188. - PMC - PubMed

Publication types