

Transcranial electrical stimulation motor threshold can estimate individualized tDCS dosage from reverse-calculation electric-field modeling
- PMID: 32330607
- PMCID: PMC7906246
- DOI: 10.1016/j.brs.2020.04.007
Transcranial electrical stimulation motor threshold can estimate individualized tDCS dosage from reverse-calculation electric-field modeling
Abstract
Background: Unique amongst brain stimulation tools, transcranial direct current stimulation (tDCS) currently lacks an easy or widely implemented method for individualizing dosage.
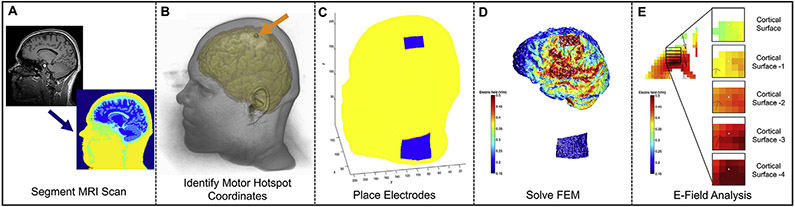
Objective: We developed a method of reverse-calculating electric-field (E-field) models based on Magnetic Resonance Imaging (MRI) scans that can estimate individualized tDCS dose. We also evaluated an MRI-free method of individualizing tDCS dose by measuring transcranial magnetic stimulation (TMS) motor threshold (MT) and single pulse, suprathreshold transcranial electrical stimulation (TES) MT and regressing it against E-field modeling. Key assumptions of reverse-calculation E-field modeling, including the size of region of interest (ROI) analysis and the linearity of multiple E-field models were also tested.
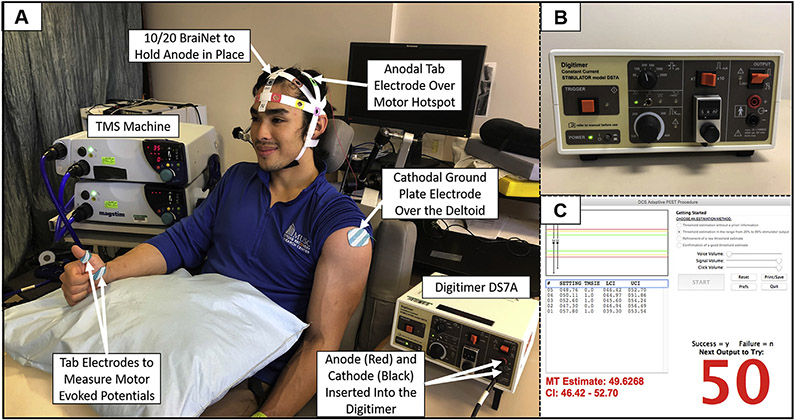
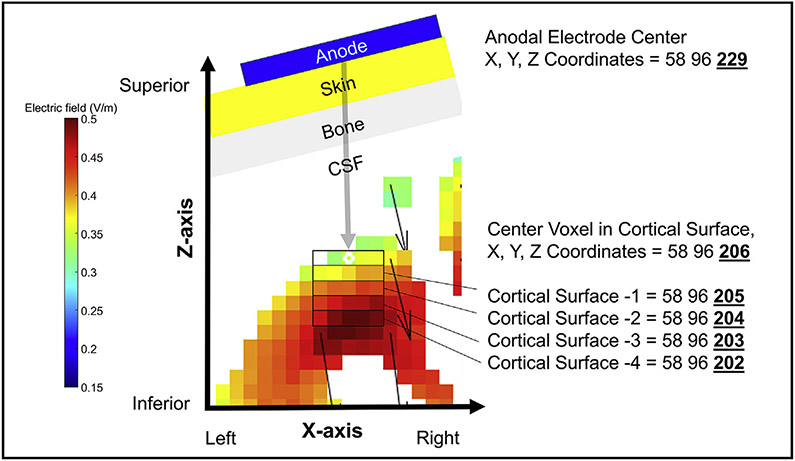
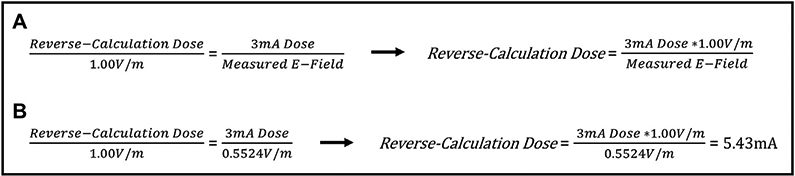
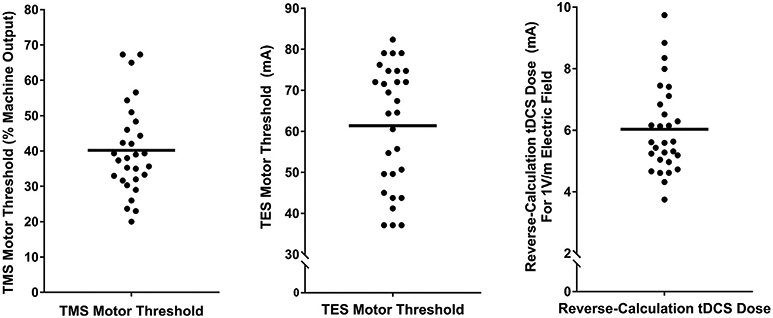
Methods: In 29 healthy adults, we acquired TMS MT, TES MT, and anatomical T1-weighted MPRAGE MRI scans with a fiducial marking the motor hotspot. We then computed a "reverse-calculated tDCS dose" of tDCS applied at the scalp needed to cause a 1.00 V/m E-field at the cortex. Finally, we examined whether the predicted E-field values correlated with each participant's measured TMS MT or TES MT.
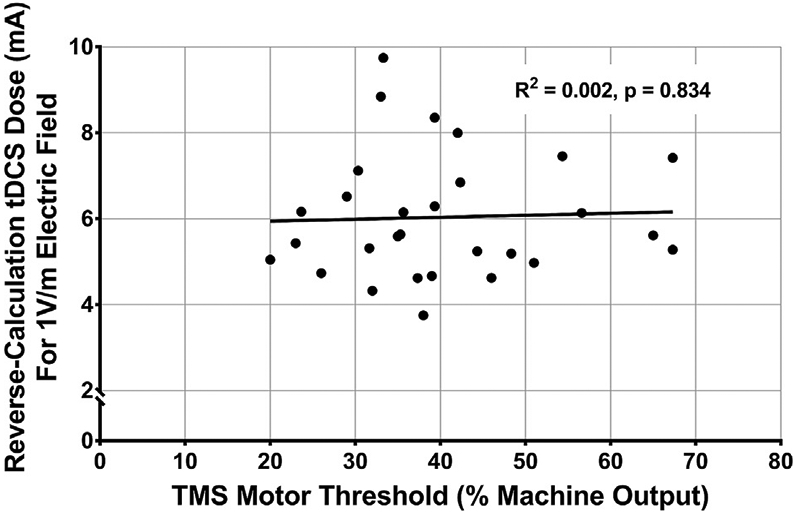
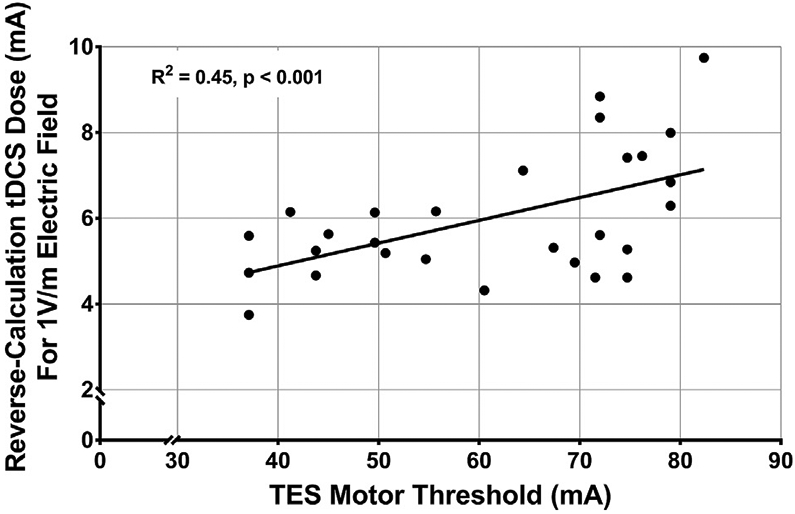
Results: We were able to determine a reverse-calculated tDCS dose for each participant using a 5 × 5 x 5 voxel grid region of interest (ROI) approach (average = 6.03 mA, SD = 1.44 mA, range = 3.75-9.74 mA). The Transcranial Electrical Stimulation MT, but not the Transcranial Magnetic Stimulation MT, significantly correlated with the ROI-based reverse-calculated tDCS dose determined by E-field modeling (R2 = 0.45, p < 0.001).
Conclusions: Reverse-calculation E-field modeling, alone or regressed against TES MT, shows promise as a method to individualize tDCS dose. The large range of the reverse-calculated tDCS doses between subjects underscores the likely need to individualize tDCS dose. Future research should further examine the use of TES MT to individually dose tDCS as an MRI-free method of dosing tDCS.
Keywords: Electric field modeling; Individualized dosing; Transcranial direct current stimulation; Transcranial electrical stimulation; Transcranial magnetic stimulation; tDCS; tDCS dosing.
Copyright © 2020 The Author(s). Published by Elsevier Inc. All rights reserved.
Conflict of interest statement
Declaration of competing interest Marom Bikson has equity in Soterix Medical. The City University of New York has patents on brain stimulation with Marom Bikson as consultant. Marom Bikson consults for Halo Neuroscience, Boston Scientific, and GSK. We confirm that there are no additional known conflicts of interest associated with this publication and there was no financial support for this work that could have influenced its outcome.
Figures
References
-
- Meron D, Hedger N, Garner M, Baldwin DS. Transcranial direct current stimulation (tDCS) in the treatment of depression: systematic review and metaanalysis of efficacy and tolerability. Neurosci Biobehav Rev 2015;57:46–62. - PubMed
-
- Fröhlich F, Burrello TN, Mellin JM, Cordle AL, Lustenberger CM, Gilmore JH, et al. Exploratory study of once-daily transcranial direct current stimulation (tDCS) as a treatment for auditory hallucinations in schizophrenia. Eur Psychiatr 2016;33:54–60. - PubMed
-
- Nitsche MA, Boggio PS, Fregni F, Pascual-Leone A. Treatment of depression with transcranial direct current stimulation (tDCS): a review. Exp Neurol 2009;219(1):14–9. - PubMed
Publication types
MeSH terms
Grants and funding
LinkOut - more resources
Full Text Sources
Medical
