. 2020 Apr 22;21(8):2921.
doi: 10.3390/ijms21082921.

G2M Cell Cycle Pathway Score as a Prognostic Biomarker of Metastasis in Estrogen Receptor (ER)-Positive Breast Cancer

Affiliations

G2M Cell Cycle Pathway Score as a Prognostic Biomarker of Metastasis in Estrogen Receptor (ER)-Positive Breast Cancer

Masanori Oshi et al. Int J Mol Sci. .

Abstract

The vast majority of breast cancer death is a result of metastasis. Thus, accurate identification of patients who are likely to have metastasis is expected to improve survival. The G2M checkpoint plays a critical role in cell cycle. We hypothesized that breast cancer tumors with high activity of G2M pathway genes are more aggressive and likely to metastasize. To test this, we used the single-sample gene set variation analysis method to calculate the score for the Hallmark G2M checkpoint pathway using gene expression data of a total of 4626 samples from 12 human breast cancer cohorts. As expected, a high G2M pathway score correlated with enriched tumor expression of other cell proliferation-related gene sets. The score was significantly associated with clinical aggressive features of tumors and patient survival in estrogen receptor (ER)-positive/human epidermal growth factor receptor 2 (HER2)-negative breast cancer. Interestingly, a high G2M score of metastasis tumors was also significantly associated with worse survival. In primary as well as metastasis tumors with high scores, the infiltration of both pro- and anti-cancerous immune cells increased. Tumor G2M score was also associated with treatment response to systemic chemotherapy in ER-positive/HER2-negative cancer, and was predictive of response to cyclin-dependent kinase inhibition therapy.

Keywords: G2M; biomarker; breast cancer; cell cycle; gene set; metastasis; pathway analysis; tumor gene expression.


Conflict of interest statement

The authors declare no conflict of interest. The funders had no role in the design of the study; in the collection, analyses, or interpretation of data; in the writing of the manuscript, or in the decision to publish the results.

Figures

Figure 1
Figure 1
Hallmark gene sets with a significant enrichment in high G2M pathway score tumors. Gene set enrichment plots along with normalized enrichment score (NES) and false discovery rate (FDR) are shown for the eight gene sets for which enrichment was seen in tumors with high compared with low G2M pathway activity score in both The Cancer Genome Atlas (TCGA) and Molecular Taxonomy of breast Cancer International Consortium (METABRIC) cohorts. The G2M score was calculated from tumor gene expression as the single-sample gene set variation analysis score for the Hallmark G2M gene set, and the within-cohort median value was used to identify tumors with high and low scores. NES and FDR were determined with the classical gene set enrichment analysis (GSEA) method.
Figure 2
Figure 2
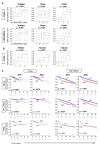
G2M pathway activity score and tumor characteristics and patient survival. (A). Tukey boxplots depict G2M scores among TCGA and METABRIC tumors of different grades, American Joint Committee on Cancer clinical stages, and subtypes. (B). Tukey boxplots depict G2M scores among TCGA tumors of different mitotic, nuclear, and tubular Nottingham histological scores. p-values for A and B are calculated using one-way analysis of variance (ANOVA). (C). Kaplan–Meier survival plots comparing patients with tumors with high and low G2M scores along with logrank test p-values are shown for disease-free (DFS) and disease-specific (DSS) survival for the entire cohort (Whole), or its sub-groups of estrogen receptor (ER)-positive/human epidermal growth factor receptor (HER2)-negative and triple negative (TNBC) patients. The G2M score was calculated from tumor gene expression as the single-sample gene set variation analysis score for the Hallmark G2M gene set, and within-cohort median value was used to identify tumors with high and low scores.
Figure 3
Figure 3
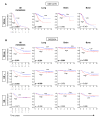
(A) The Kaplan–Meier survival plots depicting metastasis-free survival for metastasis to lung, brain, or bone based on G2M pathway score of the primary tumors in the GSE12276 and (B) in the GSE2034 cohort. In the GSE2034, metastasis-free survival was demonstrated in the whole cohort, ER+, and TNBC subtypes. The median value of the G2M pathway score was used to divide patients into low and high groups. ER, estrogen receptor; TNBC, triple negative breast cancer.
Figure 4
Figure 4
(A) Boxplots of the G2M pathway score of primary and each metastatic tumor, and matched pair comparison of G2M pathway scores between the primary and each metastatic tumor, including lymph node, brain, liver, lung and others in GSE110590 cohort. The PAM50 subtypes of cancer are indicated. (B) Boxplots of G2M pathway score of primary and each metastatic tumor, and Kaplan–Meier plots with logrank test p-values; progression-free survival (PFS) between the high- and low-G2M pathway score groups within different metastatic sites in the GSE124647 cohort. The median value of the G2M pathway score was used to divide patients into low and high groups.
Figure 5
Figure 5
Boxplots of immune cells, CD8 T cell, CD4 memory T cell, T helper cell type 1 and 2, M1 and M2 macrophage, and regulatory T cells depicting the high and low G2M scores (A) in primary tumors and (B) in metastatic tumors.
Figure 6
Figure 6
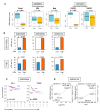
(A) Boxplots depicting the scores of pre- and post- treatment using the GSE28844 and GSE33658 cohorts. GSE28844 used neoadjuvant chemotherapy and GSE33658 used endocrine therapy. In GSE28844, response was categorized as Miller–Payne criteria. RECIST criteria were used for GSE33658. (B) Bar plots depicting the pCR rates between high- and low G2M pathway score groups among patients with ER-positive/HER2-negative tumors and TNBCs in the GSE25066 (n = 508), GSE32646 (n = 115), and GSE20194 (n = 278) cohorts. (C) Kaplan–Meier plots with logrank test p-values; DFS between the high- and low-G2M pathway score groups. ER-positive/HER2-negative and TNBC patients in the GSE25066 cohort. (D) Correlation plot between the G2M pathway score and fold-change (FC) and area under the curve (AUC) using the GSE36139 cohort. AUC, area under the curve; CR, complete response; DFS, disease-free survival; ER, estrogen-receptor; FC, fold-change; pCR, pathological complete response; PD, progressive disease; PR, partial response; RECIST, The Response Evaluation Criteria in Solid Tumors; SD, stable disease; TNBC, triple-negative breast cancer.

References

    1. Miller K.D., Nogueira L., Mariotto A.B., Rowland J.H., Yabroff K.R., Alfano C.M., Jemal A., Kramer J.L., Siegel R.L. Cancer treatment and survivorship statistics, 2019. CA Cancer J. Clin. 2019;69:363–385. doi: 10.3322/caac.21565. - DOI - PubMed
    1. Hanahan D., Weinberg R.A. The hallmarks of cancer. Cell. 2000;100:57–70. doi: 10.1016/S0092-8674(00)81683-9. - DOI - PubMed
    1. Chen G.L., Yang L., Rowe T.C., Halligan B.D., Tewey K.M., Liu L.F. Nonintercalative antitumor drugs interfere with the breakage-reunion reaction of mammalian DNA topoisomerase II. J. Biol. Chem. 1984;259:13560–13566. - PubMed
    1. Lock R.B., Ross W.E. Inhibition of p34cdc2 kinase activity by etoposide or irradiation as a mechanism of G2 arrest in Chinese hamster ovary cells. Cancer Res. 1990;50:3761–3766. - PubMed
    1. Asghar U., Witkiewicz A.K., Turner N.C., Knudsen E.S. The history and future of targeting cyclin-dependent kinases in cancer therapy. Nat. Rev. Drug Discov. 2015;14:130–146. doi: 10.1038/nrd4504. - DOI - PMC - PubMed

MeSH terms