Comparative Study
. 2020 Aug 1;26(15):4018-4030.
doi: 10.1158/1078-0432.CCR-19-3416. Epub 2020 Apr 24.

The Immunosuppressive Niche of Soft-Tissue Sarcomas is Sustained by Tumor-Associated Macrophages and Characterized by Intratumoral Tertiary Lymphoid Structures

Affiliations
Comparative Study

The Immunosuppressive Niche of Soft-Tissue Sarcomas is Sustained by Tumor-Associated Macrophages and Characterized by Intratumoral Tertiary Lymphoid Structures

Lingling Chen et al. Clin Cancer Res. .

Abstract

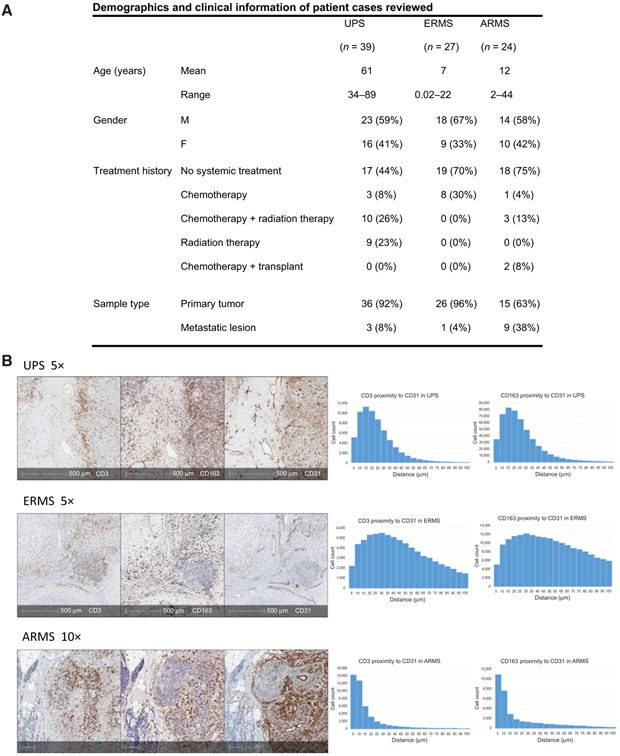
Purpose: Clinical trials with immune checkpoint inhibition in sarcomas have demonstrated minimal response. Here, we interrogated the tumor microenvironment (TME) of two contrasting soft-tissue sarcomas (STS), rhabdomyosarcomas and undifferentiated pleomorphic sarcomas (UPS), with differing genetic underpinnings and responses to immune checkpoint inhibition to understand the mechanisms that lead to response.

Experimental design: Utilizing fresh and formalin-fixed, paraffin-embedded tissue from patients diagnosed with UPS and rhabdomyosarcomas, we dissected the TME by using IHC, flow cytometry, and comparative transcriptomic studies.

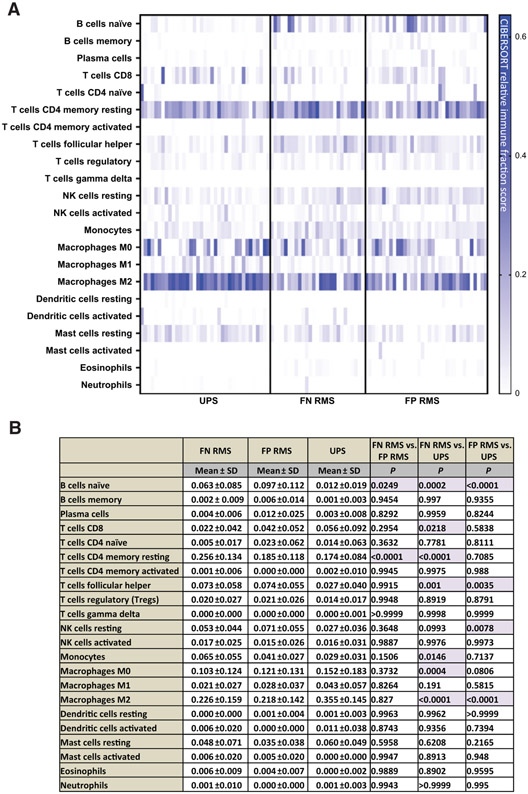
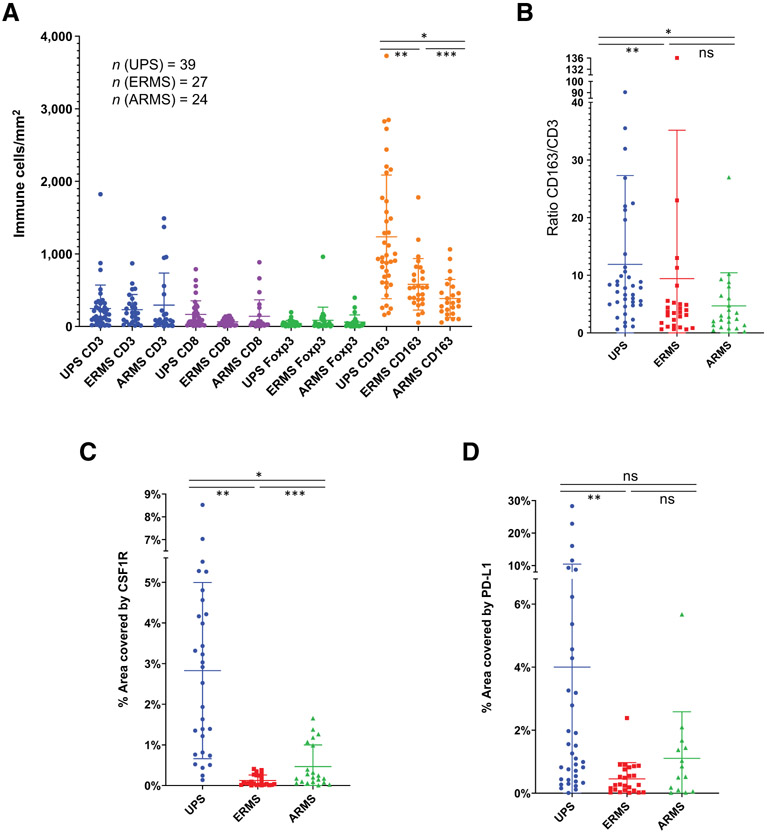
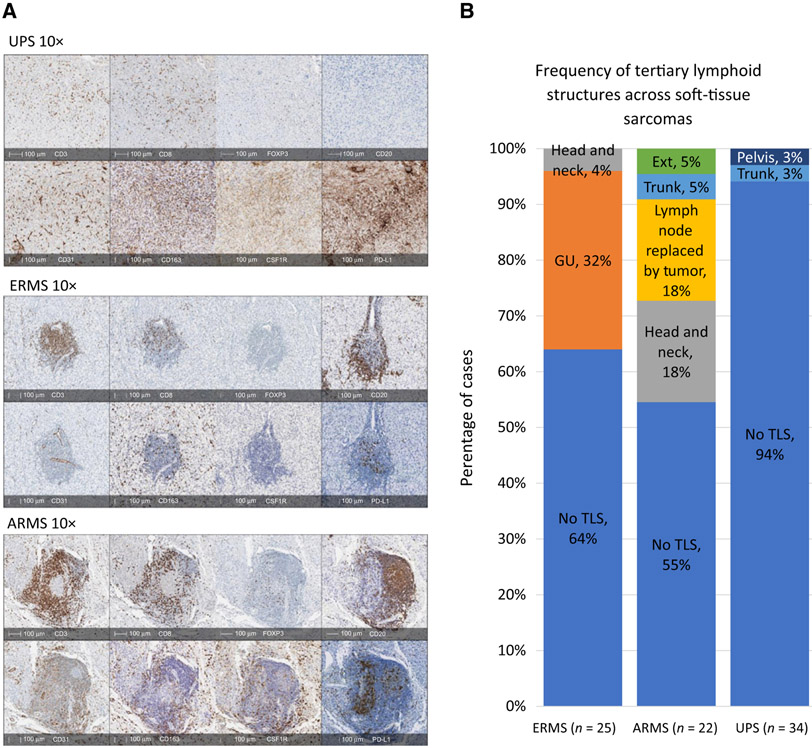
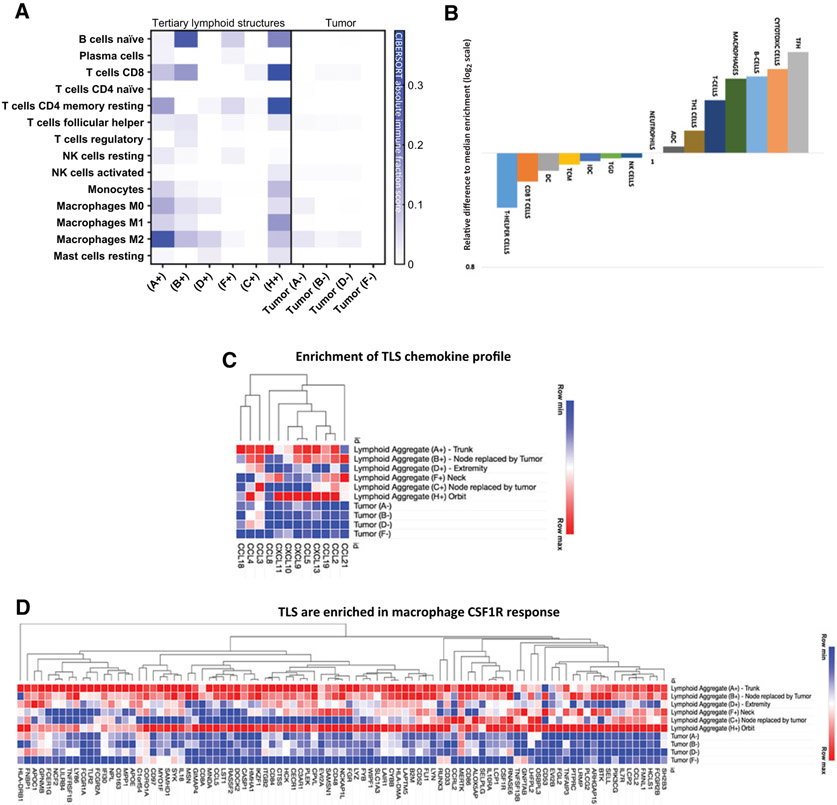
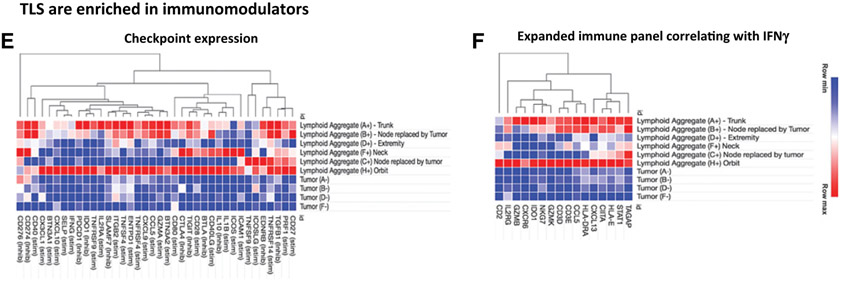
Results: Our results demonstrated both STS subtypes to be dominated by tumor-associated macrophages and infiltrated with immune cells that localized near the tumor vasculature. Both subtypes had similar T-cell densities, however, their in situ distribution diverged. UPS specimens demonstrated diffuse intratumoral infiltration of T cells, while rhabdomyosarcomas samples revealed intratumoral T cells that clustered with B cells near perivascular beds, forming tertiary lymphoid structures (TLS). T cells in UPS specimens were comprised of abundant CD8+ T cells exhibiting high PD-1 expression, which might represent the tumor reactive repertoire. In rhabdomyosarcomas, T cells were limited to TLS, but expressed immune checkpoints and immunomodulatory molecules which, if appropriately targeted, could help unleash T cells into the rest of the tumor tissue.

Conclusions: Our work in STS revealed an immunosuppressive TME dominated by myeloid cells, which may be overcome with activation of T cells that traffic into the tumor. In rhabdomyosarcomas, targeting T cells found within TLS may be key to achieve antitumor response.


Conflict of interest statement

Disclosure of Potential Conflicts of Interest

G. Cojocaru is an employee/paid consultant for Compugen LTD. C.F. Meyer is an employee/paid consultant for Bayer, and reports receiving speakers bureau honoraria from Novartis. D.J. McConkey is an employee/paid consultant for Janssen, Rainier, and H3 Biomedicine, and reports receiving commercial research grants from Astra-Zeneca and Rainier. No potential conflicts of interest were disclosed by the other authors.

Figures

Figure 1.
Figure 1.
A, CIBERSORT immune deconvolution analysis in published UPS gene sets compared with rhabdomyosarcoma gene sets. Fusion status of rhabdomyosarcoma is also included. Heatmaps are representative of CIBERSORT relative immune fraction scores. B, CIBERSORT relative immune fraction score means with SD of sarcoma subtypes. Comparison of means analyzed via two-way ANOVA, Tukey multiple comparisons test. Highlighted cells are statistically significant with P < 0.005. Abbreviations: SD = Standard Deviation; FN RMS: Fusion Negative Rhabdomyosarcoma, FP RMS: Fusion Positive Rhabdomyosarcoma; UPS: Undifferentiated Pleomorphic Sarcoma.
Figure 2.
Figure 2.
A, Patient demographics and clinical history of all cases reviewed. B, Three representative cases illustrating tumor vasculature and immune cell infiltration. IHC slides stained with CD3 (T cells), CD163 (TAMs), and CD31 (endothelial cells) provide a geographic overview of UPS, ERMS, and ARMS specimens (left). In all three subtypes, the majority of T cells and TAMs cluster near endothelial cells. Corresponding histograms represent proximity analysis with HALO pathology software measuring distance (mm) between CD3+ cells and CD31+ cells, as well as between CD163+ cells and CD31+ cells (right). Results demonstrate the majority of T cells and TAMs to be found within 40 μm to tumor endothelial cells in UPS, ERMS, and ARMS.
Figure 3.
Figure 3.
Immune cell densities. A, Densities (immune cells/mm2) for CD3 (T cells), CD8 (cytotoxic T cells), Foxp3 (T-regulatory cells), and CD163 (TAMs) were plotted in UPS, ERMS, and ARMS specimens. TAMS have the strongest presence in all sarcomas, with UPS having the greatest density, followed by ERMS, and then ARMS (*, P < 0.0001; **, P = 0.0003; ***, P = 0.0072 by paired t test). B, Normalization of CD163 densities to CD3 densities with CD163/CD3 ratio among the three different STS subtypes. CD163/CD3 ratio in UPS specimens are higher than rhabdomyosarcoma subtypes, both ARMS and ERMS, but there is no difference between ARMS and ERMS (*, P = 0.0009; **, P = 0.0010). C, Percent surface area covered by CSF1R was measured in the three subtypes. UPS specimens have the highest percent of CSF1R expression, followed by ARMS, and then ERMS (*, P < 0.0001; **, P < 0.0001; ***, P = 0.01 by paired t test). D, Mean surface area covered by PD-L1 was highest in UPS specimens, but only statistically significant when compared with mean of ERMS specimens (**, P < 0.0001). ns, nonsignificant (P > 0.05).
Figure 4.
Figure 4.
Organization of immune cells and frequency of TLS. A, IHC stains shows diffuse distribution of T cells (CD3+ and CD8+) in UPS with no B cells (CD20+) present. In ERMS and ARMS, T cells (CD3+ and CD8+) cluster together with B cells (CD20+) forming TLS. TAMS (CD163+) are diffusely distributed in all sarcomas. CSF1R appears stronger in UPS and ARMS. PD-L1 is present through all sarcomas but stronger in UPS. B, The frequency of TLS in each sarcoma subtype varies and originates from different anatomical sites.
Figure 5.
Figure 5.
A, CIBERSORT absolute immune fraction scores generated from immune deconvolution analysis comparing our six rhabdomyosarcoma intratumoral TLS samples and four paired rhabdomyosarcoma tumor samples without TLS. Immune cell content in rhabdomyosarcoma comes from TLS regions and not areas of tumor devoid of TLS. Location of six intratumoral TLS samples: trunk (A); node replaced by tumor (B); extremity (D); neck (F); node replaced by tumor (C); and orbit (H). (+) denotes areas of tumor with TLS and (−) are areas of tumor devoid of TLS. B, Gene expression profiling of TLS. rhabdomyosarcomas intratumoral TLS are more enriched with gene sets reflective of TLS. All genes shown have FDR < 25%: b) NES of gene sets representative of different immune phenotypes normalized to the median NES show TLS regions to be more enriched in TFH and B cells, compared with tumor areas devoid of TLS. ADC, activated dendritic cells, NK cells, natural killer cells; TGD, T gamma delta cells; IDC, immature dendritic cells; TCM, T central memory cells; DC, dendritic cells. C-F, Heatmaps are representative of core enrichment genes from different gene sets that are more enriched in TLS regions compared with areas of tumor devoid of TLS. TLS regions are more enriched in gene sets representative of TLS chemokine profile, CSF1R response, checkpoint expression, and expanded immune panel corresponding with IFNγ response, compared with areas of tumor devoid of TLS.
Figure 5.
Figure 5.
A, CIBERSORT absolute immune fraction scores generated from immune deconvolution analysis comparing our six rhabdomyosarcoma intratumoral TLS samples and four paired rhabdomyosarcoma tumor samples without TLS. Immune cell content in rhabdomyosarcoma comes from TLS regions and not areas of tumor devoid of TLS. Location of six intratumoral TLS samples: trunk (A); node replaced by tumor (B); extremity (D); neck (F); node replaced by tumor (C); and orbit (H). (+) denotes areas of tumor with TLS and (−) are areas of tumor devoid of TLS. B, Gene expression profiling of TLS. rhabdomyosarcomas intratumoral TLS are more enriched with gene sets reflective of TLS. All genes shown have FDR < 25%: b) NES of gene sets representative of different immune phenotypes normalized to the median NES show TLS regions to be more enriched in TFH and B cells, compared with tumor areas devoid of TLS. ADC, activated dendritic cells, NK cells, natural killer cells; TGD, T gamma delta cells; IDC, immature dendritic cells; TCM, T central memory cells; DC, dendritic cells. C-F, Heatmaps are representative of core enrichment genes from different gene sets that are more enriched in TLS regions compared with areas of tumor devoid of TLS. TLS regions are more enriched in gene sets representative of TLS chemokine profile, CSF1R response, checkpoint expression, and expanded immune panel corresponding with IFNγ response, compared with areas of tumor devoid of TLS.
Figure 6.
Figure 6.
A, MFC analysis of UPS TILs. A1, Live CD45+ cells are composed mainly of T-cells (CD45+/CD3+) at a frequency of 69% ± 15% and less so NK cells (CD45+/CD56+) at a frequency of 9% ± 9%. T cells break down to CD4+ T cells (38% ± 14% of CD45+ cells) and CD8+ T cells (28% ± 13% of CD45+ cells). CD4+ T cells are comprised of more non-T-regulatory cells (CD4+/Foxp3;32% ± 13% of CD45+ cells) and less T-regulatory cells (CD4+/Foxp3+; 6% ± 6% of CD45+ cells). More CD8+ T cells express PD-1: CD8+/PD-1+ cells make up 22% ± 12% of CD45+ cells while CD8+/PD-1 cells make up 6% ± 5% of CD45+ cells. There is a group of CD8+/PD-1 high cells that may represent the tumor reactive repertoire. Many CD8+ T cells produce IFNγ (CD8+/IFNγ+ cells comprise 16% ± 11% of CD45+ cells) and almost no IL10 (CD8+/IL10+ cells comprise 0.4% ± 0.4% of CD45 cells). A2, Frequency of CD4+ T-cell subpopulations show non-T-regulatory cells (CD4+/Foxp3) to express more PD-1 (21% ± 13% of CD45+ cells) and IFNγ (10% ± 9% of CD45+ cells) compared with T-regulatory cells (CD4+/Foxp3+; CD4+/Foxp3+/PD-1+ comprise 5% ± 6% of CD45 cells and CD4+/Foxp3+/IFNγ+ comprise 0.5% ± 0.7% of CD45+ cells). CD4+ subpopulation frequencies are found in Supplementary Fig. S3A. A3, Frequency of CD8+ T-cell subpopulations show the majority of CD8+/PD-1+ cells are capable of producing IFNγ (13% ± 10% of CD45+ cells). Fewer CD8+/PD-1 cells produce IFNγ (4% ± 3% of CD45+ cells). PD-1 expression positively correlates with IFNγ production (Supplementary Fig. S3C). A small population of CD8+/PD-1+ cells also express TIM-3 (4% ± 7% of CD45+ cells). CD8+ subpopulation frequencies are found in Supplementary Fig.S3B. B, Comparison of immune cell composition and T-cell phenotypes between UPS and leiomyosarcoma via IHC and MFC analyses. B1, IHC analysis demonstrates a higher mean density of CD3+ and CD8+ T cells in UPS, however P values were not significant. Mean density of T-regulatory cells (Foxp3+) is significantly higher in UPS compared with leiomyosarcoma specimens and once again, similar to comparisons with rhabdomyosarcoma specimens, UPS specimens have significantly higher mean density of TAMs compared with leiomyosarcoma specimens (*, P = 0.0459; **, P = 0.0008). Mean PD-L1 expression is higher in UPS compared with leiomyosarcoma specimens, but P value was not significant. B2, Comparison of T-cell phenotypes characterized by MFC in UPS and leiomyosarcoma TIL show higher frequency of T-regulatory cells (CD4+/Foxp3+) and non-T-regulatory cells (CD4+/Foxp3) in UPS specimens. Both T-regulatory and non-T-regulatory cells have higher expression of PD-1+ in UPS compared with leiomyosarcoma TIL. UPS TIL also have higher frequency of CD8+ T-cells (CD3+/CD8+), as well as CD8+ T cells that express PD-1+ and both PD-1+/TIM-3+.

Similar articles

Cited by

References

    1. Burningham Z, Hashibe M, Spector L, Schiffman JD. The epidemiology of sarcoma. Clin Sarcoma Res 2012;2:14. - PMC - PubMed
    1. Ries LAG, Smith MA, Gurney JG, Linet M, Tamra T, Young JL, et al. Cancer incidence and survival among children and adolescents: United States SEER Program 1975–1995, NCI. Available from: https://seer.cancer.gov/archive/publications/childhood/childhood-monogra....
    1. Linabery AM, Ross JA. Childhood and adolescent cancer survival in the U.S. by race and ethnicity (diagnostic period 1975–1999). Cancer 2008;113:2575–96. - PMC - PubMed
    1. Ng VY, Scharschmidt TJ, Mayerson JL, Fisher JL. Incidence and survival in sarcoma in the United States: a focus on musculoskeletal lesions. Anticancer Res 2013;33:2597–604. - PubMed
    1. Malempati S, Hawkins DS. Rhabdomyosarcoma: review of the Children's Oncology Group (COG) Soft-Tissue Sarcoma Committee experience and rationale for current COG studies. Pediatr Blood Cancer 2012;59:5–10. - PMC - PubMed

Publication types

MeSH terms

Substances