. 2020 May 5;117(18):9723-9732.
doi: 10.1073/pnas.1919410117. Epub 2020 Apr 24.

Sample multiplexing for targeted pathway proteomics in aging mice

Affiliations

Sample multiplexing for targeted pathway proteomics in aging mice

Qing Yu et al. Proc Natl Acad Sci U S A. .

Abstract

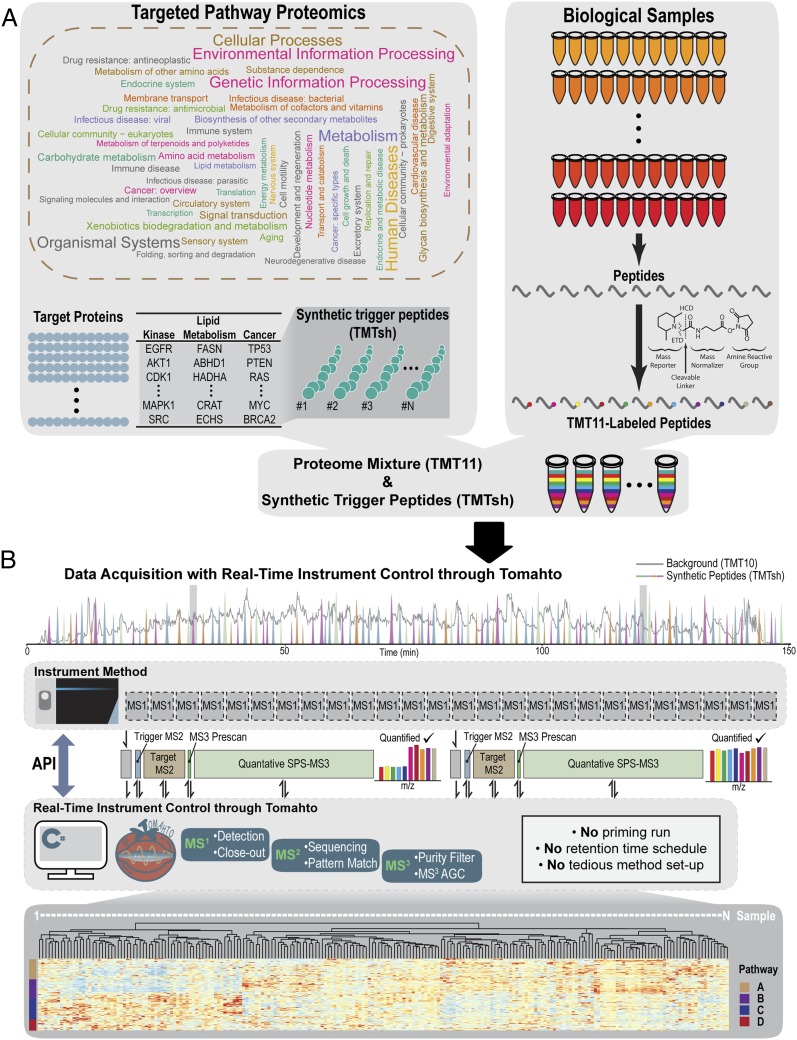
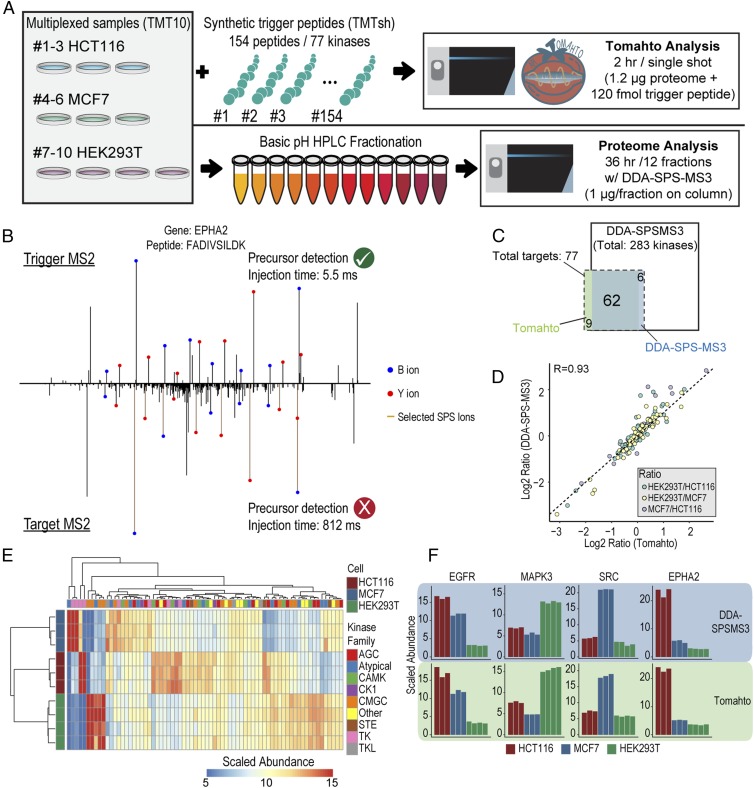
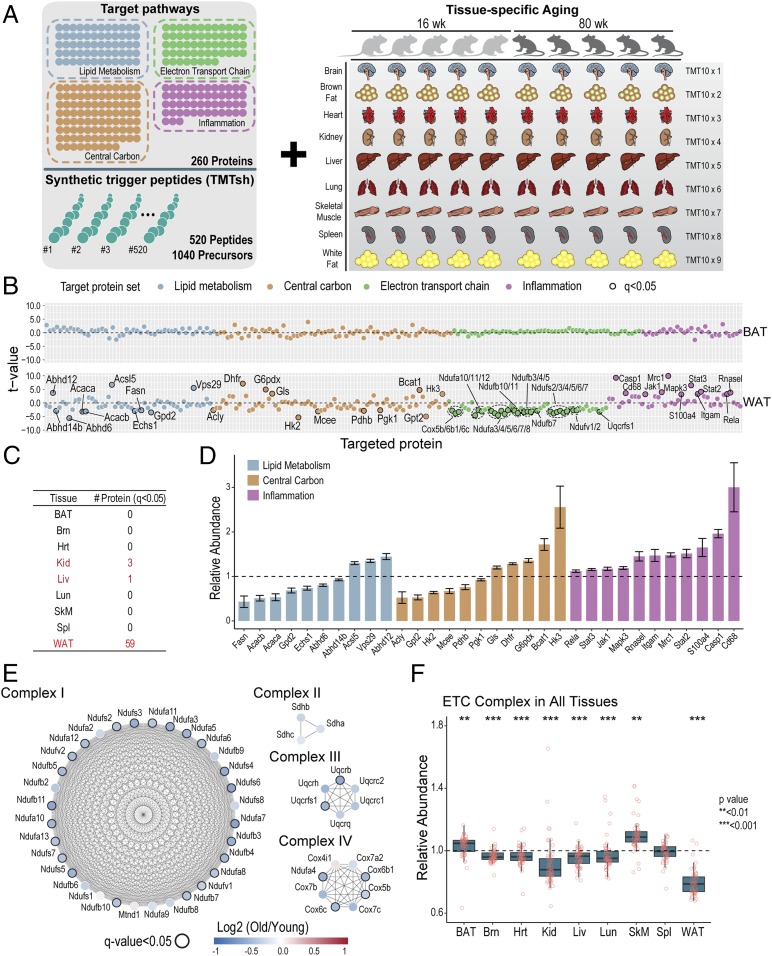
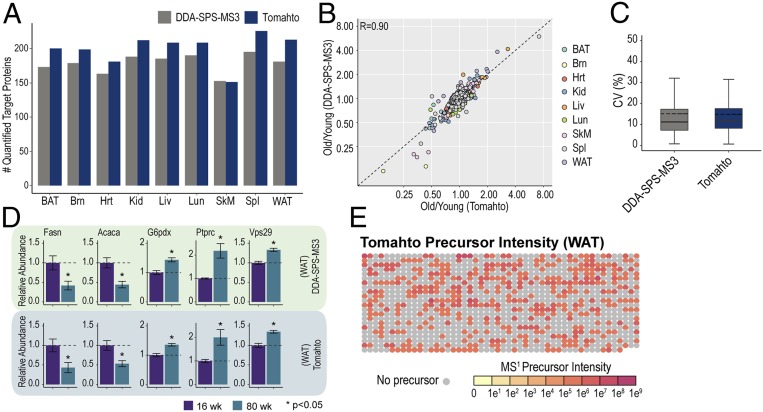
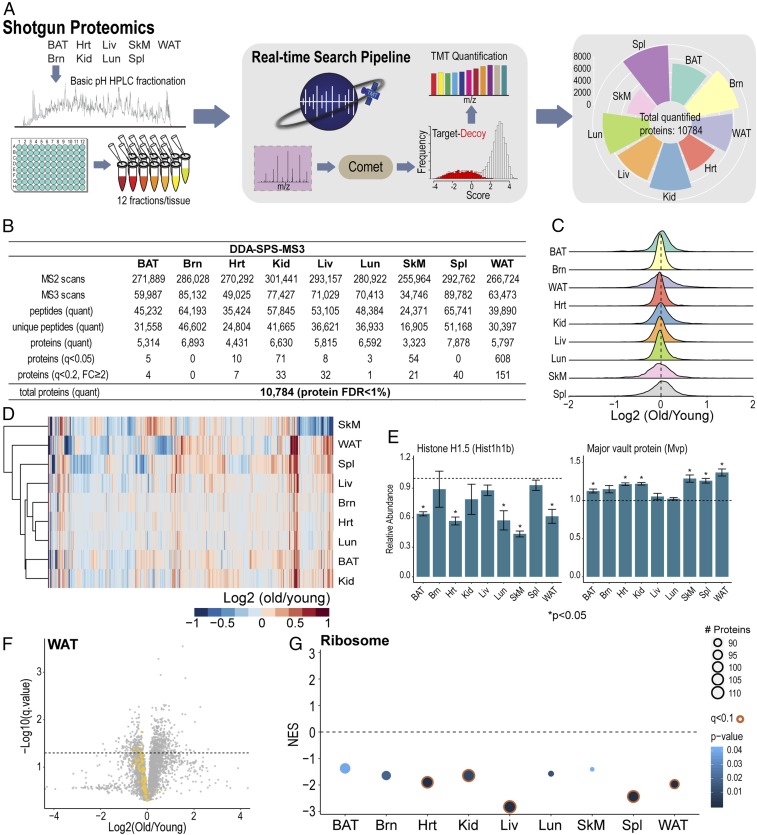
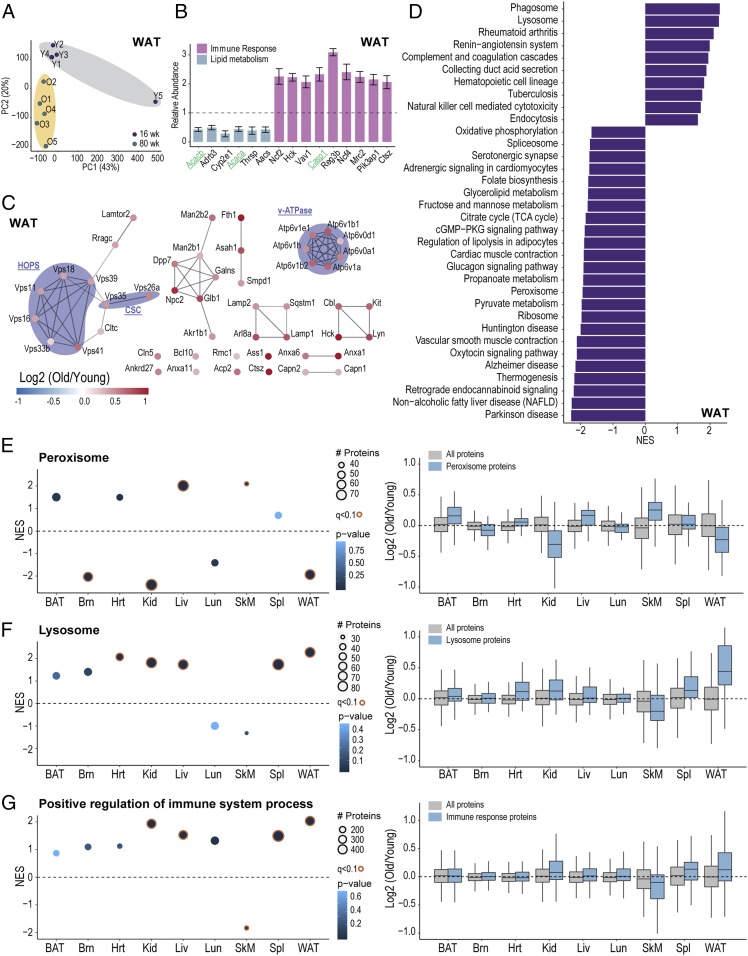
Pathway proteomics strategies measure protein expression changes in specific cellular processes that carry out related functions. Using targeted tandem mass tags-based sample multiplexing, hundreds of proteins can be quantified across 10 or more samples simultaneously. To facilitate these highly complex experiments, we introduce a strategy that provides complete control over targeted sample multiplexing experiments, termed Tomahto, and present its implementation on the Orbitrap Tribrid mass spectrometer platform. Importantly, this software monitors via the external desktop computer to the data stream and inserts optimized MS2 and MS3 scans in real time based on an application programming interface with the mass spectrometer. Hundreds of proteins of interest from diverse biological samples can be targeted and accurately quantified in a sensitive and high-throughput fashion. It achieves sensitivity comparable to, if not better than, deep fractionation and requires minimal total sample input (∼10 µg). As a proof-of-principle experiment, we selected four pathways important in metabolism- and inflammation-related processes (260 proteins/520 peptides) and measured their abundance across 90 samples (nine tissues from five old and five young mice) to explore effects of aging. Tissue-specific aging is presented here and we highlight the role of inflammation- and metabolism-related processes in white adipose tissue. We validated our approach through comparison with a global proteome survey across the tissues, work that we also provide as a general resource for the community.

Keywords: Tomahto; isobaric labeling; real-time instrument control; targeted pathway proteomics; tissue-specific aging.


Conflict of interest statement

The authors declare no competing interest.

Figures

Fig. 1.
Fig. 1.
Multiplexed targeted pathway proteomics assisted by Tomahto with real-time instrument control. (A) TOMAHAQ enables 2D multiplexed targeted pathway proteomics. Constructing an assay starts with selecting protein targets and generating synthetic peptides for pathways of interest. These synthetic trigger peptides are labeled with TMTsh reagent, whereas peptides from biological samples are labeled with regular TMT reagents (e.g., TMT10 or TMT11), creating a mass difference of 6 Da. (B) A fully automated API-based algorithm, termed Tomahto, is presented in this work. Tomahto eliminates the need for a priming run and constructing elaborate method files while also enabling implementation of several advanced data acquisition options. The sophisticated data acquisition is handled by Tomahto such that the instrument method contains only MS1 scans. Tomahto monitors the elution of synthetic trigger peptides throughout an LC-MS run. When one is detected, Tomahto prompts the insertion of up to four custom scans in order to 1) sequence verify the trigger peptide, 2) sequence verify the target peptide, 3) optimize the quantification scan, and 4) collect the optimized quantification MS3 scan using only b- and y-type ions that exceed a purity filter. MS3 quantification scans contain the released TMT reporter ions. The final result is one or more pathways profiled for protein expression differences across all samples.
Fig. 2.
Fig. 2.
Benchmarking Tomahto by measuring protein levels for 77 kinases across three human cell lines. (A) Lysates from biological triplicates of HCT116 and MCF7 and quadruplicates of HEK293T were processed and labeled with TMT10 reagents. The Tomahto assay was performed with 154 spiked-in trigger peptides corresponding to 77 kinases and a 2-h single-shot method. In addition, shotgun analysis was performed on the same samples after fractionation. Twelve fractions were analyzed with 3-h gradients using the standard DDA-SPS-MS3 method (36 h total). (B) Representative trigger and target MS2s. These are used to confirm the identity of both the trigger and the target precursor peaks. The target MS2 is often of very low abundance and requires long injections times (812 ms here). Note that all labeled fragment masses differ by 6 Da between plots due to the TMTsh labeling on both termini. (C) Overlap for the kinases quantified by both methods. (D) Correlation between standard DDA-SPS-MS3 (fractionated, 36-h analysis) and Tomahto (unfractionated, 2-h analysis). (E) Hierarchical clustering of kinases quantified by Tomahto. Replicates perfectly clustered and many signature up- or down-regulated kinases were identified. (F) Bar plots of example proteins, EGFR, MAPK3, SRC, and EPHA2.
Fig. 3.
Fig. 3.
A targeted Tomahto assay to profile proteome changes in metabolism and inflammation applied to aging mouse tissues. (A) Five “young” (16-wk-old) and five “old” (80-wk-old) mice were killed, and nine tissues from each animal were obtained and processed. Resulting tryptic peptides were labeled with TMT10 reagents. For the targeted assay, synthetic trigger peptides targeting four different panels of proteins (i.e., lipid metabolism, electron transport chain, central carbon metabolism, and inflammation), totaling 260 proteins and 520 peptides, were labeled with TMTsh reagent and spiked into multiplexed endogenous proteomes. (B) Examples of protein expression differences from the TOMAHAQ pathway analysis in brown compared to WAT (BAT vs. WAT). t tests (n = 5; old vs. young mice) were performed for each target protein with FDR correction. t values for each quantified protein are plotted and proteins passing a q value of 0.05 are labeled. BAT did not exhibit any change with q < 0.05, whereas WAT was the most affected tissue by aging with 59 proteins changed significantly by the same standard. See also SI Appendix, Fig. S4A. (C) Number of significantly changed (q < 0.05) protein targets in nine tissues. (D) Relative abundance of significantly changed (q < 0.05) proteins from WAT. Proteins are colored according to primary pathway. Bars represent mean ± SEM. (E) Quantification of targeted ETC complex proteins from WAT. Many ETC complex subunits (24) in WAT exhibited statistically significant (q < 0.05) decreases in old mice and most of the other complex members exhibited a decreasing trend. Color scale represents the log2-transformed ratio of protein abundance relative to young mice. Nodes with q value < 0.05 are circled with a black border. (F) Distribution of mean relative abundance of quantified ETC complex subunits in nine tissues. Relative abundance in old mice was normalized to mean young mice values (n = 5). Each point represents mean relative abundance of a quantified protein. t tests were used to detect differences between young and old mice using the mean relative abundances of quantified ETC proteins. In addition to WAT, ETC complexes as a group (but not alone) showed significant decreases in five tissues (P < 0.05). See also SI Appendix, Fig. S4B.
Fig. 4.
Fig. 4.
Comparison of TMT-based measurements made using the targeted vs. untargeted approach. (A) Number of quantified target proteins by Tomahto and Standard DDA-SPS-MS3. Tomahto achieved better coverage quantifying target proteins compared to Standard MS3 and consumed much less starting material and instrument time. (B) Pearson correlation was calculated for all target proteins in nine tissues (r = 0.90). (C) The coefficient of variation (CV) among biological replicates for each protein within each tissue, commonly quantified by Standard MS3 and Tomahto, was calculated and assessed for reproducibility. (D) Example bar charts for protein quantifications using both methods. Bars represent mean ± SEM (n = 5). (E) Most peptides are quantified even in the absence of a visible MS1 feature. Array plot of precursor intensity for a representative Tomahto experiment. Each dot represents the MS1 precursor intensity of an inserted MS3 quantification scan. Dot color scale represents MS1 intensity and gray dot indicates absence of any peak within the elution window.
Fig. 5.
Fig. 5.
Tissue-specific proteome profiling and common alterations of the proteome in old mice. (A) For proteome-wide quantitative analysis, each of the TMT10-labeled tissue samples was fractionated by basic pH reversed-phase high-performance LC, and 12 fractions were then analyzed with an established analytical pipeline that included a real-time database search (29). Including all nine tissues (216 h of analysis), 10,784 proteins were quantified. (B) Untargeted dataset overview. FC: fold change. (C) Density distributions for log-transformed old-to-young ratios in nine tissues. (D) Unsupervised hierarchical clustering using commonly quantified proteins in nine tissues. (E) Example bar plots of suggested aging marker proteins. Bars represent mean ± SEM. (F) Volcano plot of quantified proteins in WAT. Yellow dots indicate quantified members (n = 94) of cytoplasmic and mitochondrial ribosome complexes. Dotted line indicates q = 0.05. (G) GSEA analysis of ribosome proteins comparing old and young mice for nine tissues. Normalized enrichment scores (NES) are plotted for each tissue.
Fig. 6.
Fig. 6.
Tissue-specific changes in old mice revealed by proteome-wide profiling. (A) Principal component analysis (PCA) of WAT from 10 mice. (B) Example bar plots of proteins (n = 5, q < 0.05) that also have a minimum 2-fold change in WAT. Bars are colored according to primary pathway. Genes in green were also quantified by Tomahto. Bars represent mean ± SEM. (C) Network of significantly changed (n = 5, q < 0.05) lysosomal proteins in WAT. All genes were up-regulated in old mice. (D) Significantly enriched terms (q < 0.05) from GSEA analysis using all quantified WAT proteins (n = 5,797). (E) GSEA analysis for peroxisome gene set. NES and log2 ratio distribution are plotted for each tissue. (F) GSEA analysis result for the lysosome. NES and log2 ratio distribution are plotted for each tissue. (G) GSEA analysis result of positive regulation of immune system process. NES and log2 ratio distribution are plotted for each tissue.

Comment in

  • Proteomics illuminates fat as key tissue in aging.
    Long JZ. Long JZ. Proc Natl Acad Sci U S A. 2020 May 12;117(19):10111-10112. doi: 10.1073/pnas.2005988117. Epub 2020 May 4. Proc Natl Acad Sci U S A. 2020. PMID: 32366668 Free PMC article. No abstract available.

References

    1. Gillet L. C., Leitner A., Aebersold R., Mass spectrometry applied to bottom-up proteomics: Entering the high-throughput Era for hypothesis testing. Annu. Rev. Anal. Chem. (Palo Alto, Calif.) 9, 449–472 (2016). - PubMed
    1. Di Stefano B., et al. , Reduced MEK inhibition preserves genomic stability in naive human embryonic stem cells. Nat. Methods 15, 732–740 (2018). - PMC - PubMed
    1. Navarrete-Perea J., Yu Q., Gygi S. P., Paulo J. A., Streamlined tandem mass tag (SL-TMT) protocol: An efficient strategy for quantitative (Phospho)proteome profiling using tandem mass tag-synchronous precursor selection-MS3. J. Proteome Res. 17, 2226–2236 (2018). - PMC - PubMed
    1. Bekker-Jensen D. B., et al. , An optimized shotgun strategy for the rapid generation of comprehensive human proteomes. Cell Syst. 4, 587–599.e4 (2017). - PMC - PubMed
    1. Song E., et al. , Targeted proteomic assays for quantitation of proteins identified by proteogenomic analysis of ovarian cancer. Sci. Data 4, 170091 (2017). - PMC - PubMed

Publication types