. 2020 Apr 24;11(4):277.
doi: 10.1038/s41419-020-2477-1.

Deficiency in the autophagy modulator Dram1 exacerbates pyroptotic cell death of Mycobacteria-infected macrophages

Affiliations

Deficiency in the autophagy modulator Dram1 exacerbates pyroptotic cell death of Mycobacteria-infected macrophages

Rui Zhang et al. Cell Death Dis. .

Abstract

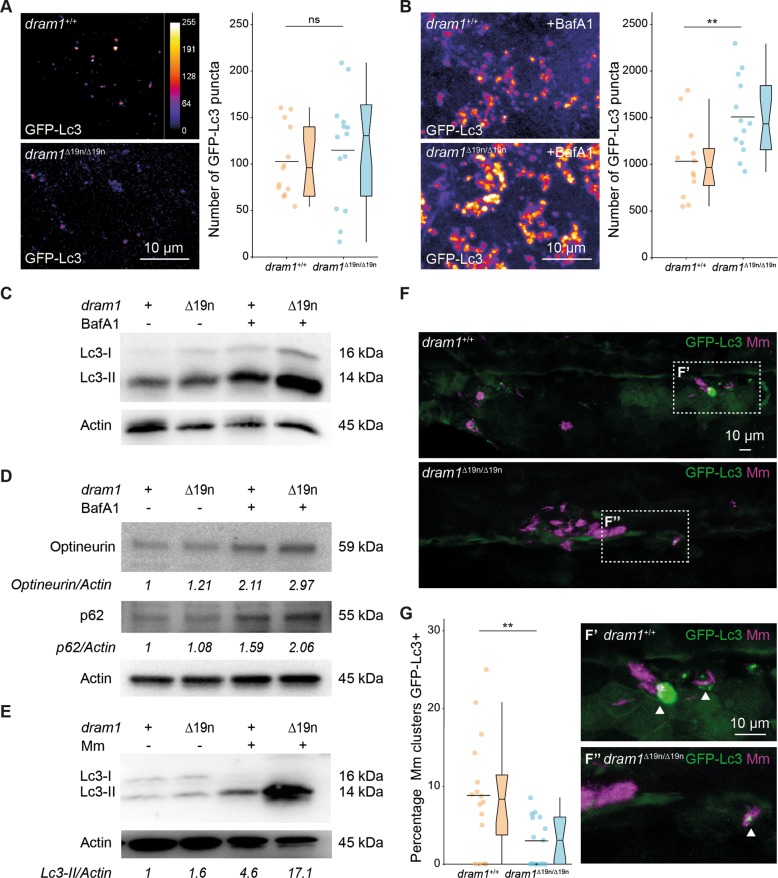
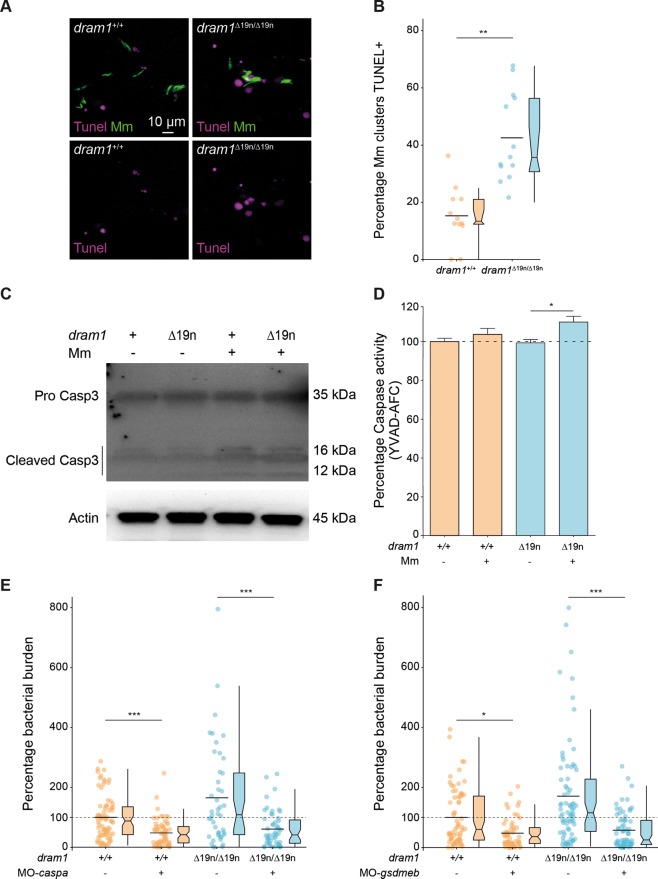
DNA damage regulated autophagy modulator 1 (DRAM1) is a stress-inducible regulator of autophagy and cell death. DRAM1 has been implicated in cancer, myocardial infarction, and infectious diseases, but the molecular and cellular functions of this transmembrane protein remain poorly understood. Previously, we have proposed DRAM1 as a host resistance factor for tuberculosis (TB) and a potential target for host-directed anti-infective therapies. In this study, we generated a zebrafish dram1 mutant and investigated its loss-of-function effects during Mycobacterium marinum (Mm) infection, a widely used model in TB research. In agreement with previous knockdown analysis, dram1 mutation increased the susceptibility of zebrafish larvae to Mm infection. RNA sequencing revealed major effects of Dram1 deficiency on metabolic, immune response, and cell death pathways during Mm infection, and only minor effects on proteinase and metabolic pathways were found under uninfected conditions. Furthermore, unchallenged dram1 mutants did not display overt autophagic defects, but autophagic targeting of Mm was reduced in the absence of Dram1. The phagocytic ability of macrophages in dram1 mutants was unaffected, but acidification of Mm-containing vesicles was strongly reduced, indicating that Dram1 is required for phagosome maturation. By in vivo imaging, we observed that Dram1-deficient macrophages fail to restrict Mm during early stages of infection. The resulting increase in bacterial burden could be reverted by knockdown of inflammatory caspase a (caspa) and gasdermin Eb (gsdmeb), demonstrating pyroptosis as the mechanism underlying premature cell death of Mm-infected macrophages in dram1 mutants. Collectively, these data demonstrate that dissemination of mycobacterial infection in zebrafish larvae is promoted in the absence of Dram1 due to reduced maturation of mycobacteria-containing vesicles, failed intracellular containment, and consequent pyroptotic death of infected macrophages. These results provide new evidence that Dram1 plays a central role in host resistance to intracellular infection, acting at the crossroad of autophagy and cell death.


Conflict of interest statement

The authors declare that they have no conflict of interest.

Figures

Fig. 1
Fig. 1. Dram1 deficiency leads to increased susceptibility to Mm infection.
a Schematic representation of the zebrafish dram1/Dram1(ENSDARG00000045561/ENSDARP0 0000066996.3) genetic and protein domain architecture and CRISPR/Cas9 target site. Dram1 (240 amino acids) contains six transmembrane domains (indicated with boxes and labeled T1–T6 with amino acid numbers indicated above). The gene is depicted with coding exons as boxes and introns as solid black lines (introns not drawn to scale). The position of the CRISPR/Cas9 target site and the predicted truncated protein is indicated. b Confirmation of dram1 mutation by Western blotting analysis. Protein samples were extracted from 4 dpf dram1∆19n/∆19n and dram1+/+ larvae (>10 larvae/sample). The blots were probed with antibodies against Dram1 and Actin as a loading control. c Representative confocal micrographs of sections from the tail region showing TUNEL staining performed on dram1∆19n/∆19n and dram1+/+ larvae at 3 dpf. Scale bar, 10 μm. d Quantification of TUNEL-positive cells in the indicated region of the tail of dram1∆19n/∆19n and dram1+/+ larvae at 3 dpf (≥7 larvae/group). Data are represented by scatter and boxplots as detailed in the “Methods” section. e Representative stereo images of infected dram1∆19n/∆19n and dram1+/+ larvae at 3 dpi. The arrowhead indicates the accumulation of bacteria in intersegmental veins. f and g Quantification of bacterial burdens at 3 dpi for dram1 mutants, wild type siblings, and unrelated wild types f or for dram1 and dram1∆19n mRNA injected individuals g. The data are accumulated from two independent experiments (>42 larvae/group for f and >62 larvae/group for g) and represented by scatter and boxplots as detailed in the methods section.
Fig. 2
Fig. 2. Dram1 deficiency affects gene expression of pathways involved in metabolism, innate immunity, and lytic cell death during infection.
a Bacterial burdens of larvae injected with different CFU doses of Mm that have been analyzed by RNAseq. The data are accumulated from three independent sample sets at 4 dpi (>42 larvae/group) and represented by scatter and boxplots as detailed in the methods section. b Venn diagram of the significantly enriched KEGG pathways in the transcriptome of larvae infected with Mm. The enrichment comparisons were performed on dram1∆19n/∆19n 150 CFU versus dram1∆19n/∆19n PBS, dram1∆19n/∆19n 300 CFU versus dram1∆19n/∆19n, and dram1+/+ 300 CFU versus dram1+/+ PBS. c Visualization of the lytic cellular death signaling pathway transcriptome shows different responses in the transcriptome of infected dram1∆19n/∆19n and dram1+/+. The pathway was adapted from the KEGG pathway necroptosis. In the visualization, the gene expression in the comparison dram1∆19n/∆19n 150 CFU versus dram1∆19n/∆19n PBS, dram1∆19n/∆19n 300 CFU versus dram1∆19n/∆19n, and dram1+/+ 300 CFU versus dram1+/+ PBS are depicted by color gradient (yellow, upregulated, blue downregulated). The expression of all genes of the pathway present in the RNA sequencing was plotted independently of their significance. While the effector genes of the apoptosis pathway did not show high expression changes, the genes from lytic cell death forms, including pyroptosis, showed high expression modulation.
Fig. 3
Fig. 3. Dram1 is required for GFP-Lc3 targeting to Mm clusters.
a, b Representative confocal micrographs and quantification of GFP-Lc3 puncta in dram1∆19n/∆19n and dram1+/+ larvae in an unstimulated situation (basal autophagy, a) and following BafA1 treatment b. Each larva was imaged at a pre-defined region of the tail fin (≥11 larvae/group). Results are accumulated from two independent experiments and represented by scatter and boxplots as detailed in the “Methods” section. ns non-significant, *p < 0.05,**p < 0.01,***p < 0.001. Scale bars, 10 μm. The intensity calibration bar for the Lookup table (LUT) is displayed in panel a. c–e Western blot analysis of autophagy. Protein samples were obtained from 4 dpf dram1∆19n/∆19n and dram1+/+ larvae (>10 larvae/sample). Lc3 c and e, or p62 and Optineurin d protein levels were detected in absence or presence of BafA1, c and d, or in the presence or absence of Mm e. Actin was used as a loading control. Western Blots were repeated three, c and d, or two e times with protein extracts derived from independent experiments. The Lc3II/Actin or p62/Actin and Optineurin/Actin ratio, normalized to the control sample, is indicated below the blots. f–g Representative confocal micrographs and quantification of GFP-Lc3 co-localization with Mm clusters in infected dram1∆19n/∆19n and dram1+/+ larvae. The top images f show the entire region of imaging, while the bottom images f′ and f″ show details of GFP-Lc3 colocalization of Mm clusters in dram1∆19n/∆19n and dram1+/+ larvae. The arrowheads indicate GFP-Lc3-positive Mm clusters. The data is accumulated from two independent experiments (≥15 larvae/group) and represented by scatter and boxplots as detailed in the “Methods” section. Scale bars, 10 μm.
Fig. 4
Fig. 4. Dram1 deficiency does not affect the capability of macrophages to phagocytose Mm.
a Representative stereo micrographs of macrophages in the whole tail region and quantification of the number of macrophages in this region. 3 dpf dram1∆19n/∆19n and dram1+/+/ mpeg1:mCherryF larvae were obtained from incrossed dram1+/∆19n animals and the number of macrophages for each larva were counted before determining the genotype. Genotyping was performed by PCR and Sanger sequencing (≥28 larvae/group). Data are accumulated from two independent experiments and represented by scatter and boxplots as detailed in the “Methods” section. ns non-significant, *p < 0.05,**p < 0.01,***p < 0.001. b Representative stereo images of the whole tail of 3 dpf dram1∆19n/∆19n and dram1+/+ larvae following an immunohistochemical peroxidase activity detection protocol. The number of neutrophils in this region was quantified per individual larva (≥18 larvae/group). Data are accumulated from two independent experiments and represented by scatter and boxplots as detailed in the “Methods” section. ns non-significant, *p < 0.05,**p < 0.01,***p < 0.001. c Representative confocal micrographs of macrophages located in the blood circulation over the yolk sac of infected dram1∆19n/∆19n and dram1+/+ embryos in mpeg1:mCherryF background at 1 h post-infection (hpi). Scale bars, 10 μm. Quantification of phagocytosis of Mm by macrophages at 1 hpi. dram1∆19n/∆19n and dram1+/+ embryos in mpeg1:mCherryF background were infected with Mm at 30 hpf and fixed at 1 hpi. The percentage of macrophages having phagocytosed Mm clusters was determined per individual larva (≥16 larvae/ group). Results are accumulated from two independent experiments and represented by scatter and boxplots as detailed in the “Methods” section. ns non-significant, *p < 0.05,**p < 0.01,***p < 0.001.
Fig. 5
Fig. 5. Macrophages fail to restrict Mm infection in Dram1-deficient larvae.
a Mm bacterial burden for dram1∆19n/∆19n and dram1+/+ at 1 and 2 dpi. Data are accumulated from two independent experiments (>38 larvae/group) and represented by scatter and boxplots as detailed in the “Methods” section. b Representative confocal images of LysoTracker staining performed on infected dram1∆19n/∆19n and dram1+/+ embryos at 1 dpi. The arrowheads indicate Lysotracker-positive (LysoTracker+) Mm clusters. Scale bars, 10 μm. c The percentage of LysoTracker+ Mm clusters was determined in infected embryos (≥15 embryos/group) at 1 dpi. The percentage of Mm clusters positive for LysoTracker staining (LysoTracker+) was determined per individual infected larva. Data are accumulated from two independent experiments and represented by scatter and boxplots as detailed in the “Methods” section. ns non-significant, *p < 0.05,**p < 0.01,***p < 0.001. d and f Representative confocal images of infected dram1∆19n/∆19n and dram1+/+ embryos/larvae in mpeg1:mCherryF background at 1 dpi d and 2 dpi f. The entire CHT region of fixed embryos or larvae was imaged. The arrowheads indicate intracellular Mm clusters and an asterisk (*) indicates remnants from dead macrophages. Scale bars, 10 μm. e and g Percentage of Mm clusters restricted inside macrophages at 1 dpi e and 2 dpi g (≥10 embryos/group). The percentage of intracellular Mm clusters was determined per individual embryo. Data are accumulated from two independent experiments and represented by scatter and boxplots as detailed in the “Methods” section. ns non-significant, *p < 0.05,**p < 0.01,***p < 0.001.
Fig. 6
Fig. 6. Dram1 deficiency results in increased pyroptotic cell death.
a Representative confocal images of TUNEL staining in dram1∆19n/∆19n and dram1+/+ larvae at 2 dpi. The entire CHT region of fixed 2 dpi dram1∆19n/∆19n and dram1+/+ larvae was imaged. Scale bars, 10 μm. b Quantification of the percentage of Mm clusters positive for TUNEL staining (TUNEL+) in dram1∆19n/∆19n and dram1+/+ larvae. The percentage of Mm clusters TUNEL+ in the CHT region was determined per individual infected larva (≥12 larvae/group). Data are accumulated from two independent experiments and represented by scatter and boxplots as detailed in the “Methods” section. ns non-significant,*p < 0.05,**p < 0.01,***p < 0.001. c Detection of pro-Caspase 3 and cleaved Caspase 3 protein in dram1∆19n/∆19n and dram1+/+ embryos. Protein samples were extracted from 4 dpf infected and uninfected dram1∆19n/∆19n and dram1+/+ larvae (>10 larvae/sample). The Western blots were probed with antibodies against Caspase 3 and Actin as a loading control. Data is representative of two independent experiments. d Detection of Caspase activity (YVAD-AFC) in dram1∆19n/∆19n and dram1+/+embryos. Protein samples were obtained from 2 dpf control and infected dram1∆19n/∆19n and dram1+/+ embryos in GFP-Lc3 background (35 embryos/sample). The data is accumulated from two independent experiments (n = 4 samples/condition). e Mm bacterial burden at 2 dpi following knockdown of caspa in dram1∆19n/∆19n and dram1+/+ embryos. The data is accumulated from two independent experiments (>44 larvae/group) and represented by scatter and box plots as detailed in the “Methods” section. ns non-significant, *p < 0.05,**p < 0.01,***p < 0.001. f Mm bacterial burden at 2 dpi following knockdown of gsmdeb in dram1∆19n/∆19n and dram1+/+ embryos. The data is accumulated from two independent experiments (>56 larvae/group) and represented by scatter and box plots as detailed in the “Methods” section. ns non-significant, *p < 0.05,**p < 0.01,***p < 0.001 to mutated dram1.

References

    1. Ohsumi Y. Yoshinori Ohsumi: autophagy from beginning to end. Interview by Caitlin Sedwick. J. Cell Biol. 2012;197:164–165. doi: 10.1083/jcb.1972pi. - DOI - PMC - PubMed
    1. Levine B, Mizushima N, Virgin HW. Autophagy in immunity and inflammation. Nature. 2011;469:323–335. doi: 10.1038/nature09782. - DOI - PMC - PubMed
    1. Deretic V, Saitoh T, Akira S. Autophagy in infection, inflammation and immunity. Nat. Rev. Immunol. 2013;13:722. doi: 10.1038/nri3532. - DOI - PMC - PubMed
    1. Wallis RS, Hafner R. Advancing host-directed therapy for tuberculosis. Nat. Rev. Immunol. 2015;15:255–263. doi: 10.1038/nri3813. - DOI - PubMed
    1. Paik, S., Kim, J. K., Chung, C. & Jo, E. K. Autophagy: a new strategy for host-directed therapy of tuberculosis. Virulence 1–12, 10.1080/21505594.2018.1536598 (2018). - PMC - PubMed

Publication types

Supplementary concepts