. 2020 Apr 24;11(1):2004.
doi: 10.1038/s41467-020-15581-6.

Confidence reports in decision-making with multiple alternatives violate the Bayesian confidence hypothesis

Affiliations

Confidence reports in decision-making with multiple alternatives violate the Bayesian confidence hypothesis

Hsin-Hung Li et al. Nat Commun. .

Abstract

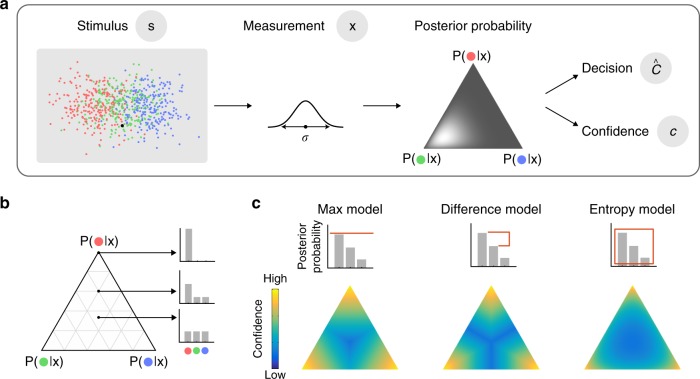
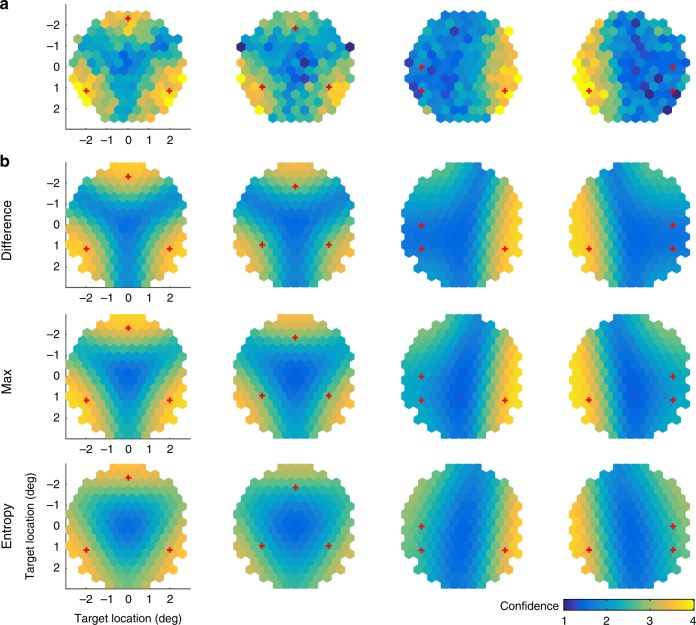
Decision confidence reflects our ability to evaluate the quality of decisions and guides subsequent behavior. Experiments on confidence reports have almost exclusively focused on two-alternative decision-making. In this realm, the leading theory is that confidence reflects the probability that a decision is correct (the posterior probability of the chosen option). There is, however, another possibility, namely that people are less confident if the best two options are closer to each other in posterior probability, regardless of how probable they are in absolute terms. This possibility has not previously been considered because in two-alternative decisions, it reduces to the leading theory. Here, we test this alternative theory in a three-alternative visual categorization task. We found that confidence reports are best explained by the difference between the posterior probabilities of the best and the next-best options, rather than by the posterior probability of the chosen (best) option alone, or by the overall uncertainty (entropy) of the posterior distribution. Our results upend the leading notion of decision confidence and instead suggest that confidence reflects the observer's subjective probability that they made the best possible decision.


Conflict of interest statement

The authors declare no competing interests.

Figures

Fig. 1
Fig. 1. Experimental procedure and stimuli.
a Each trial started with the presentation of the stimulus including exemplar dots in three different colors representing the distribution of each of the three categories and one target dot, the black dot. Observers first reported their decisions in the categorization task and then reported their confidence by using the rectangular buttons presented at the bottom of the screen. b, c Schematic representation of the distribution of the categories. The circles are centered at the mean location of each category. The width of the circles corresponds to 2.5 times the standard deviation of the category distribution. (b) The four conditions tested in Experiment 1 and 3. c The four conditions tested in Experiment 2. The exemplar dots in (a) are based on the distribution depicted in the top panel in (b).
Fig. 2
Fig. 2. Models.
a Generative model. Target position is represented by s. Two sources of variability are considered in the model: First, observers have access to noisy measurement x, a Gaussian distribution centered at s with a standard deviation σ. Second, given the same measurement x, the posterior distribution varies across trials due to decision noise, modeled by Dirichlet distribution, of which spread (represented by the shade of the ternary plot) is controlled by a parameter α (see Methods). On each trial, a decision Ĉ and a confidence c are read out from the posterior distribution of that trial. b We use ternary plots to represent all possible posterior distributions. For example, a point at the center represents a uniform posterior distribution; at the corners of the ternary plot, the posterior probability of one category is one while the posterior for the other two categories are zeros. c The bar graphs illustrate how confidence is read out from posterior probabilities in each model. For the purposes of these plots, we did not include decision noise here. The color of each ternary plot represents the confidence as a function of posterior distribution for each model. The color is scaled for each ternary plot (independently) to take the whole range of the color bar.
Fig. 3
Fig. 3. Experiment 1.
a The distribution of the reference dots in each condition. b Mean confidence report as a function of target position for each of the four conditions. The black curves represent group mean ± 1s.e.m. Blue curves represent the model fit averaged across individuals.
Fig. 4
Fig. 4. Model comparisons using ΔAIC: AIC of each model compared with the Difference model.
The bars represent ΔAIC summed across participants. The error bars represent 95% bootstrapped confidence interval. a Experiment 1. b Experiment 2.
Fig. 5
Fig. 5. Experiment 2.
a The mean confidence report as a function of target positions. b Model fit averaged across individuals. The red crosses in each panel represent the center of each of the three categories.

Comment in

  • Confidence in the Real World.
    Rahnev D. Rahnev D. Trends Cogn Sci. 2020 Aug;24(8):590-591. doi: 10.1016/j.tics.2020.05.005. Epub 2020 May 20. Trends Cogn Sci. 2020. PMID: 32446639

References

    1. Persaud N, McLeod P, Cowey A. Post-decision wagering objectively measures awareness. Nat. Neurosci. 2007;10:257. doi: 10.1038/nn1840. - DOI - PubMed
    1. Van den Berg R, Zylberberg A, Kiani R, Shadlen MN, Wolpert DM. Confidence is the bridge between multi-stage decisions. Curr. Biol. 2016;26:3157–3168. doi: 10.1016/j.cub.2016.10.021. - DOI - PMC - PubMed
    1. Meyniel F, Schlunegger D, Dehaene S. The sense of confidence during probabilistic learning: a normative account. PLoS Comput. Biol. 2015;11:e1004305. doi: 10.1371/journal.pcbi.1004305. - DOI - PMC - PubMed
    1. Bahrami B, et al. Optimally interacting minds. Science. 2010;329:1081–1085. doi: 10.1126/science.1185718. - DOI - PMC - PubMed
    1. Vaghi MM, et al. Compulsivity reveals a novel dissociation between action and confidence. Neuron. 2017;96:348–354. e344. doi: 10.1016/j.neuron.2017.09.006. - DOI - PMC - PubMed