. 2020 Apr 24;11(1):1995.
doi: 10.1038/s41467-020-15831-7.

Targeting zonulin and intestinal epithelial barrier function to prevent onset of arthritis

Affiliations

Targeting zonulin and intestinal epithelial barrier function to prevent onset of arthritis

Narges Tajik et al. Nat Commun. .

Abstract

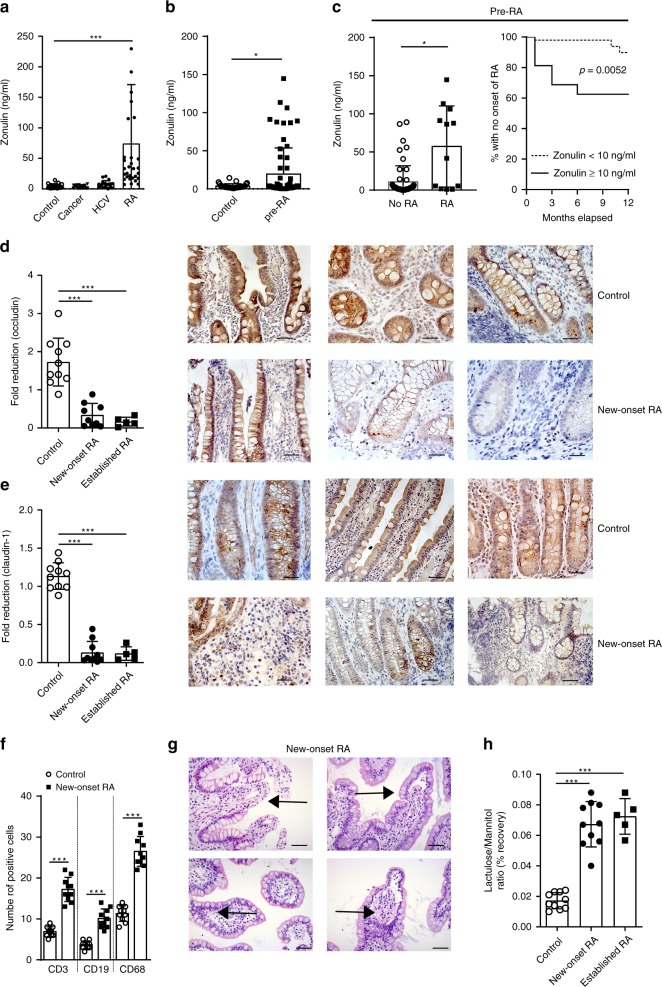
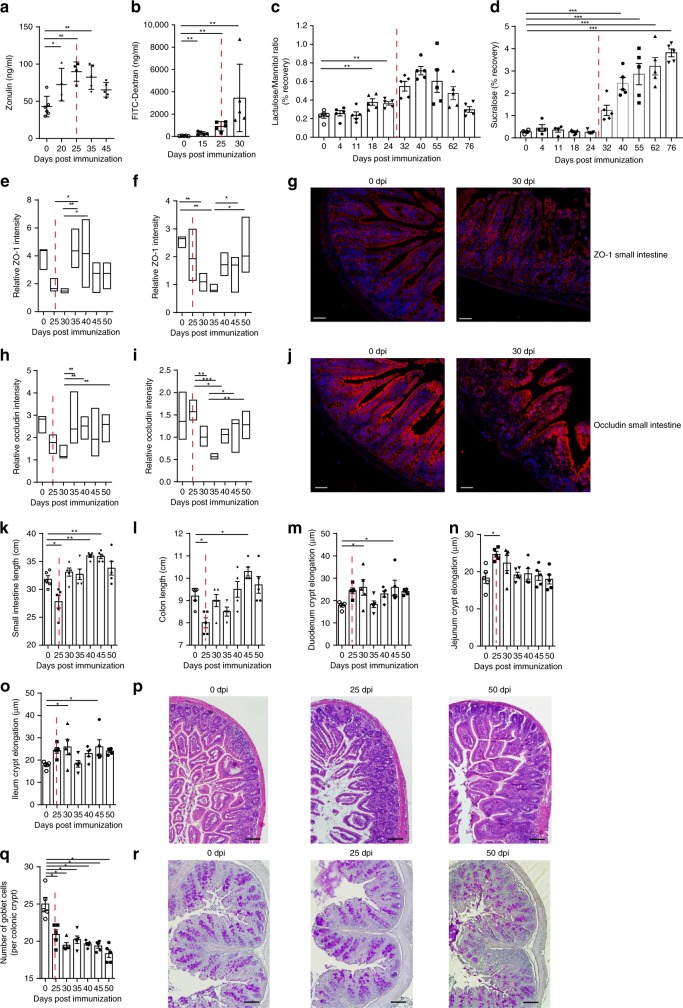
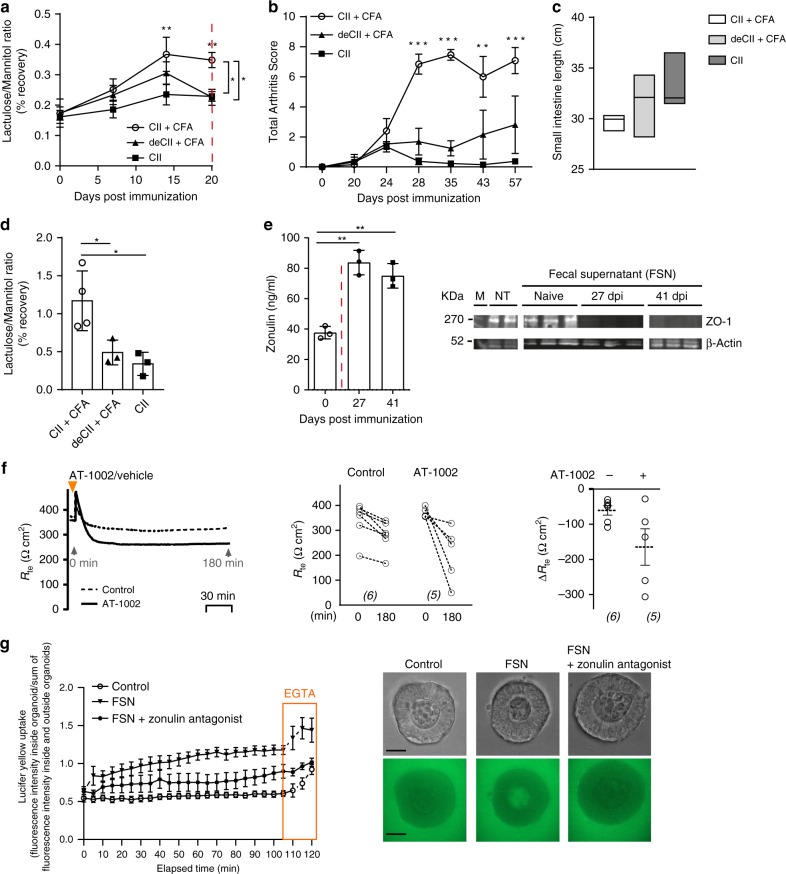
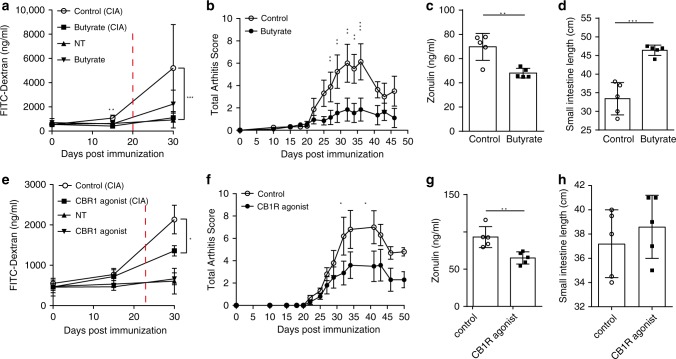
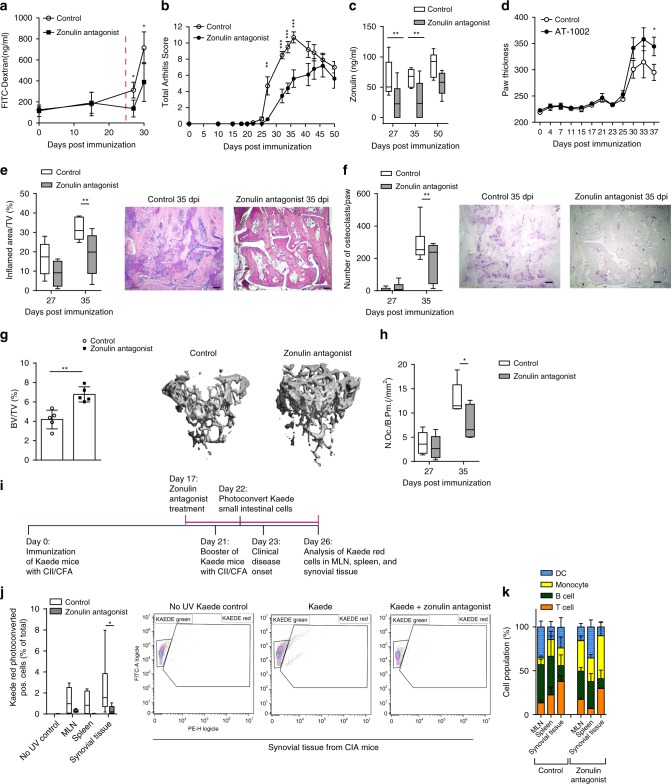
Gut microbial dysbiosis is associated with the development of autoimmune disease, but the mechanisms by which microbial dysbiosis affects the transition from asymptomatic autoimmunity to inflammatory disease are incompletely characterized. Here, we identify intestinal barrier integrity as an important checkpoint in translating autoimmunity to inflammation. Zonulin family peptide (zonulin), a potent regulator for intestinal tight junctions, is highly expressed in autoimmune mice and humans and can be used to predict transition from autoimmunity to inflammatory arthritis. Increased serum zonulin levels are accompanied by a leaky intestinal barrier, dysbiosis and inflammation. Restoration of the intestinal barrier in the pre-phase of arthritis using butyrate or a cannabinoid type 1 receptor agonist inhibits the development of arthritis. Moreover, treatment with the zonulin antagonist larazotide acetate, which specifically increases intestinal barrier integrity, effectively reduces arthritis onset. These data identify a preventive approach for the onset of autoimmune disease by specifically targeting impaired intestinal barrier function.


Conflict of interest statement

The authors declare no competing interests.

Figures

Fig. 1
Fig. 1. Zonulin family peptide levels and intestinal barrier dysfunction in human rheumatoid arthritis.
a Serum zonulin family peptide (zonulin) levels in healthy controls (controls) (n = 41), cancer (n = 19), hepatitis C virus (HCV) (n = 21), and rheumatoid arthritis (RA) (n = 40) patients. b Serum zonulin levels in healthy controls (n = 41) and pre-RA patients (n = 32). c Serum zonulin levels in pre-RA patients with (n = 12) or without (n = 53) later development of RA (left panel); Kaplan–Meier graph showing loss of healthy state and progression to RA patients with low (<10) or elevated (≥10) zonulin levels over month relapsed (right panel). d Fold reduction of occludin expression determined in histological gut biopsy sections in healthy controls (n = 10), new-onset (n = 9) and established RA patients (n = 5) with representative microphotographs (occludin in brown) from three healthy control and three new-onset RA patients. Size bar: 20 µm. e Fold reduction of claudin-1 expression determined in histological gut biopsy sections in healthy controls (n = 10), new-onset (n = 10) and established RA patients (n = 5) with representative microphotographs (claudin-1 in brown) from three healthy control and three new-onset RA patients. Size bar: 20 µm. f Immunohistological quantification of gut infiltrating T cells (CD3), B cells (CD19) and macrophages (CD68) in gut biopsies from healthy controls or new-onset RA patients from stained gut biopsies (n = 10). g Representative H&E-stained gut biopsy microphotographs from a new-onset RA patient; arrows: signs of inflammation. Size bar: 20 µm. h Intestinal permeability assessed by lactulose/mannitol recovery ratio in urine of healthy controls (n = 10), and new-onset (n = 10) and established (n = 5) RA patients after 24 h. Data are expressed as the mean ± s.d. Statistical difference was determined by one-way ANOVA. *p < 0.05; ***p < 0.001. Source data are provided as a Source Data file.
Fig. 2
Fig. 2. Zonulin upregulation, decrease in tight junction proteins and barrier dysfunction before onset of arthritis.
a Time course of serum zonulin levels in mice induced for collagen-induced arthritis (CIA) (n = 5). bd Time course of intestinal permeability assessed by b the serum FITC-Dextran, c lactulose/mannitol urine recovery ratio and d urine sucralose recovery ratio in mice induced for CIA (n = 5). e, f Quantification of ZO-1 (red) expression determined in histological sections of e the ileum (n = 6) and f the colon (n = 6) presented as floating bars (min to max) with line at median. g Representative microphotographs of ZO-1 (red) expression in small intestine. Size bar: 50 µm. h, i Quantification of occludin expression (red) in histological sections of h the ileum (n = 6) and i the colon (n = 6) presented as floating bars (min to max) with line at median with j representative microphotographs of occludin (red) expression in small intestine. Size bar: 50 µm. k, l Time course of the length measurement of k the small intestine and l the colon in mice induced for CIA. mo Time course of m duodenal, n jejunal and o ileal crypt elongation with p representative H&E-stained sections from the ileum. Size bar: 200 µm. q Time course of goblet cell numbers in the colon and r representative PAS-stained sections from the colon. Size bar: 200 µm. Data are derived from two (bj), three (a), or four independent (kr) experiments and expressed as the mean ± s.d. Statistical difference was determined by one-way ANOVA. *p < 0.05; **p < 0.01; ***p < 0.001. Dashed red line: time point of clinical disease onset. Source data are provided as a Source Data file.
Fig. 3
Fig. 3. Dysbiotic microbiota from arthritis mice transfers leaky barrier and mucosal inflammation to GF mice.
a Intestinal permeability assessed by the lactulose/mannitol urine recovery ratio in mice using different collagen-induced arthritis (CIA) immunization protocols namely collagen type II + CFA (CII + CFA), denaturated collagen type II + CFA (deCII + CFA) or collagen type II only (CII) (n = 5). b Arthritis scores in mice induced for CIA using different immunization protocols (n = 5). c Length measurement of the intestine at 20 days post immunization (dpi) in CIA mice (n = 4) presented as floating bars (min to max) with line at median. d Intestinal permeability assessed by the lactulose/mannitol urine recovery ratio in germ-free (GF) mice reconstituted with the donor microbiota from mice immunized with different CIA immunization protocols at 20 dpi (n = 4). e Time course of serum zonulin levels and western blot analysis of ZO-1 expression in Caco-2 cells after 24 h stimulation with intestinal fecal supernatants (FSN) (n = 3). f Transepithelial electrical resistance (TEER) changes in mice induced for CIA treated with the zonulin agonist (AT-1002) (n = 6). g Intestinal organoids from wild-type mice treated with fecal supernatant (FSN) from mice with collagen-induced arthritis at 35 dpi, FSN and zonulin antagonist, or PBS (control). Upon addition of Lucifer yellow (457 Da), confocal fluorescent images were captured every 5 min for 120 min. At 105 min, EGTA was added as a positive control for the ability of the organoids to take up Lucifer yellow. Fluorescence was determined in the organoid lumen and outside of the organoid. Relative intensity values were calculated (fluorescence inside/outside) and are shown for each time point. Each point represents mean values, measured in ten organoids derived from two independent experiments (n = 10). Representative images at time point 55 min are shown. Upper panel: brightfield; lower panel: Lucifer yellow (green), size bar: 50 μm. Data are derived from two (dg) or three (ac) independent experiments and expressed as the mean ± s.d. Statistical difference was determined by one-way (d, e) or two-way ANOVA (a, b, g). *p < 0.05; **p < 0.01; ***p < 0.001. Dashed red line: time point of clinical disease onset. Source data are provided as a Source Data file.
Fig. 4
Fig. 4. Targeting intestinal barrier dysfunction before arthritis onset attenuates development of arthritis.
a, b Time course of a intestinal barrier permeability (n = 5) and b total arthritis scores in collagen-induced arthritis (CIA) or nontreated healthy (NT) mice with or without butyrate treatment (n = 5). c, d Effect of butyrate treatment of mice induced for CIA on their c serum zonulin levels (n = 5) and d intestinal length measurements (n = 5). e, f Time course of e intestinal barrier permeability (n = 5) and f total arthritis scores in CIA or nontreated healthy mice with or without CB1R treatment (n = 5). g, h Effect of CB1R agonist treatment of mice induced for CIA on g serum zonulin levels (n = 5) and h intestine length (n = 5). Data are derived from two (eh) or four (ad) independent experiments and expressed as the mean ± s.d. Statistical difference was determined by Students’ t test, two-tailed (c, d, g) or two-way ANOVA (a, b, e, f). *p < 0.05; **p < 0.01; ***p < 0.001. Dashed red line: time point of clinical disease onset. Source data are provided as a Source Data file.
Fig. 5
Fig. 5. Short-term zonulin antagonist treatment improves bone homeostasis.
ac Time course of a intestinal barrier permeability (n = 5), b total arthritis scores (n = 5) and c serum zonulin levels in collagen-induced arthritis (CIA) mice treated with Larazotide (zonulin antagonist) between 17 and 27 days post immunization (dpi) (n = 5, box and whiskers showing 1–99 percentile). d Time course of arthritis scores in mice induced for CIA treated with the zonulin agonist (AT-1002) (n = 5). e, f Histological analysis of tarsal joints after zonulin antagonist treatment showing e inflamed area and respective H&E-stained sections (size bar: 500 µm) (n = 5, showing 1–99 percentile) as well as f osteoclast numbers with respective TRAP-stained sections (size bar: 500 µm) (n = 5, showing 1–99 percentile). g Bone densities in mice treated with zonulin antagonist and respective micro-CT images (n = 5). h Osteoclast numbers per bone parameter in the tibia of CIA mice treated with zonulin antagonist between 17 and 27 days post immunization (n = 5, showing 1–99 percentile). i Schematic overview of cell trafficking experiments using photoconvertible Kaede mice. j Quantification of photoconverted cells from Kaede mice in lymphoid organs and the synovial tissue following short-term zonulin antagonist treatment (n = 8). k Cell populations identified in MLN, spleen and synovial tissue from Kaede CIA mice at day 26 post immunization (n = 6). Data are derived from three independent experiments and expressed as the mean ± s.d. Statistical difference was determined by Students’ t test, two-tailed (g) or two-way ANOVA (af, h, i). *p < 0.05; **p < 0.01; ***p < 0.001. Dashed red line: time point of clinical disease onset. Source data are provided as a Source Data file.

Comment in

References

    1. Endesfelder D, Engel M, Zu Castell W. Gut immunity and type 1 diabetes: a melange of microbes, diet, and host interactions? Curr. Diabetes Rep. 2016;16:60. doi: 10.1007/s11892-016-0753-3. - DOI - PubMed
    1. Berer K, et al. Commensal microbiota and myelin autoantigen cooperate to trigger autoimmune demyelination. Nature. 2011;479:538–541. doi: 10.1038/nature10554. - DOI - PubMed
    1. Zhang H, Liao X, Sparks JB, Luo XM. Dynamics of gut microbiota in autoimmune lupus. Appl. Environ. Microbiol. 2014;80:7551–7560. doi: 10.1128/AEM.02676-14. - DOI - PMC - PubMed
    1. Jubair WK, et al. Modulation of inflammatory arthritis in mice by gut microbiota through mucosal inflammation and autoantibody generation. Arthritis Rheumatol. 2018;70:1220–1233. doi: 10.1002/art.40490. - DOI - PMC - PubMed
    1. Liu X, et al. Role of the gut microbiome in modulating arthritis progression in mice. Sci. Rep. 2016;6:30594. doi: 10.1038/srep30594. - DOI - PMC - PubMed

Publication types

MeSH terms