. 2020 Apr 24;11(1):2014.
doi: 10.1038/s41467-020-15778-9.

Stress gates an astrocytic energy reservoir to impair synaptic plasticity

Affiliations

Stress gates an astrocytic energy reservoir to impair synaptic plasticity

Ciaran Murphy-Royal et al. Nat Commun. .

Erratum in

Abstract

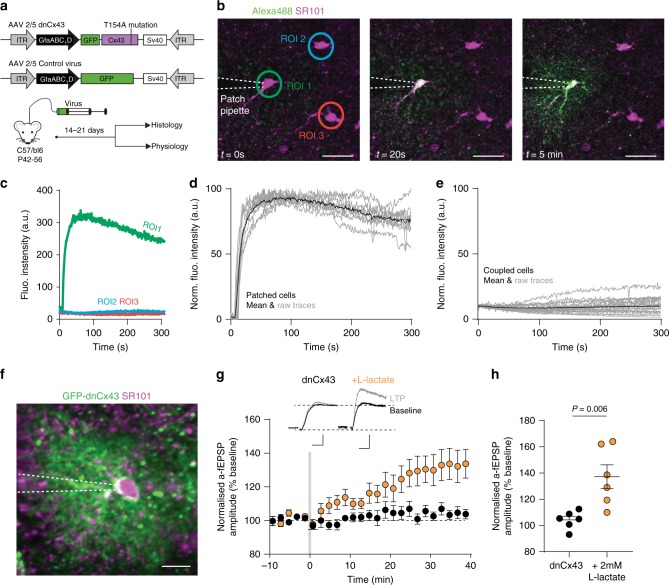
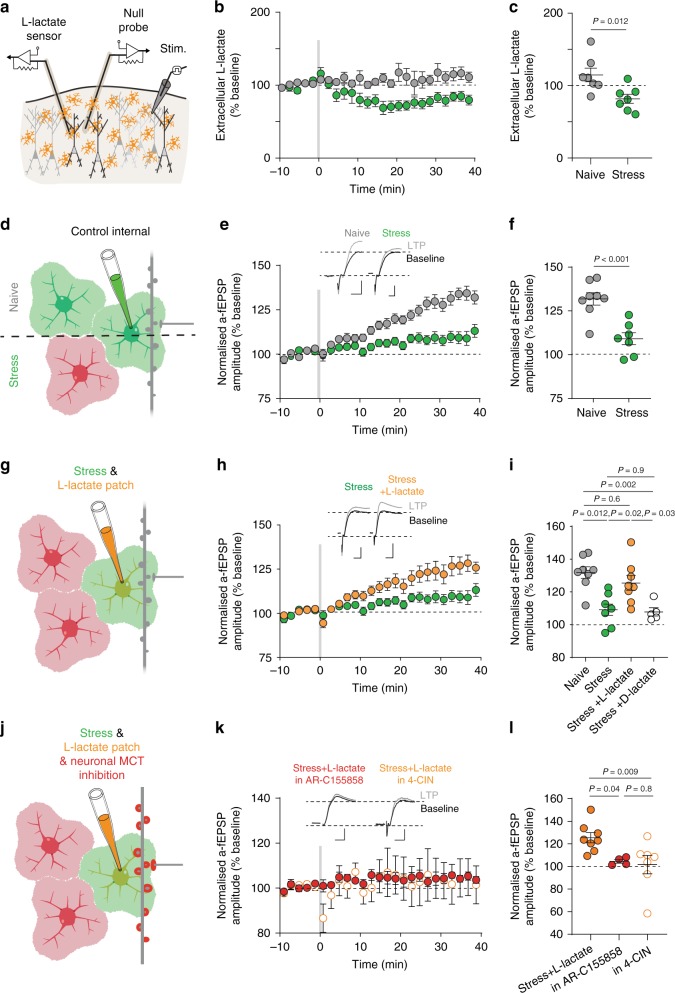
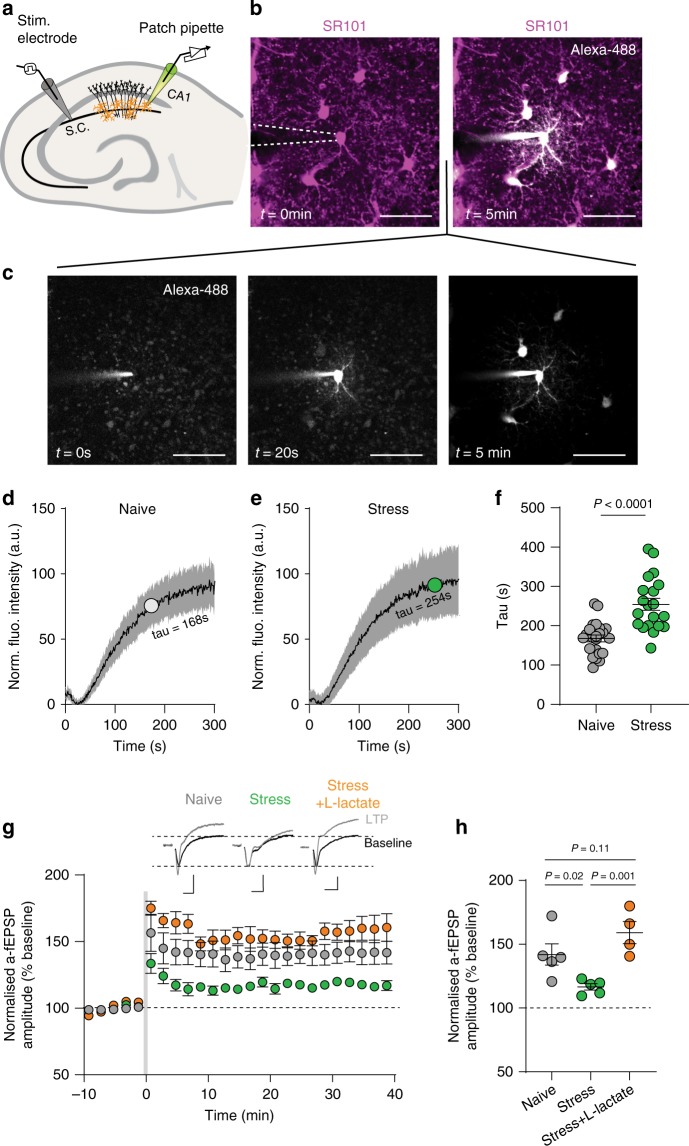
Astrocytes support the energy demands of synaptic transmission and plasticity. Enduring changes in synaptic efficacy are highly sensitive to stress, yet whether changes to astrocyte bioenergetic control of synapses contributes to stress-impaired plasticity is unclear. Here we show in mice that stress constrains the shuttling of glucose and lactate through astrocyte networks, creating a barrier for neuronal access to an astrocytic energy reservoir in the hippocampus and neocortex, compromising long-term potentiation. Impairing astrocytic delivery of energy substrates by reducing astrocyte gap junction coupling with dominant negative connexin 43 or by disrupting lactate efflux was sufficient to mimic the effects of stress on long-term potentiation. Furthermore, direct restoration of the astrocyte lactate supply alone rescued stress-impaired synaptic plasticity, which was blocked by inhibiting neural lactate uptake. This gating of synaptic plasticity in stress by astrocytic metabolic networks indicates a broader role of astrocyte bioenergetics in determining how experience-dependent information is controlled.


Conflict of interest statement

The authors declare no competing interests.

Figures

Fig. 1
Fig. 1. Acute stress alters astrocyte genes associated with connexins and cell growth.
a Upper – illustration of how the knock-in mouse line used for astrocyte RNAseq experiments was generated. Lower – illustration of experimental protocol used. INPUT indicates total RNA (not specific to astrocytes). IP indicates immunoprecipitate, whereby astrocyte ribosomes were isolated. b Validation of RNAseq specificity using Aldh1l1-cre/ERT2 X RiboTag mouse, comparing the expression of several astrocyte-specific with non-specific (i.e. non-astrocytic) genes in our immunoprecipitated (IP) sample. Error bars – mean ± s.e.m. c Heat map of gene expression changes following stress (FDR < 0.05). Upregulated genes in red. Downregulated genes in blue. Green denotes genes involved in Wnt/B-catenin signaling pathway. d Top 25 IPA (Ingenuity Pathway Analysis, Qiagen) Canonical Pathways modified by a single bout of acute stress. The IPA z-score indicates the predicted inhibition, in blue, or activation, in red, of the pathways in accordance with the gene expression changes.
Fig. 2
Fig. 2. Acute stress causes astrocyte hypertrophy and prolongs spontaneous calcium events in astrocyte microdomains.
a Timeline of experimental procedure. b Z-stack projection of SR101 labeled astrocytes (left), which were patched and filled with 3–5 kDa FITC-dextran (middle), for morphological analysis (right). Scale bar: 20 µm. c Comparison on territory sizes of individual astrocytes from naïve and stressed mice. Naïve: n = 5 mice, n = 17 cells. Stress: n = 6 mice, n = 26 cells. Error bars: mean ± s.e.m. Mann–Whitney U-test. d Comparison of astrocyte ramification in naïve and stress conditions. Error bars: mean ± s.e.m. Mann–Whitney U-test. e Representative images of GCaMP6s expression in neocortical astrocytes from naïve (top) and stressed (bottom) mice. Scale bar 35 µm. f Representative raw traces of microdomain calcium from naïve (top, gray) and stressed mice (bottom, green). Scale bars 2.5dF/F and 2 min. g, h Accuracy of classifier in distinguishing naïve from stressed calcium traces. i, k Scatter dot plots comparing frequency (i), amplitude (j), and half-width (k), of individual microdomain calcium events between naïve (n = 904 microdomains) and stressed (n = 1135 microdomains) groups. Unpaired t-tests.
Fig. 3
Fig. 3. Acute stress decreases astrocytic gap junction channel expression and impairs functional coupling in a glucocorticoid-dependent manner.
a Representative western blots comparing expression of gap junction channel proteins connexin 30 (Cx30) and 43 (Cx43) as well as the housekeeping gene GAPDH in naïve and stress conditions. b Summary of Cx30 expression in naïve and stress conditions. Error bars: mean ± s.e.m. n = 10 mice in each group. Unpaired t-test. c Summary of Cx43 expression in naïve and stress conditions. Error bars: mean ± s.e.m. n = 10 mice in each group. Unpaired t-test. d Schematic illustration of experiments in panels ek. Diffusion of low molecular weight dye through astrocytic gap junctions is quantified in stress and naïve conditions. e Representative Z-stack projection of SR101 and Alexa-488 depicting extensive coupling of alexa-488 between astrocytes. Scale bar 35 µm. f SR101 was used to identify astrocytes before real-time measurement of coupling between cells. Color of ROIs correspond to g. Scale bar 20 µm. g Representative traces demonstrating kinetics of Alexa 488 filling and coupling. ROI Region of Interest. h Representative images depicting Alexa-488 filling in coupled astrocyte cell bodies in naïve and stress conditions. Scale bars 10 µm. i Tau values of filling kinetics showing slower coupling following acute stress. Naïve: n = 6 mice, n = 25 cells; Stress: n = 6 mice, n = 28 cells. Error bars: mean ± s.e.m. Unpaired t-test. j scatter dot plot depicting tau of coupled cells in naïve conditions, in CORT (100 nM; 1 h; n = 7 mice, n = 33 cells), in cocktail of RU486 + CORT (RU486 500 nM+CORT 100 nM; n = 3 mice, n = 27 cells), acute brain slice preparation directly after stress (“Stress no wait”; n = 5 mice, n = 12 cells), metyrapone pre-stress (5 mg/ml in drinking water, 24 h before swim stress; n = 5 mice, n = 20 cells), and metyrapone in naïve (5 mg/ml in drinking water, 24 h before slice experiment; n = 3 mice, n = 15 cells) Error bars: mean ± sem. One-way anova, F = 4.03, P = 0.01. k Mean trace of dye coupling in each condition outlined in j with tau value indicated.
Fig. 4
Fig. 4. Astrocyte coupling and metabolic shuttling control LTP.
a Representative images depicting 2-NBDG filling in coupled astrocyte cell bodies in naïve and stress conditions. Scale bars: 10 µm. b Tau values of filling kinetics showing slower coupling following acute stress. Naïve: n = 6 mice, n = 21 cells; Stress: n = 5 mice, n = 23 cells. Error bars: mean ± s.e.m. Mann–Whitney U test. c Mean trace of coupling in naïve and stress conditions with tau value indicated. d schematic diagram illustrating the placement of patch pipette, extracellular recording electrode, and stimulating electrode. e 2P image depicting electrode placement. Dye in the patch pipette passes between astrocytes through gap-junction channels. Inset, transmitted light image. Scale bar: 100 μm. f A strong linear relationship exists between the slope of the fEPSP and the amplitude of the a-fEPSP (n = 6 mice, n = 8 paired recordings). Error bars: mean ± s.e.m. Pearson’s correlation coefficient, r = 0.99, R2 = 0.97, P = 0.0003. g Example traces depicting changes in both a-fEPSP and fEPSP waveform with increased stimulation voltage. The amplitude of the a-fEPSP is calculated by measuring the difference (mV) between the downward peak and the point 30 ms following this peak. Scale bars for a-fEPSP: 0.5 mV, 10 ms. Scale bars for fEPSP: 0.2 mV, 10 ms. h Maximum intensity z-projection depicting lack of coupling between astrocytes in the presence of 100 μM carbenoxolone. Scale bar: 20 µm. i Normalized a-fEPSP amplitude depicting LTP impairment in the presence of the gap-junction channel blocker carbenoxolone (100 μM; n = 4 mice, n = 5 cells) and D,L-APV (50 μM; n = 4 mice, n = 4 cells). Error bars: mean ± s.e.m. Inset, example traces pre- (black) and post- (gray) LTP induction. Scale bars 0.2 mV, 20 ms. j Scatter dot plot depicting the extent of long-term plasticity 30–40 min following theta burst stimulation. naïve: n = 6 mice, n = 7 cells, n = 4 mice, n = 4 cells; CBX: n = 4 mice, n = 5 cells. Error bars: mean ± s.e.m. One-way ANOVA (k) Illustration. l Normalized a-fEPSP amplitude depicting the effect of patching and filling astrocytes with d-lactate on LTP in naïve animals (black). Naïve+d-lactate: n = 4 mice, n = 7 cells. Error bars: mean ± s.e.m. Inset, example average traces pre- and post-LTP in naïve and naïve+D-lactate conditions. Scale bar 0.5 mV, 5 ms in naïve and 0.25 mV, 5 ms in naïve+d-lactate. m Scatter dot plot indicating the extent of LTP when astrocytes were patched with d-lactate. n = 4 mice, n = 7 cells. Error bars: mean ± s.e.m. One-sample t-test.
Fig. 5
Fig. 5. Reduction of connexin 43 gap junction channel function impairs LTP and can be rescued by overcoming a syncytial energetics deficit.
a Diagram indicating dnCx43 construct with GFP-tag and single point mutation and control GFP virus, both under GfaABC1D promoter. Adult mice were injected before histology and physiological recordings. b Representative images of the effect of dnCx43 expression on astrocyte coupling at t = 0 s (before patching), t = 20 s following whole-cell patch-clamp where dye is in patched astrocyte, and at t = 5 min where dye remains in patched cell and has not spread to nearby astrocytes. Scale bar 35 µm. c Raw data showing alexa-488 fluorescence intensity changes in astrocytes from b. d Normalized fluorescence intensity of patched cells expressing dnCx43. Black trace is mean, gray traces are raw data from 10 patched astrocytes. e Normalized fluorescence intensity of coupled cells expressing dnCx43. Black trace is mean, gray traces are raw data from 21 coupled astrocytes. f Two-photon average intensity z-projection of single dnCx43-expressing astrocyte co-labeled with SR101. Scale bar 15 µm. g Normalized a-fEPSP amplitude demonstrating effects of dnCx43 (black) on LTP induced by 10 s theta burst stim (gray bar), which was rescued by supplementing astrocytes with 2 mM l-lactate (orange). dnCx43: n = 5 mice, n = 6 cells. dnCx43 + l-lactate: n = 5 mice, n = 6 cells. Error bars: mean ± s.e.m. Unpaired t-test. Inset, example traces pre- (black) and post- (gray) LTP induction. Scale bars 0.5 mV, 10 ms. h Scatter dot plot depicting the extent of long-term plasticity 30–40 min following theta burst stimulation (data from g). Error bars: mean ± s.e.m. Unpaired t-test.
Fig. 6
Fig. 6. l-lactate delivery through astrocytes rescues stress-induced impairment of LTP.
a Schematic representation of measuring extracellular l-lactate concentration using enzymatic probes. One probe was coated in an enzymatic layer specific to l-lactate generating l-lactate specific signals, one ‘null probe’ did not have the enzymatic layer and was used to account for non-specific probe readings, and a monopolar stimulating electrode placed nearby. b Normalized extracellular l-lactate concentration in naïve (gray) and stress (green) conditions. Gray bar depicts theta burst stim. Error bars: mean ± s.e.m. c Scatter dot plot extracellular l-lactate levels at 30–40 min post-stim. Error bars: mean ± s.e.m. Unpaired t-test. d Schematic representation of experiments in e and f, recording a-fEPSPs from cortical astrocytes in naïve (top) and stress conditions (bottom), where coupling is reduced. e LTP is impaired following acute swim stress. mean ± s.e.m. Inset, example a-fEPSP traces pre- (black) and post-LTP (gray) induction. Scale bars: 0.5 mV, 10 ms. f Comparison of LTP between naïve and stressed mice. Error bars: mean ± s.e.m. Unpaired t-test. g Diagram representing following experiments (h, i). Astrocytes from stressed mice were patched with l-lactate and the effect on synaptic activity in this cell’s domain was recorded. h Normalized a-fEPSP amplitude depicting extent of recovery of LTP with supplementation of l-lactate into the patched astrocyte. Error bars: mean ± s.e.m. Inset, example a-fEPSP traces pre- and post-LTP induction in naïve (scale: 0.5 mV,10 ms), stress (scale: 0.5 mV,10 ms), stress+l-lactate (scale: 1.0 mV,10 ms). i Scatter dot plot comparing the extent of LTP in each condition (Naïve: n = 8 mice, n = 8 cells; Stress: n = 8 mice, n = 8 cells; Stress+l-lactate:n = 6 mice, n = 7 cells; Stress+d-lactate:n = 5 mice, n = 5 cells; mean ± s.e.m.). Error bars: mean ± s.e.m. One-way Anova, F(3,24) = 9.55, P = 0.0002. j Schematic diagram representing following experiments (k, l). Astrocytes were patched with l-lactate and the effect on synaptic activity in this cell’s domain was recorded, in the presence of the monocarboxylate transporter inhibitors AR-C155858 (1 µM) or 4-CIN (100 µM) blocking neuronal l-lactate uptake. k Normalized a-fEPSP amplitude depicting lack of recovery of LTP with supplementation of l-lactate into the patched astrocyte when blocking neuronal l-lactate uptake. Error bars: mean ± s.e.m. Inset, representative a-fEPSP traces pre- and post-LTP induction. scale: 1 mV,10 ms. l Scatter dot plot comparing LTP amplitude between Stress+l-lactate and Stress+l-lactate in the presence of AR-C155858 or 4-CIN. Error bars: mean ± s.e.m. One-way ANOVA, F = 4.91, t = 0.02.
Fig. 7
Fig. 7. l-lactate delivery through astrocytes rescues stress-induced impairment of LTP in the hippocampus.
a Schematic representation of subsequent patch-clamp experiments in CA1 region of ventral hippocampus (s.c. denotes schaffer collateral). b Representative images depicting a dye flux through astrocyte network in ventral hippocampal slices, before patching (left) and 5 min after whole-cell patch (right). Scale bar 50 µm. c Series of images from b depicting progression of dye flux through gap junction connected astrocytes at 0 s, 20 s, and 5 min. d Mean trace of coupling in naïve group with tau value indicated. Error indicates standard deviation. n = 23 cells. e Mean trace of coupling in stress group with tau value indicated. Error indicates standard deviation. n = 20 cells. f Scatter dot plot quantifying coupling between hippocampal astrocytes in naïve and stress conditions. Naïve: n = 23 cells, stress: n = 20 cells. Error bars: mean ± s.e.m. g Time series comparing hippocampal LTP in naïve, stress, and stress+l-lactate conditions, measured through astrocyte-patch technique. High-frequency stimulation (HFS) indicated by gray bar. Naïve: n = 3 mice, n = 5 cells; Stress: n = 3 mice, n = 5 cells; Stress+l-lactate: n = 3 mice, n = 4 cells. Error bars: mean ± s.e.m. Inset, representative a-fEPSP traces pre- and post-LTP induction. Scale bars: 0.5 mV,10 ms. h Scatter dot plot comparing amplitude of potentiation at 30–40 min post HFS from g. Error bars: mean ± s.e.m. One-way ANOVA, F = 9.46, P = 0.0041.

References

    1. Bains JS, Cusulin JIW, Inoue W. Stress-related synaptic plasticity in the hypothalamus. Nat. Rev. Neurosci. 2015;16:377–388. doi: 10.1038/nrn3881. - DOI - PubMed
    1. Ulrich-Lai YM, Herman JP. Neural regulation of endocrine and autonomic stress responses. Nat. Rev. Neurosci. 2009;10:397–409. doi: 10.1038/nrn2647. - DOI - PMC - PubMed
    1. Schönfeld P, Ackermann K, Schwabe L. Remembering under stress: different roles of autonomic arousal and glucocorticoids in memory retrieval. Psychoneuroendocrinology. 2014;39:249–256. doi: 10.1016/j.psyneuen.2013.09.020. - DOI - PubMed
    1. Hidalgo V, et al. Acute stress affects free recall and recognition of pictures differently depending on age and sex. Behav. Brain Res. 2015;292:393–402. doi: 10.1016/j.bbr.2015.07.011. - DOI - PubMed
    1. Buchanan TW, Tranel D. Stress and emotional memory retrieval: Effects of sex and cortisol response. Neurobiol. Learn. Mem. 2008;89:134–141. doi: 10.1016/j.nlm.2007.07.003. - DOI - PMC - PubMed

Publication types

MeSH terms

Grants and funding