. 2020 Apr 24;11(1):1990.
doi: 10.1038/s41467-020-15971-w.

Identification of therapeutics that target eEF1A2 and upregulate utrophin A translation in dystrophic muscles

Affiliations

Identification of therapeutics that target eEF1A2 and upregulate utrophin A translation in dystrophic muscles

Christine Péladeau et al. Nat Commun. .

Abstract

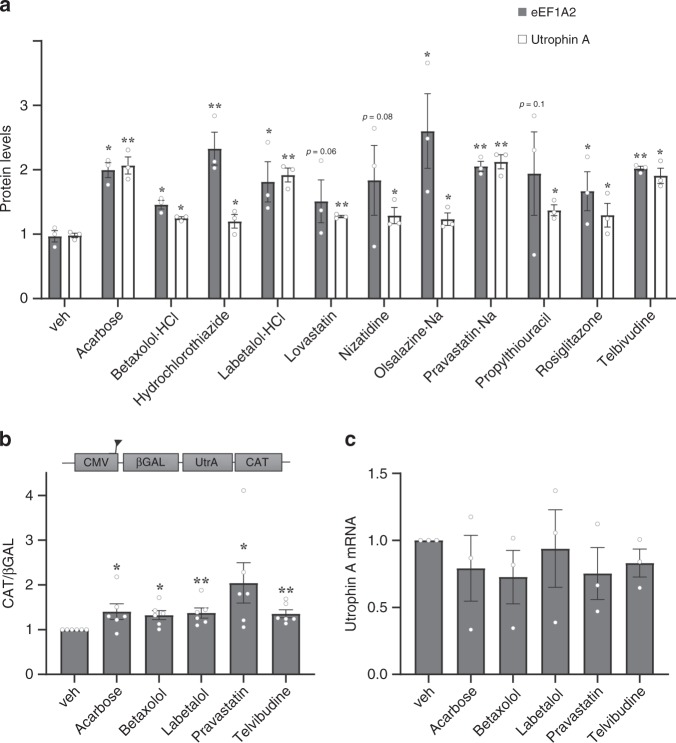
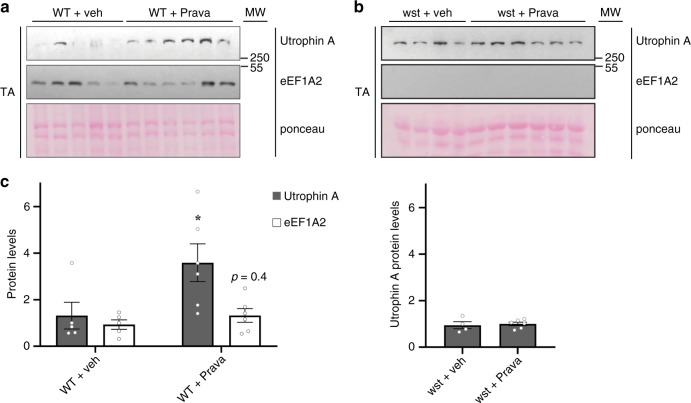
Up-regulation of utrophin in muscles represents a promising therapeutic strategy for the treatment of Duchenne Muscular Dystrophy. We previously demonstrated that eEF1A2 associates with the 5'UTR of utrophin A to promote IRES-dependent translation. Here, we examine whether eEF1A2 directly regulates utrophin A expression and identify via an ELISA-based high-throughput screen, FDA-approved drugs that upregulate both eEF1A2 and utrophin A. Our results show that transient overexpression of eEF1A2 in mouse muscles causes an increase in IRES-mediated translation of utrophin A. Through the assessment of our screen, we reveal 7 classes of FDA-approved drugs that increase eEF1A2 and utrophin A protein levels. Treatment of mdx mice with the 2 top leads results in multiple improvements of the dystrophic phenotype. Here, we report that IRES-mediated translation of utrophin A via eEF1A2 is a critical mechanism of regulating utrophin A expression and reveal the potential of repurposed drugs for treating DMD via this pathway.


Conflict of interest statement

The authors declare no competing interests.

Figures

Fig. 1
Fig. 1. Overexpression of eEF1A2 in skeletal muscles increases endogenous utrophin A protein levels and utrophin A IRES activity.
a Representative western blot comparing the expression profile of eEF1A2 protein in fast (EDL) and slow (soleus) skeletal muscles harvested from 6 to 7-week-old wild-type (WT) and mdx mice. β-actin was used as a loading control (N = 3). b eEF1A2 (eEF1A2-pcDNA) expression construct or control (pcDNA3.1) were electroporated into TA muscles of wild-type and mdx mice as well as in TA muscles from utrophin A 5′UTR (CMV/βGAL/UtrA/CAT) reporter transgenic mice. Representative western blots of endogenous utrophin A protein expression in wild-type and mdx mice following overexpression of eEF1A2 with the respective quantification. Ponceau staining was used as a loading control. Note the increase in utrophin A protein levels in skeletal muscles overexpressing eEF1A2 (N = 3). c Relative IRES activity as determined by a ratio of CAT: β-GAL activity in TA muscles of utrophin A 5’UTR (CMV/βGAL/UtrA/CAT) transgenic mice overexpressing eEF1A2 (N = 9). On the right, representative western blots demonstrating expression levels of the myc tag containing pcDNA-eEF1A2 expression vector and eEF1A2 expression levels in TA transgenic mouse muscle. Error bars represent SEM. *P < 0.05, versus control. Two-tailed Student's t-test were performed to determine statistical differences in these experiments. Source data are provided as a Source Data file.
Fig. 2
Fig. 2. Pharmacological activation of eEF1A2 and utrophin A by FDA-approved drugs.
a An ELISA-based high-throughput drug screen was performed by treating C2C12 cells with 262 different FDA-approved drugs or vehicle control for 24 hours. Quantification of eEF1A2 and utrophin A protein levels from the 11 FDA-approved drugs considered as leads. A drug is considered a hit based on its ability to increase eEF1A2 and utrophin A protein levels over vehicle control (N = 3). b Activation of the utrophin 5′UTR IRES reporter construct by 24-h treatment of FDA-approved drugs in C2C12 cells. The treated muscle cell samples were subjected to a reporter assay to determine CAT and β-GAL activity representative of IRES activity. CAT activation was normalized to β-GAL and each drug activation was normalized to vehicle control (N = 6). c Relative quantification of utrophin A mRNA levels in C2C12 treated cells, determined by qRT-PCR (N = 3). The values were normalized to 18S mRNA levels. Error bars represent SEM. *P < 0.05, **P < 0.01, versus vehicle control. One-way ANOVA and Bonferroni post-hoc test was performed to determine statistical differences. Source data are provided as a Source Data file.
Fig. 3
Fig. 3. Pharmacological stimulation of utrophin A in transgenic bicistronic utrophin 5’UTR IRES harboring mice.
Transgenic mice were treated with Betaxolol (Bet) (5 mg/kg), Pravastatin (Prava) (2 mg/kg) or vehicle for 7 days. a, b Western blots and quantification of eEF1A2 and utrophin A protein levels normalized to ponceau using protein extracts from TA muscles from the treated transgenic mice. c Activation of utrophin 5′UTR IRES reporter construct after a 7-day treatment with Bet and Prava in transgenic mice. Representative western blots of CAT and β-GAL protein levels from TA muscles from the treated transgenic mice. The ratio of CAT/β-GAL level of each drug normalized to vehicle control represents the IRES activity. Recombinant CAT is used as a positive control. d Utrophin A mRNA levels in Bet-, Prava- or vehicle-treated transgenic mouse TA muscles, standardized to 18S. N = 8, error bars represent SEM. *P < 0.05, **P < 0.01, ***P < 0.001, vs vehicle control. Two-tailed Student's t-test (a, b) and one-way ANOVA, accompanied by Bonferroni post-hoc test (c, d), were performed to determine statistical differences in these experiments. Source data are provided as a Source Data file.
Fig. 4
Fig. 4. The effects of Betaxolol and Pravastatin treatment on muscle strength of mdx mice.
Mdx mice were treated with Betaxolol (Bet), Pravastatin (Prava) or vehicle for 4 weeks. a mdx and wild-type (WT) mouse body weight (g). b Forelimb and c Hindlimb grip strength analysis of WT, vehicle-treated, Bet- or Prava-treated mdx mice normalized or not normalized to body weight. N = 6 for WT and N = 8 for mdx + veh or treated, error bars represent SEM. *P < 0.05, **P < 0.01 vs vehicle treated mdx mice. One-way ANOVA and Bonferroni post-hoc test was performed to determine statistical differences for (ac). A split-plot ANOVA was used for force drop analysis (d). Source data are provided as a Source Data file.
Fig. 5
Fig. 5. Increase of sarcolemmal localization and protein levels of utrophin A by Betaxolol and Pravastatin treatment in mdx mice.
a Representative examples of cross-sections obtained from TA muscles of wild-type (WT) mice and mdx mice treated with Betaxolol (Bet), Pravastatin (Prava) or vehicle control (saline) for 4 weeks, were immunostained with utrophin A (UTR-A) antibody. Scale bars, 50 mm. b Quantification of sarcolemmal utrophin A positive fibers to total muscle fibers. c, d Western blots and quantification of eEF1A2 and utrophin A protein levels normalized to ponceau using protein extracts from TA muscles from the treated mdx mice. e Utrophin A mRNA levels in Bet-, Prava- or vehicle-treated mdx mouse TA muscles, standardized to 18S. N = 6 for WT and N = 8 for mdx + veh or treated. Error bars represent SEM. *P < 0.05, **P < 0.01, vs vehicle control. One-way ANOVA and Bonferroni post-hoc test was performed to determine statistical differences. Source Data for be are provided in the Source Data File.
Fig. 6
Fig. 6. Morphological features of mdx muscle fibers treated with Betaxolol and Pravastatin.
a Representative examples of cross-sections of TA muscles from wild-type (WT) and mdx mice treated with Betaxolol (Bet), Pravastatin (Prava) or with vehicle (saline) that were stained using hematoxylin and eosin. b Representative examples of cross-sections of TA muscles from WT mice and mdx mice treated with Bet, Prava or vehicle that were immunostained with goat-anti-mouse IgM Alexa 594. c Percentage of central nucleation in TA muscle fibers. d Quantification of IgM positive fibers vs total muscle fibers. N = 6 for WT and N = 8 for mdx + veh or treated. Error bars represent SEM, *P < 0.05, **P < 0.01, ***P < 0.001, significantly different from mdx vehicle control. Scale bars, 50 mm. One-way ANOVA and Bonferroni post-hoc test was performed to determine statistical differences. Source Data for c and d are provided in the Source Data File.
Fig. 7
Fig. 7. Pravastatin does not induce a utrophin A increase in eEF1A2-null mice.
eEF1A2-null mice (wasted mice—wst) and wild-type mice (WT) were treated with Pravastatin (Prava) (2 mg/kg) or saline for 5 days. a, b Western blots of utrophin A and eEF1A2 protein levels using protein extracts from TA muscles from wild-type and wasted mice treated with pravastatin or vehicle control. c Quantification of utrophin A and eEF1A2 protein levels normalized to ponceau in treated WT and wasted mice. N = 4 for WT or wst + veh and N = 6 for WT or wst + Prava. Error bars represent SEM, *P < 0.05, significantly different from vehicle control. Two-tailed Student's t-test was performed to determine statistical differences. Source data are provided as a Source Data file.

References

    1. Blake DJ, Weir A, Newey SE, Davies KE. Function and genetics of dystrophin and dystrophin-related proteins in muscle. Physiological Rev. 2002;82:291–329. doi: 10.1152/physrev.00028.2001. - DOI - PubMed
    1. Ervasti JM, Ohlendieck K, Kahl SD, Gaver MG, Campbell KP. Deficiency of a glycoprotein component of the dystrophin complex in dystrophic muscle. Nature. 1990;345:315–319. doi: 10.1038/345315a0. - DOI - PubMed
    1. Hoffman EP, Brown RH, Kunkel LM. Dystrophin: The protein product of the duchenne muscular dystrophy locus. Cell. 1987;51:919–928. doi: 10.1016/0092-8674(87)90579-4. - DOI - PubMed
    1. Miyatake S, Shimizu-Motohashi Y, Takeda S, Aoki Y. Anti-inflammatory drugs for Duchenne muscular dystrophy: focus on skeletal muscle-releasing factors. Drug Des. Devel Ther. 2016;10:2745–2758. doi: 10.2147/DDDT.S110163. - DOI - PMC - PubMed
    1. Birnkrant DJ, et al. Diagnosis and management of Duchenne muscular dystrophy, part 2: respiratory, cardiac, bone health, and orthopaedic management. Lancet Neurol. 2018;17:347–361. doi: 10.1016/S1474-4422(18)30025-5. - DOI - PMC - PubMed

Publication types

MeSH terms

Grants and funding

LinkOut - more resources