. 2020 Apr 24;11(1):2020.
doi: 10.1038/s41467-020-15951-0.

Non-coding somatic mutations converge on the PAX8 pathway in ovarian cancer

Affiliations

Non-coding somatic mutations converge on the PAX8 pathway in ovarian cancer

Rosario I Corona et al. Nat Commun. .

Abstract

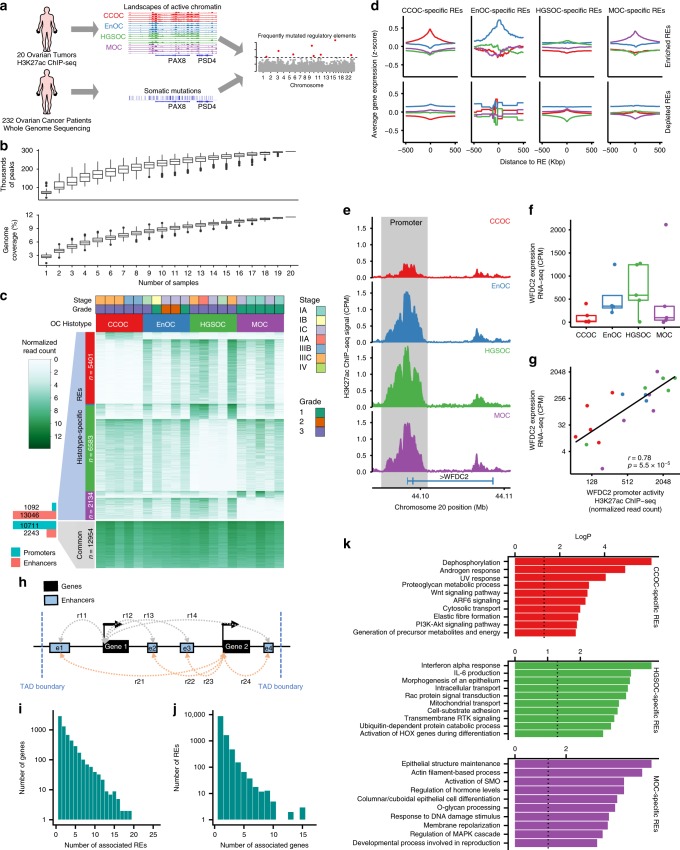
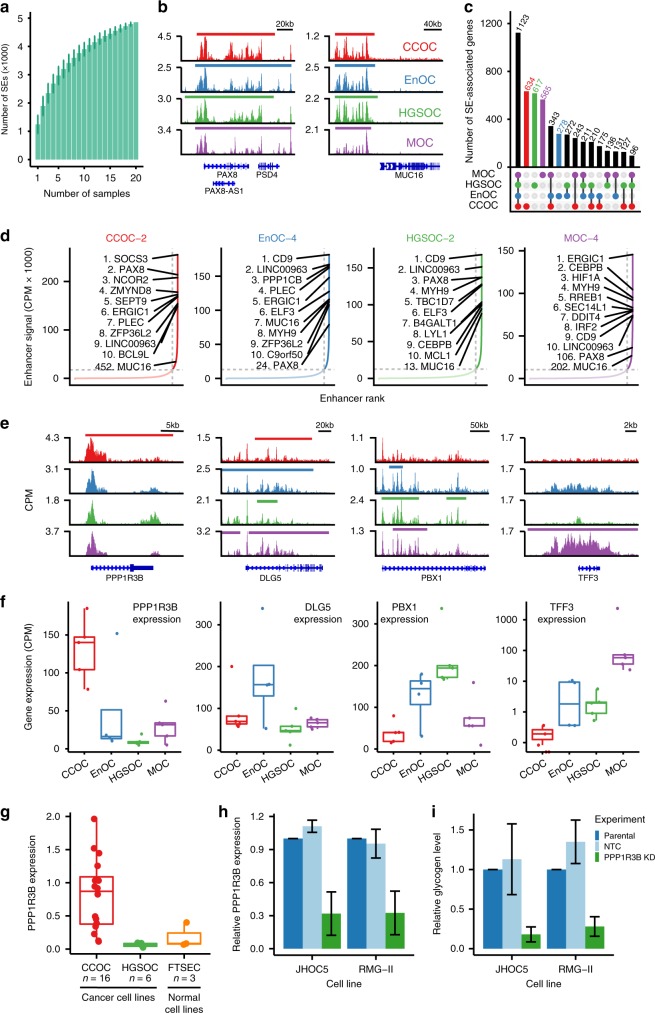
The functional consequences of somatic non-coding mutations in ovarian cancer (OC) are unknown. To identify regulatory elements (RE) and genes perturbed by acquired non-coding variants, here we establish epigenomic and transcriptomic landscapes of primary OCs using H3K27ac ChIP-seq and RNA-seq, and then integrate these with whole genome sequencing data from 232 OCs. We identify 25 frequently mutated regulatory elements, including an enhancer at 6p22.1 which associates with differential expression of ZSCAN16 (P = 6.6 × 10⁻⁴) and ZSCAN12 (P = 0.02). CRISPR/Cas9 knockout of this enhancer induces downregulation of both genes. Globally, there is an enrichment of single nucleotide variants in active binding sites for TEAD4 (P = 6 × 10-11) and its binding partner PAX8 (P = 2×10⁻¹⁰), a known lineage-specific transcription factor in OC. In addition, the collection of cis REs associated with PAX8 comprise the most frequently mutated set of enhancers in OC (P = 0.003). These data indicate that non-coding somatic mutations disrupt the PAX8 transcriptional network during OC development.


Conflict of interest statement

The authors declare no competing interests.

Figures

Fig. 1
Fig. 1. Epigenomic profiling in 20 epithelial OCs reveals histotype-specific REs.
a Study overview— leveraging landscapes of active chromatin in ovarian cancer to identify frequently mutated regulatory elements. b Number of peaks and genome coverage as a function of number of samples. c Heatmap showing the normalized H3K27ac ChIP-seq signal for the 20 OC samples (columns) at the active REs (rows). d Gene expression averaged by OC histotype (CCOC, red; EnOC, blue; HGSOC, green; MOC, purple) around histotype-specific REs. eg WFDC2 locus; e H3K27ac ChIP-seq signal in the promoter region (chr20:44,095,981–44,101,060) and f gene expression in different histotypes of OC. g Normalized H3K27ac ChIP-seq signal versus WFDC2 gene expression. h Diagram of the enhancer–gene association strategy that computes the Spearman’s correlation between enhancer activity (normalized H3K27ac ChIP-seq signal) and gene expression (normalized RNA-seq) (rij) between all enhancers and all genes within the same topologically associating domain (TAD). A putative enhancer–gene association is established if the correlation (rij) is significant (rij > 0.4 and P-value < 0.05). i Histogram of number of associated genes per RE and j number of associated REs per gene. k Pathway enrichment analysis of genes associated with histotype-specific REs.
Fig. 2
Fig. 2. Histotype-specific super-enhancers.
a Number of super-enhancers as a function of number of samples. b PAX8 and MUC16 loci show common OC SEs. c UpsetR plot showing the size of the all the subsets of super-enhancer associated genes by whether they are present in CCOC, EnOC, HGSOC, and MOC. d Plots of all enhancers ranked by enhancer signal for four representative OC samples, one for each histotype, showing the top 10 SEAGs, and the rank of PAX8 SE, MUC16 SE, and EPCAM SE for each sample. e and f Examples of histotype-specific SEAGs. Gene tracks e and gene expression f that show one example of histotype-specific SEAGs for each histotype (PPP1R3B, DLG5, PBX1, and TFF3 for CCOC, EnOC, HGSOC, and MOC, respectively). g PPP1R3B expression in CCOC, HGSOC, and FTSEC cell lines. Relative PPP1R3B expression h and glycogen level i in JHOC5 and RMG-II cell lines before and after PPP1R3B knockdown, error bars indicate one standard deviation of the mean values from three independent experiments (performed with technical replicates).
Fig. 3
Fig. 3. Frequently mutated regulatory elements (FMREs) in OC.
a QQ-plot that shows the expected (x-axis) and observed (y-axis) significance values of the mutational burden for all active REs in HGSOC. b Manhattan plot that shows the genomic location (x-axis) and significance value (y-axis) of the mutational burden for all active REs in HGSOC. c Heatmap that shows the mutational burden (P-value) of the 25 FMREs across CCOC, EnOC, and HGSOC; asterisks represent FDR ≤ 10%. d Volcano plot that shows the fold change of median gene expression (x-axis) and the significance value (y-axis) of the putative target gene of samples with overlapping single nucleotide variants in an active RE vs. wild-type samples. The histogram on top of the scatterplot shows more overexpression events (−log2(FC) > 0) in the presence of single nucleotide variants than under expression events (−log2(FC) < 0). e The KLF6 locus, location of SNVs, SE, and PAX8-binding sites. f The 6p22.1 mutated enhancer, location of SNVs, TEAD4-binding sites and motif logo relative shows position of the recurrent mutation g Spearman’s rho correlation between the activity of a FMRE (6p22.1 enhancer) and nearby genes. h and i Single-cell-derived clones after CRISPR/Cas9-mediated deletion in the SHIN3 HGSOC cell line. h Gel electrophoresis showing the genotype of the 16 clones (3 OR1C1 control knockouts (KO), 4 wild type (WT), 6 partial KO (PKO), and 3 complete KO (CKO)). i Relative expression of ZSCAN16, ZSCAN12, HIST1H2AI, and ZSCAN31 in the 16 clones. j Fold change and P-value of the enrichment of HGSOC somatic SNVs in active TF-binding sites using publicly available MCF-7 TF ChIP-seq data.
Fig. 4
Fig. 4. Gene-centric mutation rate aggregated across the collection of REs associated to a gene (CREAG).
a QQ-plot that shows the expected (x-axis) and observed (y-axis) significance values of mutational burden for all CREAGs. b Super-enhancer associated genes that have somatic SNVs. c Manhattan plot showing the genomic location (x-axis) and significance (y-axis) of mutational burden for all CREAGs. d Enrichment of super-enhancer associated genes in FM CREAGs (dark green) vs. random selection (light green) (PGSEA = 0.01). e Volcano plot showing the fold change of median gene expression (x-axis) and the significance value (y-axis) of the putative target gene in samples with single nucleotide variants in a CREAG vs. wild-type samples. The histogram on top of the scatterplot shows more overexpression events (−log2(FC) > 0) in the presence of single nucleotide variants than under expression events (−log2(FC) < 0). f HGSOC (n = 169) non-coding oncoplot showing the top 10 ranking genes in terms of number of samples with mutations overlapping its CREAG. g PAX8 locus showing the mutations within the PAX8 CREAG. h The number of samples with mutations overlapping the PAX8 CREAG are statistically significant in Skin-Melanoma, Ovary-Adeno-CA and Kidney-RCC datasets. i HGSOC (n = 110) oncoplot with PAX8 copy number variation, PAX8 CREAG mutation, TEAD4 and PAX8-binding site mutations.

References

    1. Phelan CM, et al. Identification of 12 new susceptibility loci for different histotypes of epithelial ovarian cancer. Nat. Genet. 2017;49:680–691. doi: 10.1038/ng.3826. - DOI - PMC - PubMed
    1. Köbel M, et al. Ovarian carcinoma subtypes are different diseases: implications for biomarker studies. PLoS Med. 2008;5:e232. doi: 10.1371/journal.pmed.0050232. - DOI - PMC - PubMed
    1. Wang YK, et al. Genomic consequences of aberrant DNA repair mechanisms stratify ovarian cancer histotypes. Nat. Genet. 2017;49:856–865. doi: 10.1038/ng.3849. - DOI - PubMed
    1. Lawrenson, K. et al. Integrated molecular profiling studies to characterize the cellular origins of high-grade serous ovarian cancer. Preprint at 10.1101/330597 (2018).
    1. Wang Y, et al. Tubal origin of ovarian endometriosis and clear cell and endometrioid carcinoma. Am. J. Cancer Res. 2015;5:869–879. - PMC - PubMed

Publication types

MeSH terms