. 2020 Apr 24;11(1):2008.
doi: 10.1038/s41467-020-15754-3.

Recent hemispheric asymmetry in global ocean warming induced by climate change and internal variability

Affiliations

Recent hemispheric asymmetry in global ocean warming induced by climate change and internal variability

Saurabh Rathore et al. Nat Commun. .

Abstract

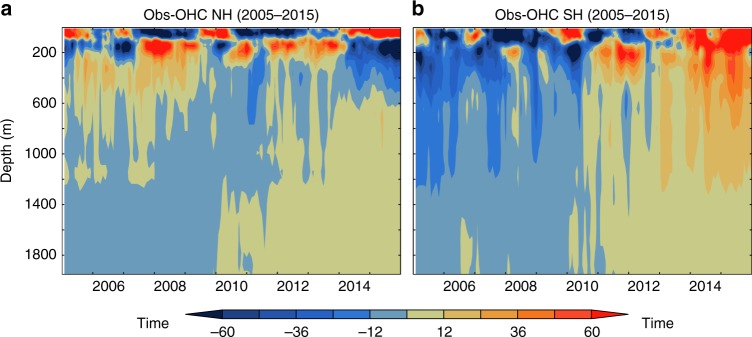
Recent research shows that 90% of the net global ocean heat gain during 2005-2015 was confined to the southern hemisphere with little corresponding heat gain in the northern hemisphere ocean. We propose that this heating pattern of the ocean is driven by anthropogenic climate change and an asymmetric climate variation between the two hemispheres. This asymmetric variation is found in the pre-industrial control simulations from 11 climate models. While both layers (0-700 m and 700-2000 m) experience steady anthropogenic warming, the 0-700 m layer experiences large internal variability, which primarily drives the observed hemispheric asymmetry of global ocean heat gain in 0-2000 m layer. We infer that the rate of global ocean warming is consistent with the climate simulations for this period. However, the observed hemispheric asymmetry in heat gain can be explained by the Earth's internal climate variability without invoking alternate hypotheses, such as asymmetric aerosol loading.


Conflict of interest statement

The authors declare no competing interests.

Figures

Fig. 1
Fig. 1. Temporal variations of 0–2000 m ocean heat content anomaly.
Hovmöller plot of observed ocean heat content anomaly (1018 J m−1) in 0–2000 m ocean depth referenced from 2005–2015 for (a) northern hemisphere and (b) southern hemisphere.
Fig. 2
Fig. 2. Linear temporal trend in ocean heat content anomaly.
a Observed Linear trend for 2005–2015 of zonally integrated global ocean heat content anomaly (1011 J m−2 year−1). b Same as (a) but for MMM trend for 2006–2015, c observed linear trend of global ocean heat content anomaly for 0–2000 m (107 J m−2 year−1) for 2005–2015, d Same as (c) but for MMM trend for 2006–2015. Stippling indicates the locations where OHC anomaly trends are not significant, i.e., <2*standard error of the trends estimated from (n = 6) observation products and (n =  11) CMIP5 models used in this study.
Fig. 3
Fig. 3. Probabilistic analysis of the ocean heat content anomaly trend.
Distribution of the linear trend of the OHC anomaly (1022 J decade−1) for the depth of 0–2000 m for Northern (NH) and Southern Hemisphere (SH) from (a) multi model ensemble (MME) of pre-industrial control (Pi-Ctrl) simulation (cloud), with the multi model mean (MMM) trend from the historical (Hist-CMIP5, brown diamond, 1980–2005), RCP 4.5 (purple square 2006–2015; purple star 2020–2100) and RCP 8.5 (green square 2006–2015; green star 2020–2100) simulation, and the least square fit line passing through these points to represent the direction of climate change (b) the green cloud is the same as shown in (a) and the orange cloud is the represent the climate change signal in the direction of the best fit line as shown in (a), Observed trend over the period of 2005–2015 (Obs, pink circle) along with the trajectory (scatter dots) of the 10-year running trends from the long-term observations over the period of 1980–2016 (Hist-Obs). c Probability distribution curve for the northern hemisphere’s internal variability (green cloud in (b)) and climate change (orange cloud in (b)) with the OHC trend from observations (pink circle with the error bar of 95% confidence intervals from two-sided student’s t-test, 2005–2015), MMM of historical (brown diamond, 1980–2005), RCP 4.5 (purple square, 2006–2015) and RCP 8.5 (green square, 2006–2015) simulations. d, e Same as (c) but for the Southern Hemisphere and the Global Ocean respectively. The 95% confidence interval for the probability distribution curves is derived from the 2-sigma limits for the gaussian distribution of OHC trend.

References

    1. Roemmich D, et al. Unabated planetary warming and its ocean structure since 2006. Nat. Clim. Chang. 2015;5:240–245. doi: 10.1038/nclimate2513. - DOI
    1. Wijffels S, Roemmich D, Monselesan D, Church J, Gilson J. Ocean temperatures chronicle the ongoing warming of Earth. Nat. Clim. Chang. 2016;6:116–118. doi: 10.1038/nclimate2924. - DOI
    1. Cheng L, et al. Improved estimates of ocean heat content from 1960 to 2015. Sci. Adv. 2017;3:1–11. - PMC - PubMed
    1. Bindoff, N. L. et al. Detection and attribution of climate change: from global to regional. in Climate Change 2013 the Physical Science Basis: Working Group I Contribution to the Fifth Assessment Report of the Intergovernmental Panel on Climate Change vol. 9781107057 867–952 (Cambridge University Press, Cambridge, United Kingdom and New York, NY, 2013).
    1. Bindoff, N. L. et al. Observations: Oceanic Climate Change and Sea Level. in Climate Change 2007: The Physical Science Basis. Contribution of Working Group I to the Fourth Assessment Report of the Intergovernmental Panel on Climate Change vol. 35 385–432 (Cambridge University Press, Cambridge, United Kingdom and New York, NY, 2007).

Publication types