. 2020 Apr 24;10(1):6956.
doi: 10.1038/s41598-020-63255-6.

Neuroligin-1 is altered in the hippocampus of Alzheimer's disease patients and mouse models, and modulates the toxicity of amyloid-beta oligomers

Affiliations

Neuroligin-1 is altered in the hippocampus of Alzheimer's disease patients and mouse models, and modulates the toxicity of amyloid-beta oligomers

Julien Dufort-Gervais et al. Sci Rep. .

Abstract

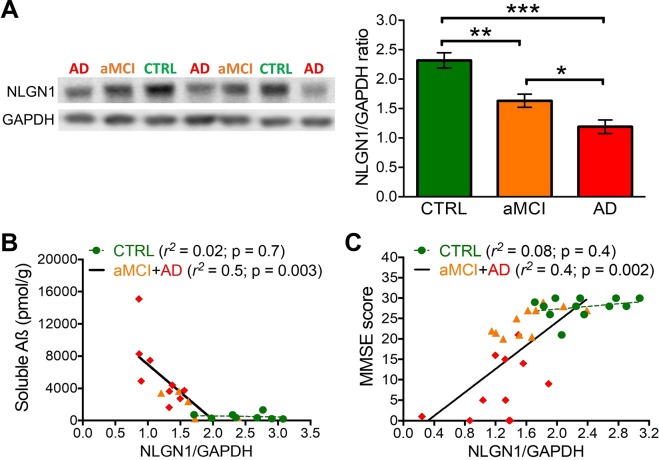
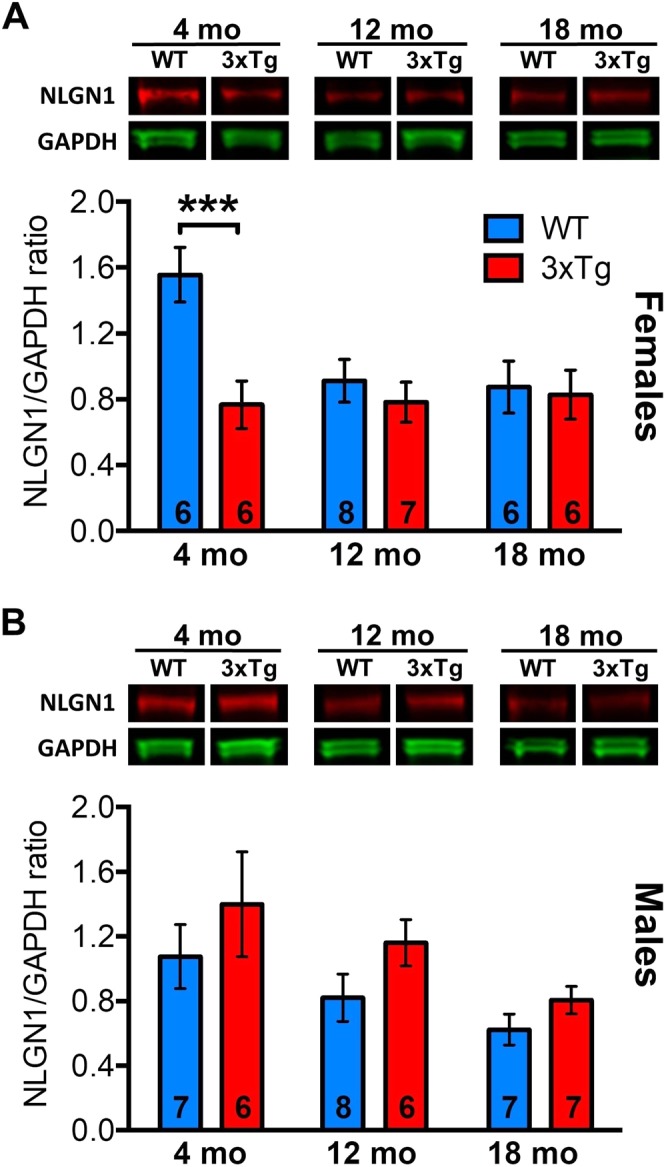
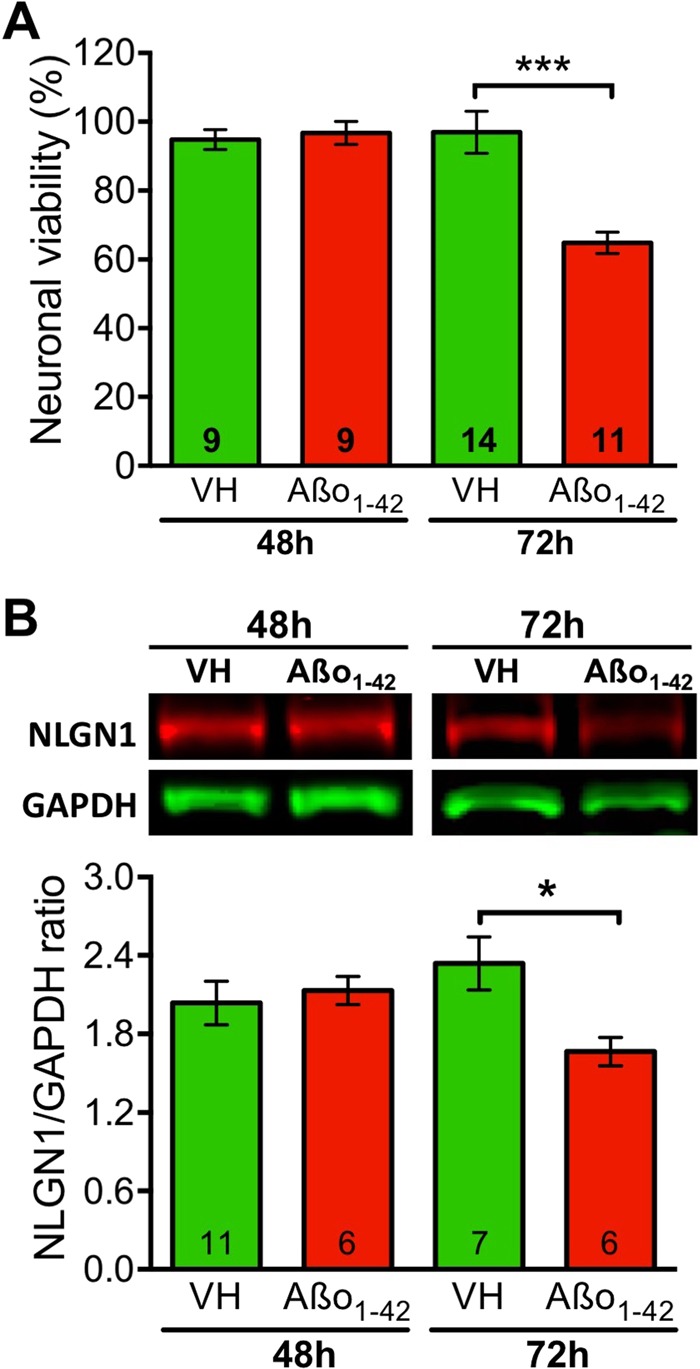
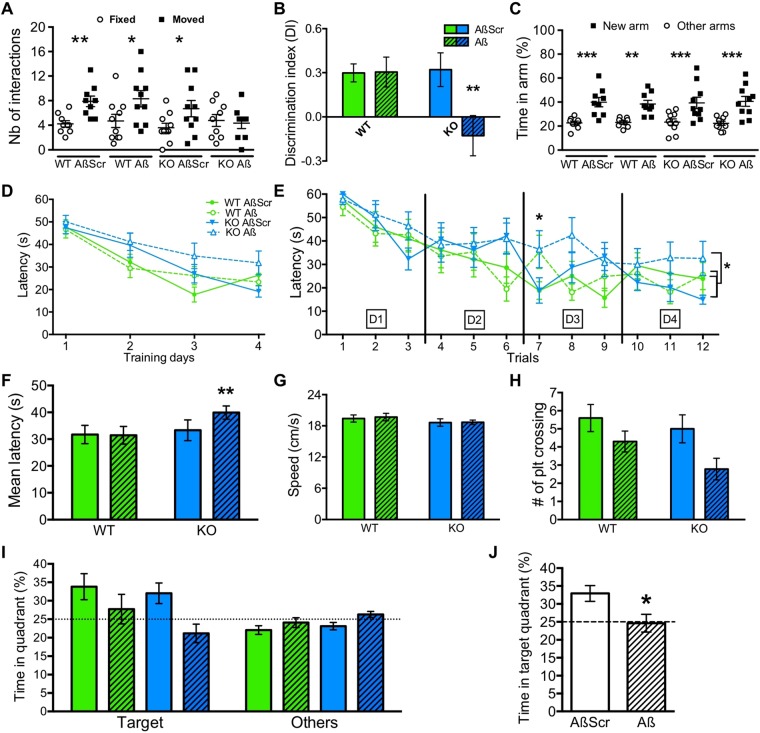
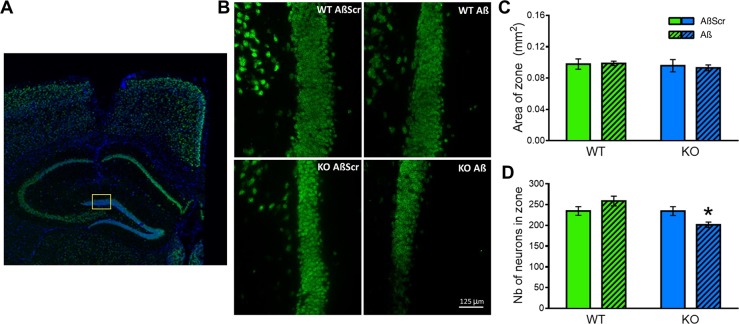
Synapse loss occurs early and correlates with cognitive decline in Alzheimer's disease (AD). Synaptotoxicity is driven, at least in part, by amyloid-beta oligomers (Aβo), but the exact synaptic components targeted by Aβo remain to be identified. We here tested the hypotheses that the post-synaptic protein Neuroligin-1 (NLGN1) is affected early in the process of neurodegeneration in the hippocampus, and specifically by Aβo, and that it can modulate Aβo toxicity. We found that hippocampal NLGN1 was decreased in patients with AD in comparison to patients with mild cognitive impairment and control subjects. Female 3xTg-AD mice also showed a decreased NLGN1 level in the hippocampus at an early age (i.e., 4 months). We observed that chronic hippocampal Aβo injections initially increased the expression of one specific Nlgn1 transcript, which was followed by a clear decrease. Lastly, the absence of NLGN1 decreased neuronal counts in the dentate gyrus, which was not the case in wild-type animals, and worsens impairment in spatial learning following chronic hippocampal Aβo injections. Our findings support that NLGN1 is impacted early during neurodegenerative processes, and that Aβo contributes to this effect. Moreover, our results suggest that the presence of NLGN1 favors the cognitive prognosis during Aβo-driven neurodegeneration.


Conflict of interest statement

The authors declare no competing interests.

Figures

Figure 1
Figure 1
NLGN1 hippocampal level is decreased in aMCI individuals and AD patients. (A) NLGN1 level was measured in aMCI individuals (n = 11), AD patients (n = 13), and control aged non-demented subjects (CTRL, n = 12) by Western blot (left side) and quantified (right side) using GAPDH protein as a loading control. Significant differences are represented between indicated groups (one-way ANOVA F2,33 = 23.3; p < 0.0001; stars indicating planned comparisons). Full length blots are shown in Supplementary Fig. 2. (B) Pearson correlation between soluble Aβ and NLGN1 level showed a significant negative correlation in aMCI individuals (n = 5) and AD patients (n = 9) but not in CTRL (n = 8). (C) Pearson correlation between MMSE score and NLGN1 level showed a significant positive correlation in aMCI individuals (n = 11) and AD patients (n = 11) but not in CTRL (n = 12).
Figure 2
Figure 2
Age-dependent changes in NLGN1 protein in 3xTg-AD mice. (A) Hippocampal NLGN1 protein level measured by Western blot (top) in female 3xTg-AD and control mice at 4, 12 and 18 months, and analyzed using GAPDH protein as a control (bottom). A significant Genotype-by-Age interaction was found (two-way ANOVA F2,33 = 3.8, p = 0.03) showing that NLGN1 protein level differed between 3xTg-AD and control mice only at 4 months (stars indicating planned comparison). Full length blots are shown in Supplementary Fig. 3 (also in B). (B) Hippocampal NLGN1 protein level measured by Western blot in male 3xTg-AD and control mice at 4, 12 and 18 months (top), and analyzed using GAPDH as a control (bottom). No significant effect of Genotype was found (two-way ANOVA Genotype main effect: F1,35 = 3.9, p = 0.06; Genotype-by-Age interaction: F2,35 = 0.12, p = 0.9), but a significant effect of age was observed (Age main effect: F2,35 = 4.4 p = 0.02). The number of mice is indicated on each bar.
Figure 3
Figure 3
Aβo1-42 exposure impacts cell viability and NLGN1 in primary neuronal culture. (A) Neuronal viability of hippocampal neurons exposed to 2 µM of Aβo1-42 or vehicle (VH) for 48 and 72 hours. A significant Treatment-by-Time interaction was found (two-way ANOVA F1,39 = 12.6, p = 0.001), with difference between Aβo1-42 and VH restricted to 72 hours of treatment (stars indicating planned comparison, also in B). (B) NLGN1 protein level in primary culture of hippocampal neurons was assessed by Western blot (top) and expressed relative to the control protein GAPDH (bottom) after exposure to 2 µM of Aβo1-42 or VH for 48 and 72 hours. A significant Treatment-by-Time interaction was also found (two-way ANOVA F1,22 = 5.43, p = 0.03), with difference between Aβo1-42 and VH also restricted to 72 hours of treatment. Full length blots are shown in Supplementary Fig. 4. The number of replicate is indicated on each bar.
Figure 4
Figure 4
Chronic hippocampal injections of Aβo1-42 change Nlgn1 mRNA expression. Nlgn1 mRNA and protein expression was measured after 2, 4 or 6 days of hippocampal injections of Aβo1-42 or vehicle (VH). (A) Nlgn1A expression showed no change with treatment throughout the 6 days (two-way ANOVA Treatment main effect: F1,30 = 0.0009, p = 0.98; Treatment-by-Day interaction: F2,30 = 1.6, p = 0.2). (B) Nlgn1NA expression showed a significant Treatment-by-Day interaction (two-way ANOVA F2,29 = 4.77, p = 0.02) with significant difference between Aβo1-42 and VH after 2 and 4 days (stars indicating planned comparison, also in D and E). (C) Nlgn1B expression showed no change with treatment throughout the 6 days (two-way ANOVA Treatment main effect: F1,30 = 0.2, p = 0.6; Treatment-by-Day interaction: F2,30 = 0.2, p = 0.8). (D) Nlgn1NB expression showed a significant Treatment-by-Day interaction (two-way ANOVA F2,28 = 3.4, p < 0.05) with significant difference between Aβo1-42 and VH after 4 days. (E) Nlgn1C expression showed a significant Treatment-by-Day interaction (two-way ANOVA F2,28 = 8.0, p = 0.002) with significant difference between Aβo1-42 and VH after 2 and 4 days. (F) Hippocampal NLGN1 protein level and loading control GAPDH measured by Western blot after chronic injections (top) and the quantification (bottom). No change was found with treatment throughout the 6 days (two-way ANOVA Treatment main effect: F1,28 = 0.001, p = 0.9; Treatment-by-Day interaction: F2,28 = 0.22, p = 0.8). Full length blots are shown in Supplementary Fig. 6. The number of mice is 5–6 per group.
Figure 5
Figure 5
NLGN1 absence impairs spatial memory after Aβo1-42 exposure. (A) Number of interactions with the fixed and moved objects in the SOR task for WT and Nlgn1 KO mice treated with Aβo1-42 or AβScr. Stars indicate significant differences between moved and fixed objects (t ≥ 2.6). (B) A Genotype-by-Treatment interaction was found for the discrimination index (DI) in the SOR task (two-way ANOVA F1,34 = 4.5, p = 0.04; stars indicate planned comparisons, also in E, F and J). (C) Percent time in the new and other arms in the Y-maze task for the four groups. Stars indicate significant differences between new and other arms (t ≥ 2.9). (D) Latency to the platform during the MWM training days showed significant effects of Genotype (three-way ANOVA F1,159 = 5.4, p = 0.02) and Day (F3,151 = 25,2, p < 0.0001) but no significant Genotype-by-Treatment-by-Day interaction (F3,159 = 0.4, p = 0.7). (E) Latency to the platform during the MWM training trials showed significant Treatment-by-Trial (three-way ANOVA F3,151 = 2.9, p = 0.03) and Genotype-by-Treatment (F1,155 = 3.9, p < 0.05) interactions. (F) Graph of panel E Genotype-by-Treatment interaction showing the mean latency of all 12 trials. (G) Swimming speed during the MWM probe phase (two-way ANOVA Treatment F1,35 = 0.06, p = 0.8; Genotype F1,35 = 1.8 p = 0.2; interaction F1,35 = 0.03, p = 0.9). (H) Number of platform crossing during the MWM probe phase showed a significant Treatment effect (two-way ANOVA F1,39 = 6.2 p = 0.02). (I) Percent time in the target and other quadrants during the MWM probe test showed a significant Treatment-by-Quadrant interaction (three-way ANOVA F1,77 = 8.6, p = 0.0045). (J) Percent time in the target quadrant showed for Aβo1-42 and AβScr injected animals. The number of mice is 9-10 per group.
Figure 6
Figure 6
NLGN1 absence induces neuronal loss after Aβo1-42 exposure. (A) Representative IF images of NeuN staining (green) in the full hippocampus. The approximate location of the counting area is indicated by the yellow rectangle. Magnification 2.5X. (B) Representative IF images of NeuN staining (green) in the DG, where neuron counting was conducted. One image per group is showing approximately the same position within the DG. Magnification 40X. (C) Quantification of the area covered by the counting zone, which did not significantly differ between groups (two-way ANOVA Genotype main effect: F1,20 = 0.6, p = 0.4; Treatment main effect: F1,20 = 0.1 p = 0.8; Genotype-by-Treatment interaction: F1,20 = 0.2, p = 0.7). (D) Number of NeuN-marked cells counted in the DG target area showed a significant Genotype-by-Treatment interaction (two-way ANOVA F1,20 = 8.1, p = 0.01), with the KO Aβ group showing a significant difference in the number of immunoreactive cells in comparison to all other groups (star indicates planned comparisons). The number of mice is 6 per group.

Similar articles

Cited by

References

    1. Pozueta J, Lefort R, Shelanski ML. Synaptic changes in Alzheimer’s disease and its models. Neuroscience. 2013;251:51–65. doi: 10.1016/j.neuroscience.2012.05.050. - DOI - PubMed
    1. Terry RD, et al. Physical basis of cognitive alterations in Alzheimer’s disease: synapse loss is the major correlate of cognitive impairment. Ann. Neurol. 1991;30:572–580. doi: 10.1002/ana.410300410. - DOI - PubMed
    1. Sindi IA, Tannenberg RK, Dodd PR. Role for the neurexin-neuroligin complex in Alzheimer’s disease. Neurobiol. Aging. 2014;35:746–756. doi: 10.1016/j.neurobiolaging.2013.09.032. - DOI - PubMed
    1. Pini L, et al. Brain atrophy in Alzheimer’s Disease and aging. Ageing Res. Rev. 2016;30:25–48. doi: 10.1016/j.arr.2016.01.002. - DOI - PubMed
    1. Fjell AM, McEvoy L, Holland D, Dale AM, Walhovd KB. Alzheimer’s Disease Neuroimaging Initiative. What is normal in normal aging? Effects of aging, amyloid and Alzheimer’s disease on the cerebral cortex and the hippocampus. Prog. Neurobiol. 2014;117:20–40. doi: 10.1016/j.pneurobio.2014.02.004. - DOI - PMC - PubMed

Publication types

MeSH terms