. 2020 Apr 24;11(1):1975.
doi: 10.1038/s41467-020-15885-7.

Modeling biological and genetic diversity in upper tract urothelial carcinoma with patient derived xenografts

Affiliations

Modeling biological and genetic diversity in upper tract urothelial carcinoma with patient derived xenografts

Kwanghee Kim et al. Nat Commun. .

Abstract

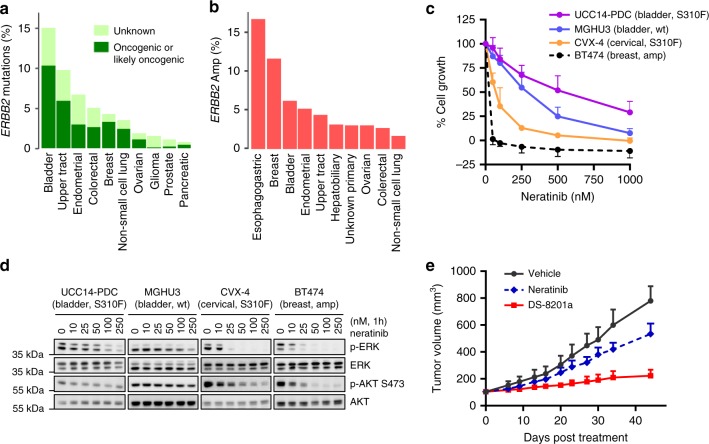
Treatment paradigms for patients with upper tract urothelial carcinoma (UTUC) are typically extrapolated from studies of bladder cancer despite their distinct clinical and molecular characteristics. The advancement of UTUC research is hampered by the lack of disease-specific models. Here, we report the establishment of patient derived xenograft (PDX) and cell line models that reflect the genomic and biological heterogeneity of the human disease. Models demonstrate high genomic concordance with the corresponding patient tumors, with invasive tumors more likely to successfully engraft. Treatment of PDX models with chemotherapy recapitulates responses observed in patients. Analysis of a HER2 S310F-mutant PDX suggests that an antibody drug conjugate targeting HER2 would have superior efficacy versus selective HER2 kinase inhibitors. In sum, the biological and phenotypic concordance between patient and PDXs suggest that these models could facilitate studies of intrinsic and acquired resistance and the development of personalized medicine strategies for UTUC patients.


Conflict of interest statement

M.S. is in the Advisory Board of Bioscience Institute and Menarini Ricerche, received research funds from Puma Biotechnology, Daiichi-Sankio, Targimmune, Immunomedics and Menarini Ricerche, is a co-founder of Medendi Medical Travel and in the past two years he received honoraria from Menarini Ricerche and ADC Pharma. E.J.P. is on the scientific advisory board for Merck. J.J.H. is a consultant of Eisai (RCC Strategic Council) (2018-2019) and received research funds from BostonGene (2019). D.B.S. has served as a consultant and received honoraria from Pfizer, Loxo Oncology, Lilly Oncology, Vivideon Therapeutics, Q.E.D. Therapeutics and Illumina. A.D.S. is in the Advisory Board of Merck and Tesaro, received research funds from R-Pharma, Gilead, Genentech, Boheringer, Puma Biotechnology and Immunomedics. The remaining authors declare no conflicts of interest.

Figures

Fig. 1
Fig. 1. Integrated genomic and transcriptomic analysis of UTUC cancers.
a Somatic genomic landscape of 80 UTUC tumors analyzed by MSK-IMPACT sequencing stratified by RNA sequencing analysis into luminal-like and basal-like subtypes defined using the BASE47 classifier (K = 2), and 5 subtypes based on a consensus molecular classification of muscle-invasive bladder cancer. Tumor mutation burden per megabase (Mb) is indicated in log2 scale for each sample. b Clustering analysis of RNA-seq data from 80 UTUC tumor samples based on the BASE47 classifier (basal marks shown as a turquoise vertical bar; luminal marks shown as a salmon vertical bar). Analysis of genes expressed in cancer cells of a basal-like phenotype (KRT14, CDH3, CD44, KRT5, EGFR, KRT6A/B) is also shown (color key on the top of b). c The number of tumors with oncogenic/likely oncogenic and variants of unknown significance in 17 genes frequently mutated in UTUC. Source data for a and b are provided as a Source Data file.
Fig. 2
Fig. 2. Histological and genomic comparison of patient tumors and paired patient-derived models.
a UTUC tumors and corresponding PDX models demonstrated similar histological features as assessed by H&E staining. Scale bar corresponds to 200 µm. H&E slides of a section of each patient tumor (UCC03, n = 3; UCC14, n = 1; UCC17, n = 1; UCC15, n = 1), matching PDX (UCC03, n = 3; UCC14, n = 2; UCC17, n = 2; UCC15, n = 1) and matching cell line/cell line-derived xenograft (UCC03, n = 1; UCC14, n = 1; UCC17, n = 1) were reviewed by a board-certified pathologist (H.A-A.) and representative pictures are shown. b Concordance of selected cancer-associated genes for the 17 tumors and paired PDX models that successfully engrafted in mice [a: primary tumor, b: lymph node metastasis, c: distal metastasis, d: PDX at early passage (P1-P3), e: PDX at late passage (P4-P6), f: cell line/cell line-derived xenograft]. The UCC03 and UCC11 PDX models were established from abdominal wall and liver resections, respectively, whereas UCC32 was from a lymph node. The UCC11 PDX was generated from the frozen cell pellet of a patient specimen. All others were established from primary tumors. c Concordance of somatic oncogenic mutations of the patient tumor and corresponding PDX models and tumor mutational burden (TMB) of the patient tumors. Four PDX models were derived from MSI-H tumors (right panel, green and blue). d Phylogenetic analysis of whole-exome sequencing data for two patients (UCC30 and UCC03) revealed evidence of linear and branched tumor evolution [P: primary, M: metastasis, PDX: X1 (early passage) and X2 (late passage) which represent replicates of different passage numbers, CL: PDC]. The number of mutations is shown between branch points. e AID/APOBEC mutational signatures (Signatures 2 and 13) were predominant in UCC30 and UCC03 patient tumors while AID/APOBEC(2) was lost in UCC30 PDX. The mutation signatures with FDR < 0.05 are shown. Data are presented as mean values ± SD. Source data for be are provided as a Source Data file.
Fig. 3
Fig. 3. Comparison of mutation frequencies and RNA expression profiles.
Patient specimens that resulted in successful engraftment (PDX) vs those that did not (No PDX) were compared. a The rates of successful engraftment differed among tumors with putative driver mutations. The number of patient cases with mutation in the gene is shown in parenthesis. b Comparison of RNA-seq data from patient specimens that successfully engrafted (PDX, n = 8, salmon) vs those that did not (No PDX, n = 9, turquoise). 749 genes (428 upregulated and 321 downregulated) were differentially expressed between UTUC tumors that did and did not engraft based on the z-score of normalized gene reads from RNA-seq. c Single Sample Gene Set Enrichment Analysis (ssGSEA) scores of basal (P = 0.19) and luminal gene sets (P = 0.41) based on the BASE47 classifier and ssGSEA scores of tumor basal genes (expressed in cancer cells of a basal-like phenotype, indicated at the bottom of Fig. 1b, P = 0.04) plotted for the patient tumors resulting in PDX (n = 8) vs No PDX (n = 9). Error bars are mean standard error from bootstrap. The center line in the boxplots indicates the mean, the lower and upper hinges correspond to the first and third quartiles, the upper whisker is the maxima and the lower whisker the minima. P-value indicates two-sided two group t-test without adjustment. d GSEA plots comparing specimen that did and did not yield PDX. Enrichment of cell cycle/DNA replication pathways was observed in the PDX group, whereas extracellular matrix receptor interaction and focal-adhesion pathways were enriched in the No PDX group. Source data for bd are provided as a Source Data file.
Fig. 4
Fig. 4. Chemosensitivity of patients and corresponding PDX.
Imaging of target lesions in patients before chemotherapy (pre-treatment) and at the time specified post treatment. Tumor volumes for the corresponding PDX models were graphed as a function of days post-start of drug treatment. a UCC03: FDG PET/CT scan after two cycles of gemcitabine/carboplatin (Gem/Carbo) chemotherapy demonstrated decreased radiopharmaceutical accumulation in left iliac metastasis (partial response according to RECIST). Mice bearing the UCC03 PDX were randomized and treated with Gem/Carbo, gemcitabine, carboplatin or vehicle (P = 0.0177, vehicle vs Gem/Carbo combination; P = 0.0065, vehicle vs gemcitabine; P = 0.138, vehicle vs carboplatin). b UCC19 received a combination of Gem/Carbo at recurrence followed by gemcitabine alone and demonstrates stable disease by RECIST criteria off treatment for 15 months. The corresponding PDX model was highly sensitive to Gem/Carbo (P < 0.0001). c UCC17 (MSI-H) received 4 cycles of neoadjuvant gemcitabine/cisplatin. The patient’s radiographic response was minimal (stable disease by RECIST criteria) and there was no pathological response (pT3 disease at RNU). Minimal tumor growth inhibition was observed with Gemcitabine/Cisplatin in the corresponding PDX (P = 0.07). Two-way ANOVA test (Prism) was used for statistical analysis without adjustment. Data are presented as mean values ± SD (standard deviation). Source data for preclinical studies are provided as a Source Data file.
Fig. 5
Fig. 5. Assessment of HER2-targeted strategies.
a, b Fraction of patients with ERBB2 mutation or amplification, respectively, in bladder, UTUC and other common solid tumors in a prospectively sequenced cohort of 44,183 tumors. c Neratinib sensitivity of the UCC14-PDC (HER2 S310F-mutant UTUC), MGHU3 [ERBB2 wildtype (wt) bladder cancer], CVX-4 (HER2 S310F-mutant cervical cancer) and BT-474 (ERBB2 amplified breast cancer) was determined 5 days post-neratinib treatment. The average values from three separate experiments (n = 3) for UCC14-PDC, MGHU3, and CVX-4 and 5 separate experiments (n = 5) for BT-474 are shown. IC50s for neratinib were 508.3, 245.9, 56.8 and 0.1 nM for UCC14, MGHU3, CVX-4 and BT-474, respectively. d Inhibition of ERK and AKT, downstream HER2 effectors by neratinib. Western blot was performed (repeated three times) on samples treated with neratinib or vehicle for 1 h at the indicated concentrations. The samples were derived from the same experiment and the gels/blots were processed in parallel. e Mice with established UCC14 tumors were treated with neratinib 20 mg/kg PO daily (5 days a week), DS-8201a 10 mg/kg i.v. once every 3 weeks or vehicle only as control. Mice bearing the PDX were randomly assigned to 3 cohorts (n = 8 per each group) and monitored twice a week [P = 0.0034, vehicle vs neratinib; P < 0.0001, vehicle vs DS-8201a; P < 0.0001, neratinib vs DS-8201a]. Two-way ANOVA test (Prism) was used for statistical analysis. Data are presented as mean values ± SD. Source data for ce are provided as a Source Data file.

Comment in

References

    1. Carlo MI, et al. Cancer susceptibility mutations in patients with urothelial malignancies. J. Clin. Oncol. 2020;38:404–414. doi: 10.1200/JCO.19.01395. - DOI - PMC - PubMed
    1. Sfakianos JP, et al. Genomic characterization of upper tract urothelial carcinoma. Eur. Urol. 2015;68:970–977. doi: 10.1016/j.eururo.2015.07.039. - DOI - PMC - PubMed
    1. Moss TJ, et al. Comprehensive genomic characterization of upper tract urothelial carcinoma. Eur. Urol. 2017;72:641–649. doi: 10.1016/j.eururo.2017.05.048. - DOI - PubMed
    1. Audenet F, et al. Clonal relatedness and mutational differences between upper tract and bladder urothelial carcinoma. Clin. Cancer Res. 2019;25:967–976. doi: 10.1158/1078-0432.CCR-18-2039. - DOI - PMC - PubMed
    1. Robinson BD, et al. Upper tract urothelial carcinoma has a luminal-papillary T-cell depleted contexture and activated FGFR3 signaling. Nat. Commun. 2019;10:2977. doi: 10.1038/s41467-019-10873-y. - DOI - PMC - PubMed

Publication types

MeSH terms