. 2020 Apr 24;10(1):6918.
doi: 10.1038/s41598-020-62837-8.

A 96-well culture platform enables longitudinal analyses of engineered human skeletal muscle microtissue strength

Affiliations

A 96-well culture platform enables longitudinal analyses of engineered human skeletal muscle microtissue strength

Mohammad E Afshar et al. Sci Rep. .

Abstract

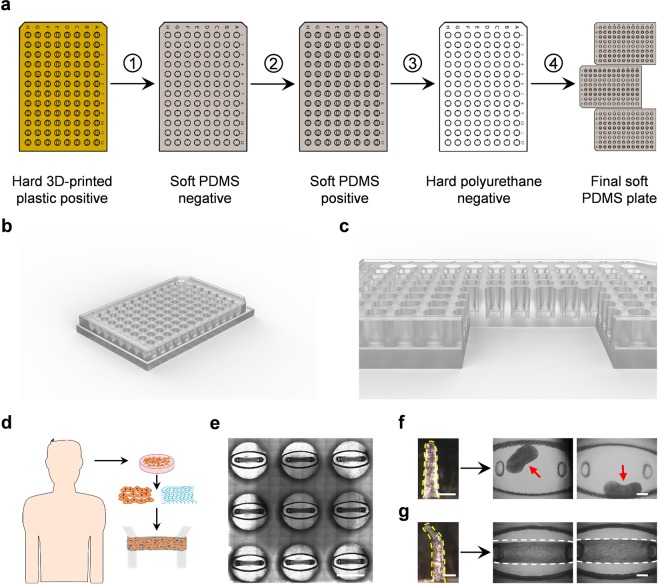
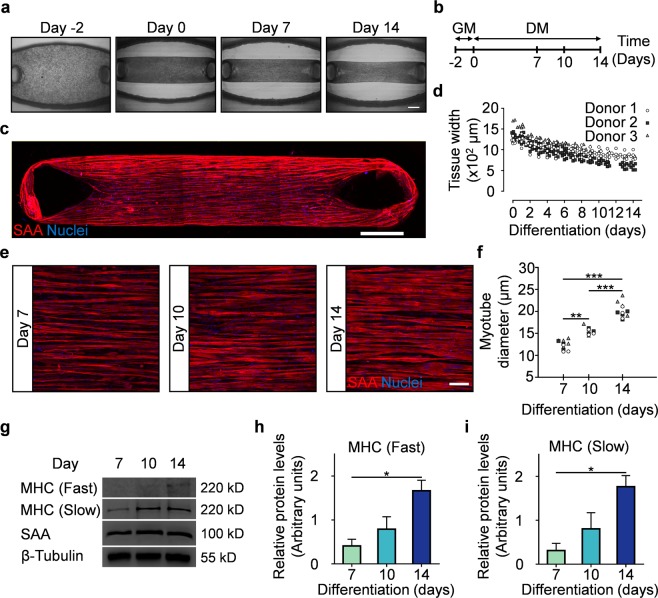
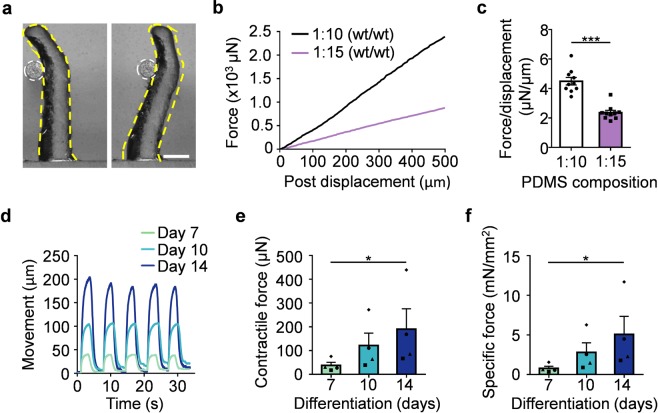
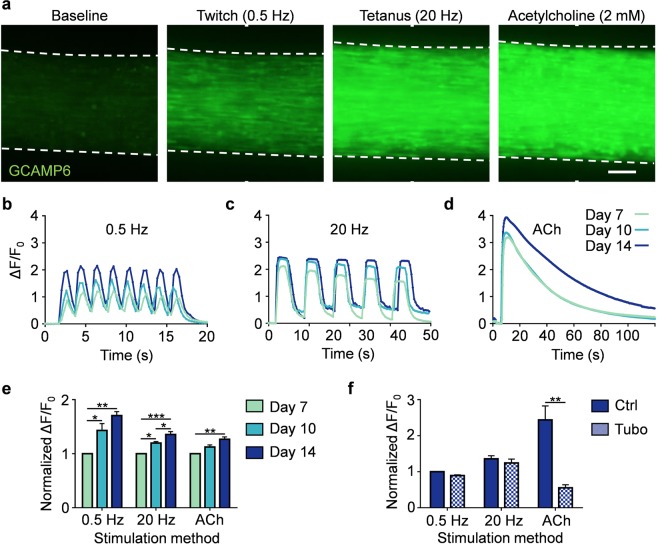
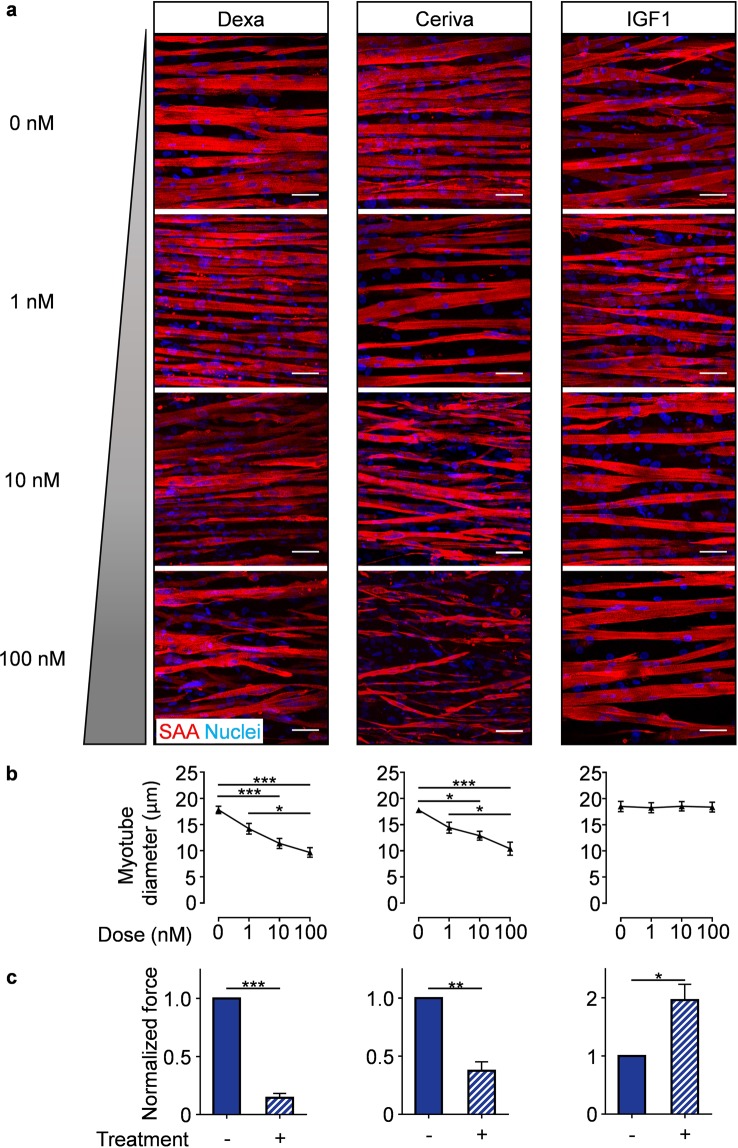
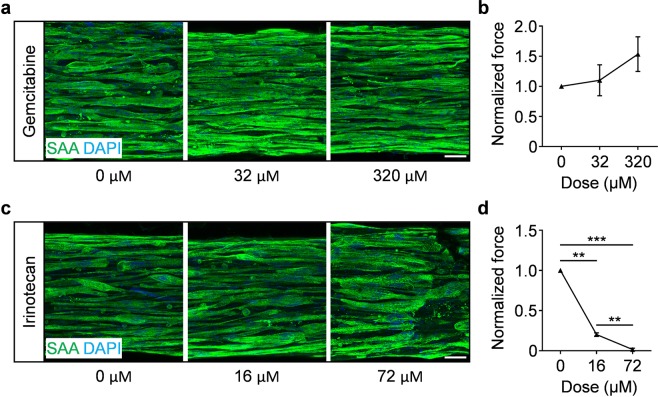
Three-dimensional (3D) in vitro models of human skeletal muscle mimic aspects of native tissue structure and function, thereby providing a promising system for disease modeling, drug discovery or pre-clinical validation, and toxicity testing. Widespread adoption of this research approach is hindered by the lack of easy-to-use platforms that are simple to fabricate and that yield arrays of human skeletal muscle micro-tissues (hMMTs) in culture with reproducible physiological responses that can be assayed non-invasively. Here, we describe a design and methods to generate a reusable mold to fabricate a 96-well platform, referred to as MyoTACTIC, that enables bulk production of 3D hMMTs. All 96-wells and all well features are cast in a single step from the reusable mold. Non-invasive calcium transient and contractile force measurements are performed on hMMTs directly in MyoTACTIC, and unbiased force analysis occurs by a custom automated algorithm, allowing for longitudinal studies of function. Characterizations of MyoTACTIC and resulting hMMTs confirms the capability of the device to support formation of hMMTs that recapitulate biological responses. We show that hMMT contractile force mirrors expected responses to compounds shown by others to decrease (dexamethasone, cerivastatin) or increase (IGF-1) skeletal muscle strength. Since MyoTACTIC supports hMMT long-term culture, we evaluated direct influences of pancreatic cancer chemotherapeutics agents on contraction competent human skeletal muscle myotubes. A single application of a clinically relevant dose of Irinotecan decreased hMMT contractile force generation, while clear effects on myotube atrophy were observed histologically only at a higher dose. This suggests an off-target effect that may contribute to cancer associated muscle wasting, and highlights the value of the MyoTACTIC platform to non-invasively predict modulators of human skeletal muscle function.


Conflict of interest statement

The authors declare no competing interests.

Figures

Figure 1
Figure 1
Design and production of the MyoTACTIC platform. (a) MyoTACTIC production started with creating a three-dimensional Computer Aided Design (3D CAD) using SolidWorks™ Software which was then printed using a ProJet MJP 3500 3D printer from 3D SYSTEMS. Next, a negative PDMS mold was created from the 3D printed part which was subsequently used to fabricate a soft replica of the design after silanizing. Finally, a rigid negative polyurethane mold was created from the PDMS replica which was used to fabricate multiple PDMS plates. (b,c) Computer generated 3D images of (b) MyoTACTIC 96-well plate design and (c) a cross-section of wells indicating the location of the micro-posts. (d) Schematic overview of human cell isolation and subsequent generation of hMMTs in MyoTACTIC. (e) Stitched phase-contrast image of 9 wells of MyoTACTIC containing remodeled hMMTs 10 days post seeding. Scale bar 5 mm. (f,g) Impact of micro-post design on formation and long-term maintenance of hMMTs in MyoTACTIC. Representative images of (f) collapsed and (g) successfully remodeled hMMTs seeded in wells with (f) hook-less and (g) hook featured posts. Micro-posts are outlined in yellow dashed lines. Red arrows indicate collapsed hMMTs on the top right panels and hMMTs are outlined in white dashed lines on the bottom right panels. Scale bars 500 µm.
Figure 2
Figure 2
MyoTACTIC supports formation of hMMTs with aligned myotubes exhibiting hypertrophy and adult myosin heavy chain expression. (a) Representative phase-contrast images of hMMTs depicting the remodeling of the extracellular matrix by human myoblasts over time. Day 0 marks the time for switching to differentiation media. Scale bar 500 µm. (b) Schematic diagram of the timeline for hMMT culture. hMMTs are cultured in growth media (GM) lacking bFGF for the first two days (day -2 to day 0) and then the media is switched to differentiation media (DM) on Day 0. (c) Representative confocal stitched image of a hMMT cultured for 2 weeks, immunostained for sarcomeric α-actinin (SAA, red) and exposed to DRAQ5 (blue) to counter stain the nuclei. Scale bar 500 µm. (d) Dot plot indicating the width of hMMTs over the course of culture time. (n = minimum of 16 hMMTs from 3 muscle patient donors per time point). (e) Representative confocal images of myotubes formed in hMMTs and immunostained for SAA (red) and nuclei (blue) after 7, 10, and 14 days in differentiation media. Scale bar 50 µm. (f) Quantification of hMMT myotube diameter over time. **p < 0.01, ***p < 0.001 (n = minimum of 9 hMMTs from 3 muscle patient donors per time point). (g) Representative western blot images of myosin heavy chain (MHC) isoforms (fast and slow), SAA, and β-tubulin over culture time (Day 7, 10, and 14). The blots were cropped and stained separately (see Methods for more detail). Full length blots are presented in Supplementary Fig. 8. (h–i) Bar graph quantification of relative (h) MHC-fast and (i) MHC-slow protein expression in hMMTs over culture time. *p < 0.05 (n = 3 blots from 3 muscle patient donors, where each blot was run in a set of single experiment using lysate of 4 hMMTs (per time point) from a single patient donor lysed together. Blots were then processed in parallel to generate the bar graphs shown in (h,i)). In (d,f) each symbol represents data from one patient donor. In (h,i) values are reported as mean ± SEM. In (f,h,i) significance was determined by one-way ANOVA followed by multiple comparisons to compare differences between groups using Tukey’s multiple comparisons test.
Figure 3
Figure 3
MyoTACTIC enables non-invasive and in situ measurement of hMMT contractile force. (a) Phase-contrast images of a micro-post (outlined in yellow dashed lines) displaced in response to the force exerted by a microwire (outlined in white dashed circles). Scale bar 500 µm. (b) Plot depicting the relation between force and displacement of micro-posts fabricated using two different PDMS compositions (curing agent weight (wt): monomer weight), as measured by the Microsquisher. (c) Bar graph quantification of the average force/displacement ratio for the micro-posts formed using two different PDMS compositions. ***p < 0.001 (n = 10 micro-posts per condition). (d) Representative line graph traces of the micro-post displacement during high frequency (20 Hz) electrical stimulation of hMMTs at Day 7, 10, and 14 of differentiation measured by the custom-written Python computer vision script. (e,f) Bar graph quantification of the absolute (e) and specific (f) tetanus contractile forces generated by hMMTs at Day 7, 10, and 14 of differentiation. *p < 0.05 (n = minimum of 11 hMMTs from 4 muscle patient donors per time point). In (e,f) each symbol represents averaged hMMT data from one patient donor. In (c,e,f) values are reported as mean ± SEM. Significance was determined by t-test in (c) or Friedman test followed by Dunn’s multiple comparisons test to compare differences between groups in (e,f).
Figure 4
Figure 4
MyoTACTIC enables non-invasive and in situ measurement of hMMT calcium transients. (a) Representative epifluorescence images of the peak GCaMP6 signal from hMMTs in response to low frequency (0.5 Hz, twitch contraction), high frequency (20 Hz, tetanus contraction) and acetylcholine (ACh, 2 mM) stimulations at Day 14 of differentiation. Scale bar 200 µm. (b–d) Representative calcium transient traces of hMMTs at Day 7, 10, and 14 of differentiation in response to (b) low and (c) high frequency electrical and (d) acetylcholine stimulations. (e) Bar graph quantification of hMMTs calcium transients in response to electrical (0.5 and 20 Hz) and biochemical (ACh) stimuli at differentiation Day 7, 10 and 14. Values are normalized to the Day 7 results for each stimulation modality. *p < 0.05; **p < 0.01, ***p < 0.001 (n = minimum of 9 hMMTs from 3 muscle patient donors per time point, per stimulation method). (f) Bar graph quantification of calcium transients in hMMTs activated with electrical or biochemical stimuli following pre-treatment with d-tubocurarine (25 µM) at Day 14 of differentiation. Values are normalized to control (Ctrl) hMMTs stimulated with 0.5 Hz electrical stimuli. **p < 0.01 (n = 9 hMMTs from 3 muscle patient donors per treatment condition per stimulation method). In (e,f) values are reported as mean ± SEM. Significance was determined by two-way ANOVA followed by Tukey’s and Sidak’s multiple comparisons to compare differences between groups in (e) or t-test in (f).
Figure 5
Figure 5
MyoTACTIC-cultured hMMTs predict skeletal muscle structural and functional responses to pharmacological treatment. (a) Representative confocal images of Day 14 hMMTs treated for 7 days with either vehicle control or increasing doses (1, 10, and 100 nM) of Dexamethasone (left panels), Cerivastatin (middle panels), or IGF-1 (right panels) and immunostained for sarcomeric α-actinin (SAA, red) and Hoechst 33342 (Nuclei, blue). Scale bar 50 µm. (b) Quantification of the dose-dependent effect of Dexamethasone (left panel), Cerivastatin (middle panel), and IGF-1 (right panel) on hMMT myotube diameter. *p < 0.05, ***p < 0.001 (for each treatment, n = minimum of 4 hMMTs from a minimum of 3 muscle patient donors per treatment dose). (c) Bar graph quantification of the tetanus (20 Hz electrical stimuli) contractile force generated by hMMTs treated from Day 7 to 14 with either vehicle (−) or (+) Dexamethasone (10 nM; left panel), Cerivastatin (10 nM; middle panel), and IGF-1 (100 nM; right panel). Ethanol, ddH2O, and 10 mM HCl were vehicle controls for Dexamethasone, Cerivastatin, and IGF-1 respectively. Values are normalized to vehicle-treated results on differentiation Day 14. *p < 0.05, ***p < 0.001 (for each treatment, n = minimum of 8 hMMTs generated from 3 muscle patient donors per treatment condition). In (b,c) values are reported as mean ± SEM. In (b), significance was determined by one-way ANOVA followed by Tukey’s multiple comparisons to compare differences between groups (Dexamethasone and Cerivastatin) or Kruskal Wallis test followed by Dunn’s multiple comparisons to compare differences between groups (IGF-1). In (c), significance was determined by t-test (Dexamethasone and Cerivastatin) or t-test with Welch’s correction (IGF-1).
Figure 6
Figure 6
MyoTACTIC cultured hMMTs predict direct effect of chemotherapeutic agents on human skeletal muscle contractile function. (a,c) Representative confocal images of Day 14 hMMTs treated with one-time administration of vehicle (DMSO for Irinotecan and PBS for Gemcitabine) or dosed with (a) Gemcitabine or (c) Irinotecan on Day 7 and then immunostained for sarcomeric α-actinin on Day 14. Scale bar 50 μm. (b,d) Quantification of tetanus (20 Hz electrical stimuli) contractile force generation by Day 14 hMMTs treated with vehicle (DMSO for Irinotecan and PBS for Gemcitabine), (b) Gemcitabine (32 μM and 320 μM), or (d) Irinotecan (16 μM and 72 μM). Values in (b,d) are normalized to vehicle treated results on differentiation day 14. **p < 0.01, ***p < 0.001 (n = minimum of 4 hMMTs from 3 biological replicates per treatment condition). In (b,d) values are reported as mean ± SEM. Significance was determined by one-way ANOVA followed by Tukey’s multiple comparisons to compare differences between groups in (b,d).

References

    1. Periasamy M, et al. Role of SERCA Pump in Muscle Thermogenesis and Metabolism. Compr. Physiol. 2017;7:879–890. doi: 10.1002/cphy.c160030. - DOI - PubMed
    1. Lauretani F, et al. Age-associated changes in skeletal muscles and their effect on mobility: an operational diagnosis of sarcopenia. J. Appl. Physiol. Bethesda Md 1985. 2003;95:1851–1860. - PubMed
    1. Maltzahn J, von, Renaud J-M, Parise G, Rudnicki MA. Wnt7a treatment ameliorates muscular dystrophy. Proc. Natl. Acad. Sci. 2012;109:20614–20619. doi: 10.1073/pnas.1215765109. - DOI - PMC - PubMed
    1. Thomason DB, Booth FW. Atrophy of the soleus muscle by hindlimb unweighting. J. Appl. Physiol. Bethesda Md 1985. 1990;68:1–12. - PubMed
    1. Gaschen FP, et al. Dystrophin deficiency causes lethal muscle hypertrophy in cats. J. Neurol. Sci. 1992;110:149–159. doi: 10.1016/0022-510X(92)90022-D. - DOI - PubMed

Publication types

MeSH terms