. 2020 Jul 8;107(1):158-172.e4.
doi: 10.1016/j.neuron.2020.03.029. Epub 2020 Apr 24.

Depression of Accumbal to Lateral Hypothalamic Synapses Gates Overeating

Affiliations

Depression of Accumbal to Lateral Hypothalamic Synapses Gates Overeating

Sarah Thoeni et al. Neuron. .

Abstract

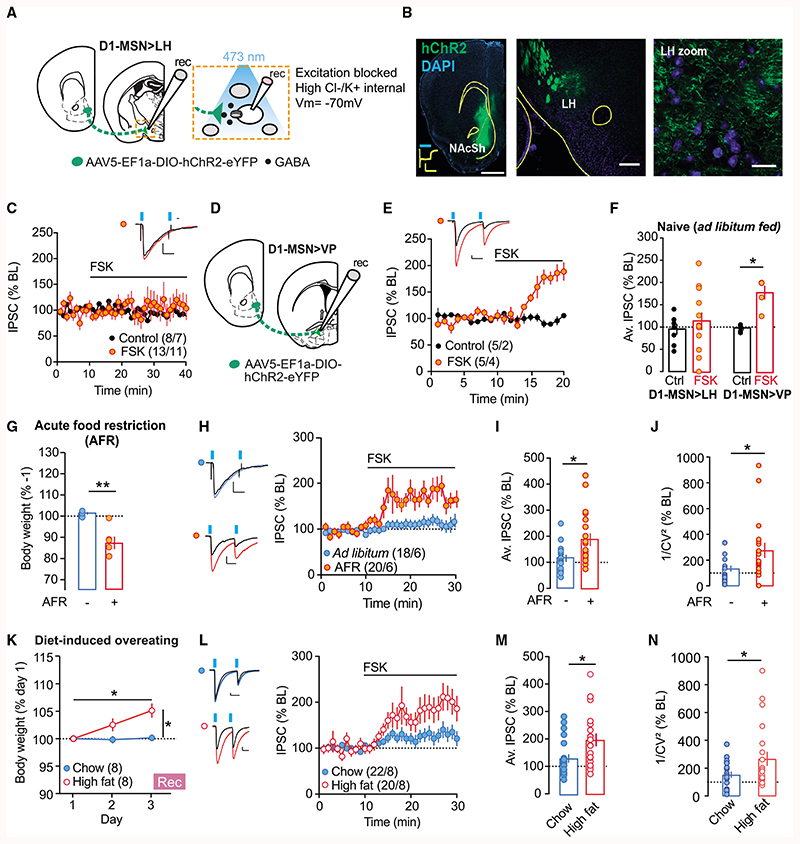
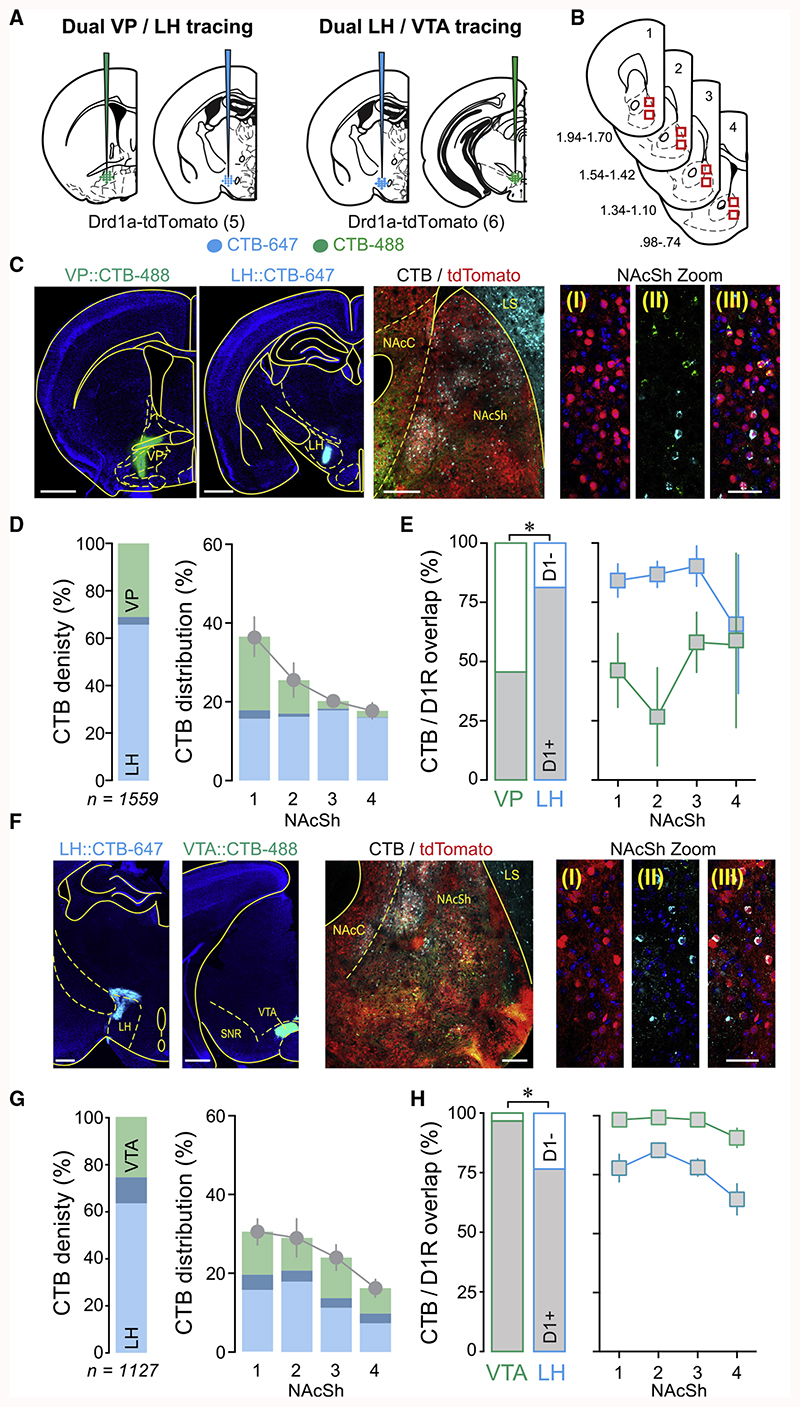
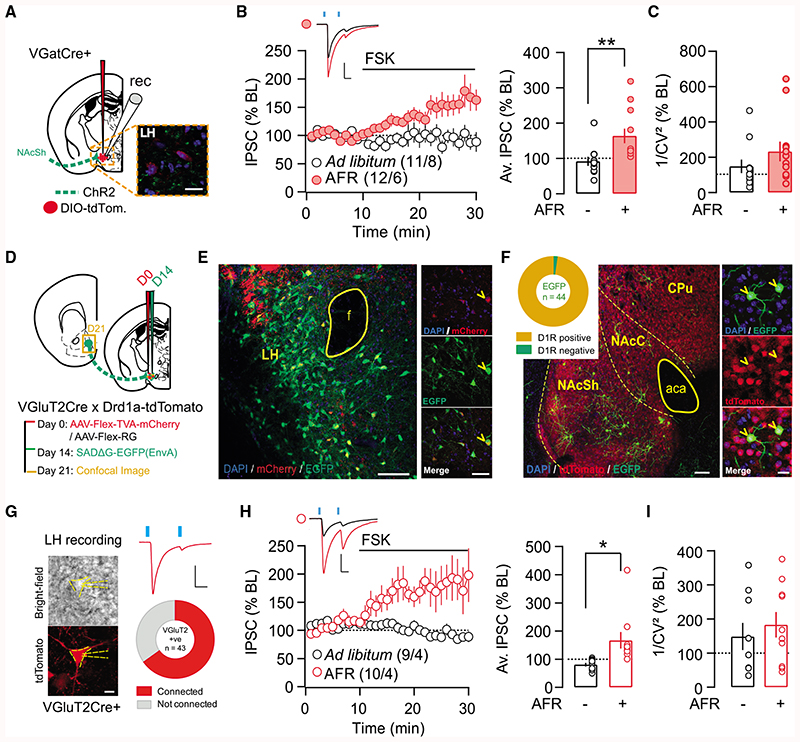
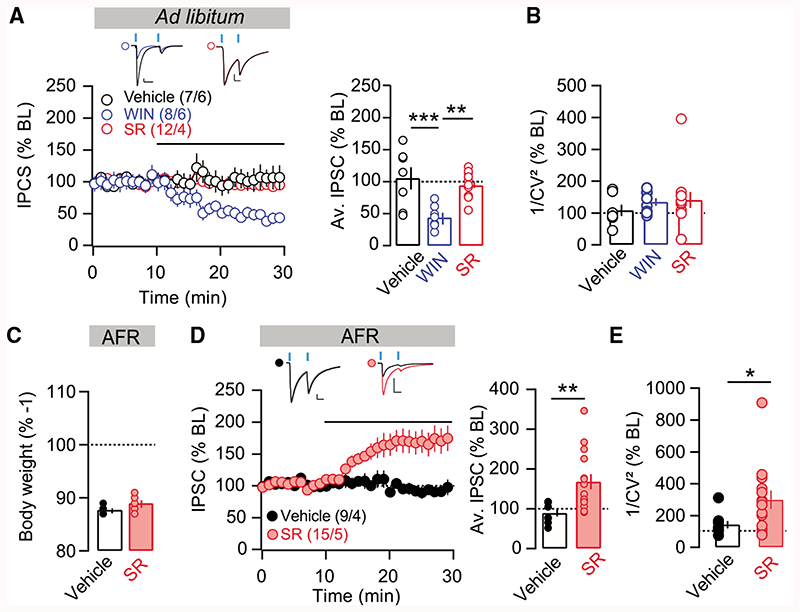
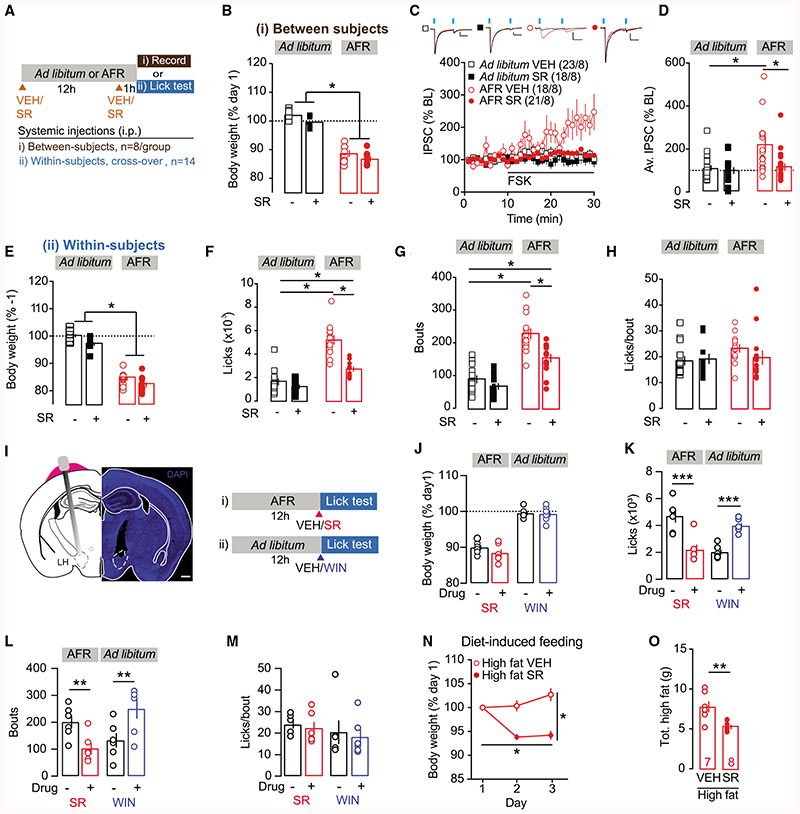
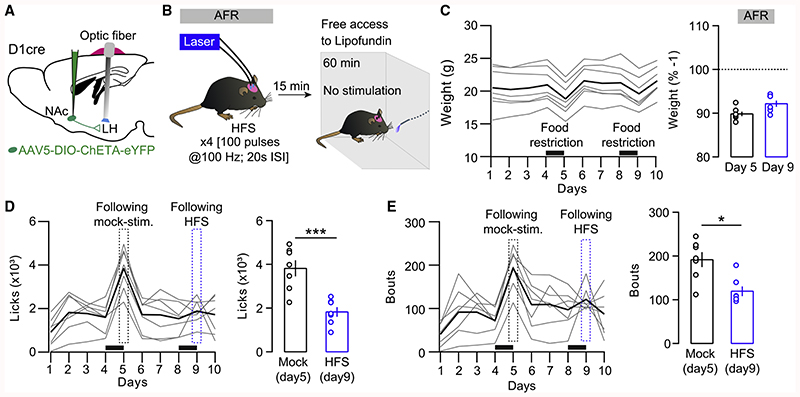
Overeating typically follows periods of energy deficit, but it is also sustained by highly palatable foods, even without metabolic demand. Dopamine D1 receptor-expressing medium spiny neurons (D1-MSNs) of the nucleus accumbens shell (NAcSh) project to the lateral hypothalamus (LH) to authorize feeding when inhibited. Whether plasticity at these synapses can affect food intake is unknown. Here, ex vivo electrophysiology recordings reveal that D1-MSN-to-LH inhibitory transmission is depressed in circumstances in which overeating is promoted. Endocannabinoid signaling is identified as the induction mechanism, since inhibitory plasticity and concomitant overeating were blocked or induced by CB1R antagonism or agonism, respectively. D1-MSN-to-LH projectors were largely non-overlapping with D1-MSNs targeting ventral pallidum or ventral midbrain, providing an anatomical basis for distinct circuit plasticity mechanisms. Our study reveals a critical role for plasticity at D1-MSN-to-LH synapses in adaptive feeding control, which may underlie persistent overeating of unhealthy foods, a major risk factor for developing obesity.

Keywords: VGAT; VGluT2; channelrhodopsin; feeding; hyperphagia; inhibition; lateral hypothalamus; nucleus accumbens; obesity; synaptic plasticity.


Conflict of interest statement

Declaration of Interests C.L. is a member of the scientific advisory boards of the International Foundation for Research in Paraplegia and the Phenix Foundation. E.C.O. is currently a full-time employee of F. Hoffmann-La Roche AG.

Figures

Figure 1
Figure 1. D1-MSN-to-LH Plasticity Is Revealed after Food Restriction or High-Fat Diet
(A) Schematic of the preparation used for whole-cell patch clamp recordings. (B) Left: representative image of NAcSh ChR2 transfection and example trace of 500-ms blue light-evoked photocurrent from ChR2-expressing neuron (scale: 500 pA, 500 ms, 1 mm). Center: representative image of LH with ChR2-EYFP-labeled fiber terminals originating from NAcSh at low(scale bar: 200 μm) and (right) high magnification (scale bar: 20 μm). (C) Normalized IPSCs for bath application of forskolin (FSK; 10 μM). (D) Schematic for NAcSh-to-VP recordings. (E) Same as in (C), but at NAcSh-to-VP synapses. (F) Average norm. IPSC from last 5 min of recordings for cells recorded in LH and VP. At D1-MSN-to-LH synapses, there was no change in IPSCs. ANOVA: treatment F(1,34) = 6.899, p < 0.05, region × treatment F(1,34) = 3.781, p = 0.06. At D1-MSN-to-VP synapses, FSK application significantly increased IPSCs versus controls. *Unpaired t test, t34 = 2.664, p < 0.05. (G) D1Cre mice with floxed-ChR2 in NAcSh were food restricted overnight (AFR) and plasticity at D1-MSN-to-LH synapse was assessed the next day. Body weight (% day 1) was significantly reduced in AFR mice versus ad libitum-feć controls. **Unpaired t test, t10 = –4.97, p < 0.01. (H) Normalized IPSCs for FSK applied in AFR or ad libitum-fed mice. (I) Mean norm. IPSC from last 5 min of recordings following FSK is significantly increased in AFR mice versus controls. *Unpaired t test, t36 = 2.72, p < 0.05. (J) Coefficients of variation of the amplitude of the IPSCs were increased after FSK t35 = 2.309, *p < 0.05. (K) Body weight significantly increased in mice fed high-fat diet over 3 days, compared to mice with access only to chow. ANOVA: diet × time interaction: F(2,18.9) = 10.2, p < 0.01. High-fat diet versus chow, unpaired t test at day 3, t14 = 3.78, p < 0.01; for high-fat diet, day 3 versus day 1, paired t test, t7 = 85.7, p<0.01. (L) Norm. IPSCs before and after application of FSK. (M) Average IPSC (% of baseline [BL]) from the last 5 min of recordings. The average IPSC (% BL) was significantly increased in mice exposed to high-fat diet versus chow. *Unpaired t test, t40 = 2.69, p < 0.05. (N) Coefficients of variation of the amplitude of the IPSCs were increased in the high-fat diet group. t40 = 2.063, *p < 0.05. Plots show means ± SEMs. *p < 0.05, **p < 0.01. Scale bars for (C), (D), (F), and (I): 50 pA, 20 ms.
Figure 2
Figure 2. D1-MSN-to-LH Projectors Are Segregated from D1-MSN-to-VP or -VTA Projections
(A) Schematic of preparation. CTBs were injected in the VP and LH (for C–E) or VTA and LH (for F–H) of Drd1a-tdTomato mice. (B) Schematic of sites imaged for quantification across the rostro-caudal gradient of NAcSh. (C) Left: example images of CTB injection sites in VP and LH. Scale bar: 1,000 μm. Center: example image of NAcSh showing D1-MSNs labeled by tdTomat, and CTB-labeled cells from VP and LH. Scale bar: 200 μm. Right: representative images of NAcSh in high magnification: (I) D1-MSNs labeled by tdTomato; (II) VP and LH projectors labeled with CTB-488 and CTB-647, respectively; (III) merge. Scale bar: 50 μm. VP and LH projectors identified by CTB-488 and CTB-647, respectively, Right: merge. Scale bar: 50 μm. (D) Left: proportion of all CTB-labeled cells identified as LH (34.4% ± 3.9%) or VP (69.2% ± 3.8%) projectors, or cells expressing both fluorophores (3.6% ± 1 Right: distribution of CTB-labeled cells across NAcSh rostro-caudal gradient (positions 1–4 refer to coordinates shown in B). (E) Left: quantification of NAcSh-to-VP or -LH projectors also identified as D1-MSNs. 45.6% ± 6.9% of NAcSh-to-VP projectors were D1-MSNs, while significantly more LH projectors were D1-MSNs (81.3% ± 4.3%; paired t test, *p < 0.05). Right: proportion of CTB cells identified as D1-MSNs distributed across NAcSh rostro-caudal gradient. (F) Same as for (C) but with CTB injections made in VTA or LH. Left: example images of CTB injection sites in LH and VTA. Scale bar: 1,000 μm. Center: ex image of NAcSh showing D1-MSNs labeled by tdTomato, and CTB-labeled cells from LH and VTA. Scale bar: 100 μm. Right: representative images of NAcSh in high magnification: (I) D1-MSNs labeled by tdTomato; (II) LH and VTA projectors labeled with CTB-488 and CTB-647, respectively; (III) merge. Scale bar: 50 μm. (G) Left: proportion of all CTB-labeled cells identified as LH (63.6% ± 3.2%) or VTA (47.5% ± 3.1%) projectors, or cells expressing both fluorophores (11.1% ± 1.2%), Right: distribution of cells across NAcSh rostro-caudal gradient. (H) Left: quantification of NAcSh-to-VTA or -LH projectors also identified as D1-MSNs. 96.6% ± 2.0% of NAcSh-to-VTA projectors were D1-MSNs, while significantly fewer LH projectors were D1-MSNs (76.5% ± 4.3%; *paired t test, p < 0.05). Right: proportion of VTA or LH projectors identified as D1-MSNs distributed across NAcSh rostro-caudal gradient. Plots show means ± SEMs.
Figure 3
Figure 3. Food Restriction Induces i-LTD onto Both LH GABA and VGluT2 Neuronal Subpopulation
(A) Schematic of the preparation to investigate synaptic transmission onto LH VGat-expressing neurons, with example image of ChR2+ NActerminals (green) and VGat+ neurons (red) in the LH (scale bar: 20 μm). (B) Left: norm. IPSCs before and after application of FSK. Right: average IPSC (% BL) from the last 5 min of recordings. The average IPSC (%BL) was significantly increased in food-restricted mice. Unpaired t test, t(21) = 2.91, p < 0.01. (C) Coefficients of variation of the amplitude of the IPSCs tend to increase in food-restricted animals but were not statistically significant. t21 = 1.226, p = 0.23. (D) Schematic showing timeline of rabies-tracing experiment in Drd1a-tdTomato × VGluT2Cre mice. (E) Low-magnification image of LH showing distribution of starter cells (expressing mCherry and GFP) and local pre-synaptic inputs expressing EGFP alone. Dense fibers in upper left corner likely reflect tdTomato expression from striatal projections, since tdTomato is not expressed in LH cell bodies (O’Connor et al., 2015). Scale bar: 50 μm. Panels at right show example starter cell, indicated by arrowhead. Scale bar: 50 μm. (F) Low-magnification image of LH VGluT2 pre-synaptic cells in accumbens (left; scale bar: 100 μm), with panels exemplifying 2 neurons co-expressing EGFP and tdTomato (right; scale bar: 20 μm; i.e., D1R-MSNs monosynaptically projecting to LH VGLuT2 cells). CPu, caudate putamen; NAcC, accumbens core; NAcSh, accumbens shell; aca, anterior commissure. Inset shows the quantification of EGFP colocalization with tdTomato in accumbens; 43 of 44 accumbal cells projecting to LH VGLuT2 neurons were D1R-MSNs (n = 2 mice). (G) Example recording from a connected VGluT2 neuron in response to blue light stimulation (2 × 4-ms light pulse, 50-ms interval). Summary connectivity plot showing 65% of VGluT2 neurons received light-evoked IPSCs from NAcSh afferents (28 of 43 cells; n = 5 mice). Scale bar: 20 ms, 200 pA. (H) Left: norm. IPSCs before and after application ofFSK. Right: average IPSC (% BL) from the last 5 min of recordings. The average IPSC(%BL) was significantly increased in food-restricted mice. Unpaired t test, t(17) = 2.725, p < 0.05. (I) Coefficients of variation of the amplitude of the IPSCs in VGLUT+ cellswere not affected by food restriction. t17 = 0.63, p = 0.54. Representative traces showa mean of 30 sweeps during baseline(black) and at the end of recording (red), after FSK application. Scale bars: 50 pA, 20 ms. Plots show means±SEMs. *p < 0.05, **p < 0.01.
Figure 4
Figure 4. Transmission at D1-MSN-to-LH Synapses Is Modulated by CB1R Signaling
(A) Left: norm. IPSC for all cells with application WIN55,212-2 (2 μM), SR141617A (5 μM), or control recordings in slices of ad libitum-fed mice. Right: average IPSC (% BL) of the last 5 min of recording. CB1R agonist application significantly decreased IPSCs. ANOVA: F(2,24) = 10.9, p < 0.01; for vehicle versus WIN: t(24) = 4.229, p < 0.001; for WIN versus SR: t(24) = 3.918, p < 0.01. (B) Coefficients of variation of the amplitude. (C) D1Cre mice with floxed-ChR2 in NAcSh were food restricted overnight (AFR), and plasticity at D1-MSN-to-LH synapse was assessed the next day. Body weight (% day 1) was significantly reduced in AFR mice. (D) Left: normalized IPSCs for SR141617A or vehicle applied to LH brain slices from AFR mice. Right: average norm. IPSCs of the last 5 min of recordings show significantly increased IPSCs after application of SR141716A. t(22) = 3.050, p < 0.01. (E) 1/CV2 was significantly increased by SR141617A. t21 = 2.113, *p < 0.05. Bars represent means ± SEMs. *p < 0.05, **p < 0.01, ***p < 0.001.
Figure 5
Figure 5. CB1R Signaling Is Required for D1-MSN-to-LH Plasticity after AFR and Concomitant Overeating
(A) Protocol for blockade of CB1R signaling with SR141716A in AFR or control groups. See Method Details for further details. (B) Body weight (% day 1)was significantly decreased in AFR mice versus controls. ANOVA: feeding condition, F(1,28) = 259.22, p < 0.01. SR141716 A treatment also significantly reduced body weight ANOVA: treatment, F(1,28) = 6.75, p < 0.05, but equally in both AFR and control mice. ANOVA: feeding condition × treatment interaction, not significant. (C) Norm. IPSCs during bath application of FSK averaged for all cells and groups. (D) Average IPSC (% BL) of the last 5 min of recording for all groups. FSK-induced i-LTP was present only in AFR mice injected with vehicle. This plasticity was prevented in AFR mice injected with SR141716A, and plasticity in these mice did not significantly differ from control VEH mice. ANOVA: feeding condition × treatment interaction, F(1,76) = 5.09, p < 0.05. (E) Body weight (% day 1) was significantly decreased in AFR mice versus controls. ANOVA: effect of feeding condition, F(1,13) = 629.95, p < 0.01. Also, SR141716A treatment significantly reduced body weight. ANOVA: treatment, F(1,13) = 34.97, p < 0.01) but did so in both feeding conditions. ANOVA: feeding condition × treatment interaction, not significant. (F) Total licks during 1-h lick test were significantly increased in AFR mice compared to control group, but SR141716Adecreased total licks in AFR mice. ANOVA: feeding condition × treatment interaction, F(1,13) = 44.63, p < 0.01. (G) Same as (F), but for number of bouts. Bout number was significantly increased in AFR mice injected with vehicle, and significantly decreased from this group in AFR mice injected with SR. ANOVA: feeding condition × treatment interaction: F(1,13) = 8.83, p < 0.05 (H) Total number of licks per bouts was not affected by AFR or the CB1R antagonist. (I) Protocol for blockade of intra-LH infusion of CB1R antagonist in AFR mice and CB1R in ad libitum-feć mice. See Method Details for further details. (J) Body weight. (K) The number of licks was significantly decreased by SR in AFR mice. Oppositely, intra-LH WIN increased intake in mice fed ad libitum. ANOVA: feeding condition × treatment interaction: F(1,10) = 75.61, p < 0.001. (L) The number of bouts was decreased by SR in AFR mice and increased by WIN in mice fed ad libitum. ANOVA: feeding condition × treatment interaction: F(1,10) = 51.22, p< 0.001. (M) The number of licks per bout was not affected by feeding condition or treatments. (N) C57BL/6J mice were fed a high-fat diet for 3 days and injected with SR1 41 71 6A or vehicle once every 1 2 h. Body weight (% day 1) at day 3 was significantly decreased in mice injected with SR141716A as compared to vehicle. ANOVA: treatment × day interaction: F(2,26) = 27.728, p < 0.01; SR versus vehicle (VEH) group at day3; unpairedt test, t13 = –5.797, p<0.01; for SR141716 A group day 3 versus day 1, pairedt test, t7 = 7.144,p< 0.01; for VEH group day 3 versus day 1, body weight tended to increase, t6 = –2.142, p = 0.076. (O) Total high-fat consumption (G) over the 3 treatment days was decreased in micetreated with SR141716A as compared tovehicle-injected mice. **Unpaired t test, t13 = –3.90,p<0.01. Representative traces show a mean of 30 sweeps during baseline (black) and at the end of recording (red), after HFS application. Representative traces show a mean of 30 sweeps during baseline (black) and at the end of recording (red), after FSK application. Bonferroni corrected t tests for 4 comparisons, *p < 0.05, **p < 0.01, ***p < 0.001. Scale bars, 50 pA, 20 ms. Plots show means ± SEMs.
Figure 6
Figure 6. High-Frequency Stimulation at D1-MSN-to-LH Synapses Reduces Overeating in Food-Restricted Mice
(A) Surgical strategy to stimulate D1-MSN terminals in the LH in vivo. (B) High-frequency stimulation protocol (HFS) and experiment timeline. Mice were stimulated 15 min before a 60-min session to assess food consumption (stimulation-free). (C) Left: body weight in grams. Mice were food restricted 24 h before being tested for food intake. Black bars indicate the 24-h food restriction periods. Right: average body weight loss (%) after 24 h food restriction. (D) Left: average licks per days. A mocked stimulation was performed 24 h after the first episode of food restriction. Dashed rectangles represent the results obtained 15 min after the stimulation protocols. Right: the number of licks was significantly decreased after HFS. t6 = 6.534, p < 0.001. (E) Left: average bouts of consumption over days. Right: the number of bouts was also decreased in mice submitted to the HFS protocol. t6 = 3.413, p < 0.05. In (C)-(E), bold lines represent the mean. Bars represent means ± SEMs. *p < 0.05, ***p < 0.001.

Comment in

  • Understanding the Munchies.
    Neuhofer D, Kalivas PW. Neuhofer D, et al. Neuron. 2020 Jul 8;107(1):11-13. doi: 10.1016/j.neuron.2020.06.009. Neuron. 2020. PMID: 32645304

References

    1. Arrigoni E, Chee MJS, Fuller PM. To eat or to sleep: that is a lateral hypothalamic question. Neuropharmacology. 2019;154:34–49. - PubMed
    1. Atwood BK, Lovinger DM, Mathur BN. Presynaptic longterm depression mediated by Gi/o-coupled receptors. Trends Neurosci. 2014a;37:663–673. doi: 10.1016/j.tins.2014.07.010. - DOI - PMC - PubMed
    1. Atwood BK, Kupferschmidt DA, Lovinger DM. Opioids induce dissociable forms of long-term depression of excitatory inputs to the dorsal striatum. Nat Neurosci. 2014b;17:540–548. doi: 10.1038/nn.3652. - DOI - PMC - PubMed
    1. Berridge KC. ‘Liking’ and ‘wanting’ food rewards: brain substrates and roles in eating disorders. Physiol Behav. 2009;97:537–550. doi: 10.1016/j.physbeh.2009.02.044. - DOI - PMC - PubMed
    1. Bocklisch C, Pascoli V, Wong JCY, House DRC, Yvon C, de Roo M, Tan KR, Lüscher C. Cocaine disinhibits dopamine neurons by potentiation of GABA transmission in the ventral tegmental area. Science. 2013;341:1521–1525. - PubMed

Publication types

MeSH terms

LinkOut - more resources