. 2020 Apr 25;19(1):94.
doi: 10.1186/s12934-020-01350-z.

Engineered butyrate-producing bacteria prevents high fat diet-induced obesity in mice

Affiliations

Engineered butyrate-producing bacteria prevents high fat diet-induced obesity in mice

Liang Bai et al. Microb Cell Fact. .

Abstract

Background: Obesity is a major problem worldwide and severely affects public safety. As a metabolite of gut microbiota, endogenous butyric acid participates in energy and material metabolism. Considering the serious side effects and weight regain associated with existing weight loss interventions, novel strategies are urgently needed for prevention and treatment of obesity.

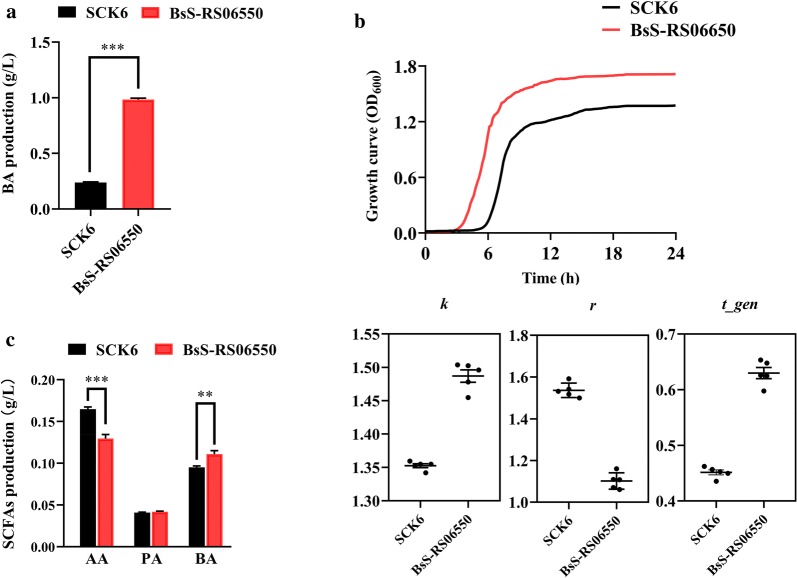
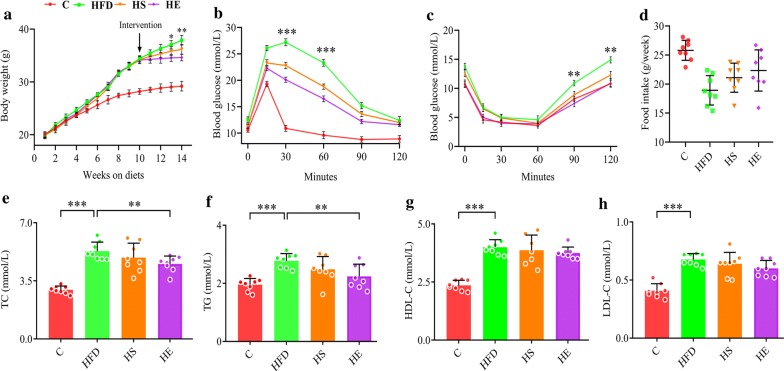
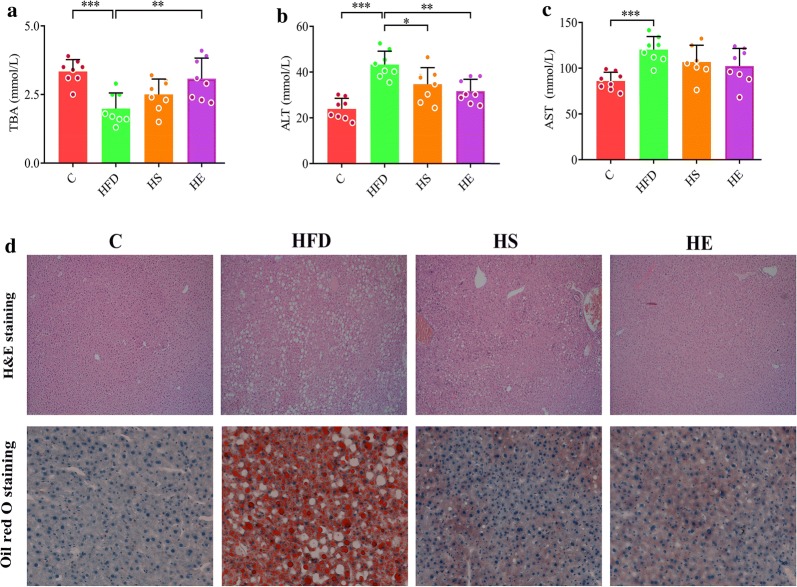
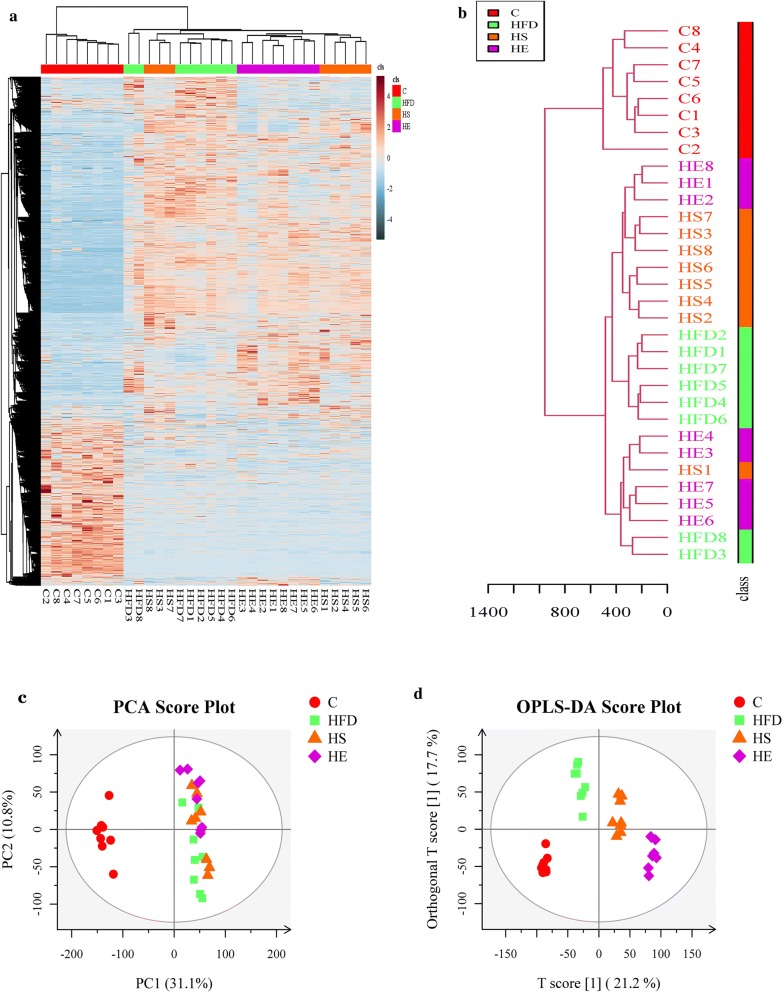
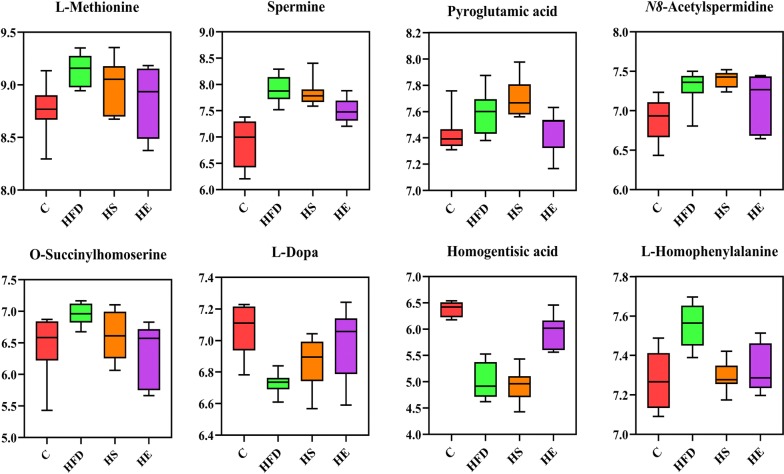
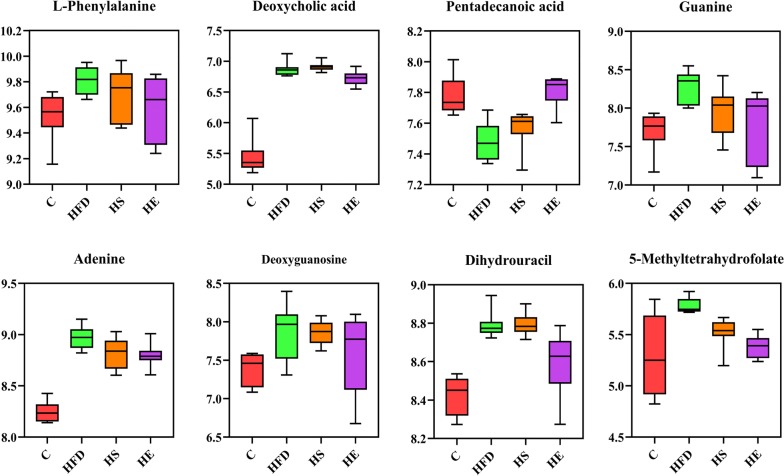
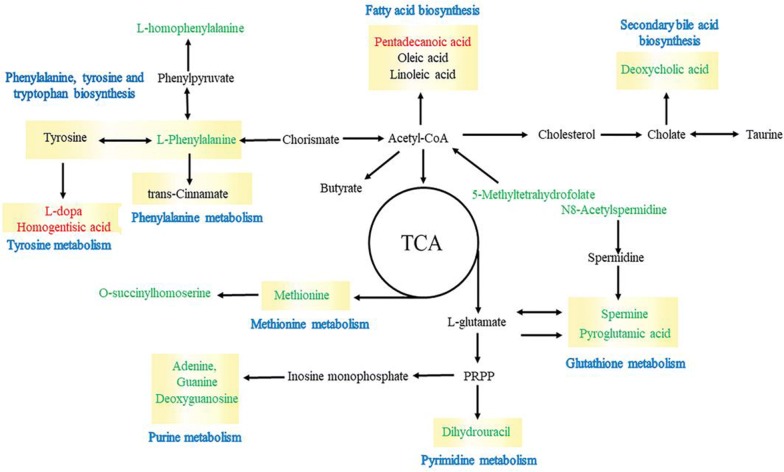
Results: In the present study, we engineered Bacillus subtilis SCK6 to exhibited enhanced butyric acid production. Compared to the original Bacillus subtilis SCK6 strain, the genetically modified BsS-RS06550 strain had higher butyric acid production. The mice were randomly divided into four groups: a normal diet (C) group, a high-fat diet (HFD) group, an HFD + Bacillus subtilis SCK6 (HS) group and an HFD + BsS-RS06550 (HE) group. The results showed BsS-RS06550 decreased the body weight, body weight gain, and food intake of HFD mice. BsS-RS06550 had beneficial effects on blood glucose, insulin resistance and hepatic biochemistry. After the 14-week of experiment, fecal samples were collected for nontargeted liquid chromatography-mass spectrometry analysis to identify and quantify significant changes in metabolites. Sixteen potentially significant metabolites were screened, and BsS-RS06550 was shown to potentially regulate disorders in glutathione, methionine, tyrosine, phenylalanine, and purine metabolism and secondary bile acid biosynthesis.

Conclusions: In this study, we successfully engineered Bacillus subtilis SCK6 to have enhanced butyric acid production. The results of this work revealed that the genetically modified live bacterium BsS-RS06550 showed potential anti-obesity effects, which may have been related to regulating the levels of metabolites associated with obesity. These results indicate that the use of BsS-RS06550 may be a promising strategy to attenuate obesity.

Keywords: Butyric acid; Engineered bacteria; Fecal metabolomics; High-fat diet; Obesity.


Conflict of interest statement

The authors declare that they have no competing interests.

Figures

Fig. 1
Fig. 1
In vitro culture of B. subtilis SCK6 and BsS-RS06550. a BA production of SCK6 and BsS-RS06550. b Growth curves of B. subtilis SCK6 and BsS-RS06550 at OD600. Growth curve parameters, k is the maximum possible population size in particular environment or the carrying capacity; r is the intrinsic growth rate of the population and t-gen is doubling time or generation time of a population. c SCFAs production in microbial community co-culture with SCK6 and BsS-RS06550, respectively, including acetic acid (AA), propanoic acid (PA), and butyric acid (BA). Data are represented as mean ± SD, n = 5 repeats for (a, c). *p value < 0.05, **p < 0.01 and ***p < 0.001
Fig. 2
Fig. 2
Effects of BsS-RS06550 on physiology and lipid metabolism in blood. a Weekly body weight, b glucose tolerance test following intervention. c Insulin tests following intervention, d weekly food intake, lipid metabolism in blood, TC (e), TG (f), HDL-C (g) and LDL-C (h). Data represented as mean ± SD, n = 8 mice/group for (ah). *p value < 0.05, **p < 0.01 and ***p < 0.001
Fig. 3
Fig. 3
Effects of BsS-RS06550 on HFD-induced hepatic steatosis. a Serum TBA level, b serum ALT level, c serum AST level, d hematoxylin and eosin (H&E) staining and oil red O staining of and livers (×200). Data represented as mean ± SD, and n = 8 mice/group for (a–c). *p value < 0.05, **p < 0.01 and ***p < 0.001
Fig. 4
Fig. 4
Untargeted fecal metabolomics analysis. a Hierarchical clustering of differentially metabolites in all groups. b Tree analysis of samples. c PCA score plots of fecal metabolic profiles, normal diet group (C), a high-fat diet group (HFD), HFD + Bacillus subtilis SCK6 group (HS) and HFD + BsS-RE06550 (HE). d OPLS-DA score plots of fecal metabolic profiling of C, HFD, HS and HE
Fig. 5
Fig. 5
Box plots of relative abundance of significance metabolites in glutathione, methionine, tyrosine, phenylalanine metabolism, and C (control), HFD (high-fat diet), HFD + Bacillus subtilis SCK6 group (HS) and HFD + BsS-RS06550 (HE) groups (n = 8 for each group). Normalizing the intensity data with log function conversion (based on 10)
Fig. 6
Fig. 6
Box plots of relative abundance of significance metabolites in purine metabolism and secondary bile acid biosynthesis, and C (control), HFD (high-fat diet), HFD + Bacillus subtilis SCK6 group (HS) and HFD + BsS-RS06550 (HE) groups (n = 8 for each group). Normalizing the intensity data with log function conversion (based on 10)
Fig. 7
Fig. 7
Schematic diagram of proposed metabolic pathways in all fecal samples. Red and green represent up- and downregulated metabolites, respectively

References

    1. Mulders RJ, de Git KCG, Schéle E, Dickson SL, Sanz Y, Adan RAH. Microbiota in obesity: interactions with enteroendocrine, immune and central nervous systems. Obes Rev. 2018;19:435–451. doi: 10.1111/obr.12661. - DOI - PubMed
    1. Nyberg ST, Batty GD, Pentti J, Virtanen M, Alfredsson L, Fransson EI, et al. Obesity and loss of disease-free years O6 wing to major non-communicable diseases: a multigroup study. Lancet Public Health. 2018;3:e490–e497. doi: 10.1016/S2468-2667(18)30139-7. - DOI - PMC - PubMed
    1. Ng M, Fleming T, Robinson M, Thomson B, Graetz N, Margono C, et al. Global, regional, and national prevalence of overweight and obesity in children and adults during 1980–2013: a systematic analysis for the global burden of disease study 2013. Lancet. 2014;384:766–781. doi: 10.1016/S0140-6736(14)60460-8. - DOI - PMC - PubMed
    1. Batsis JA, Villareal DT. Sarcopenic obesity in older adults: aetiology, epidemiology and treatment strategies. Nat Rev Endocrinol. 2018;14:513–537. doi: 10.1038/s41574-018-0062-9. - DOI - PMC - PubMed
    1. Ford ES, Mokdad AH, Giles WH, Galuska DA, Serdula MK. Geographic variation in the prevalence of obesity, diabetes, and obesity-related behaviors. Obes Res. 2005;13:118–122. doi: 10.1038/oby.2005.15. - DOI - PubMed