. 2020 Apr 25;18(1):32.
doi: 10.1186/s12958-020-00592-1.

Decreased brain and muscle ARNT-like protein 1 expression mediated the contribution of hyperandrogenism to insulin resistance in polycystic ovary syndrome

Affiliations

Decreased brain and muscle ARNT-like protein 1 expression mediated the contribution of hyperandrogenism to insulin resistance in polycystic ovary syndrome

Junyu Zhai et al. Reprod Biol Endocrinol. .

Abstract

Background: The interface between environmental risk factors and genetic factors could contribute to the pathogenesis of hyperandrogenism and insulin resistance in polycystic ovary syndrome (PCOS); however, the underlying complex mechanism remains to be elucidated.

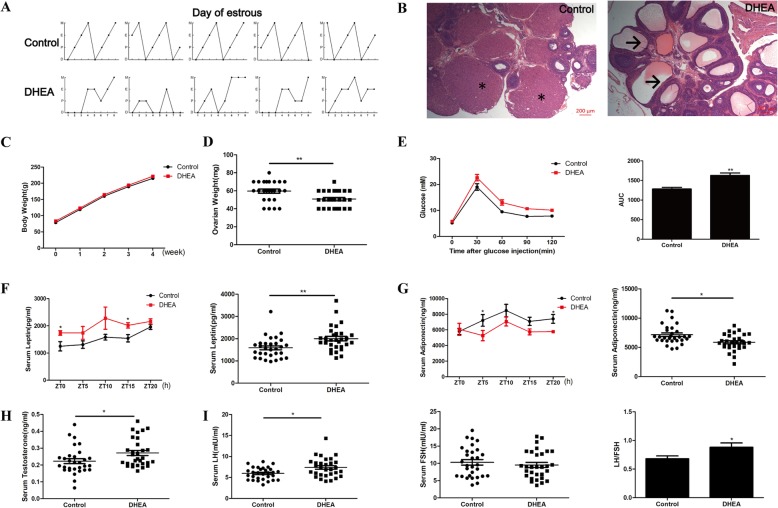
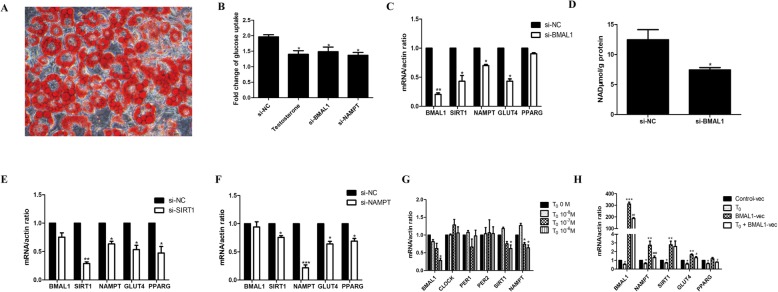
Methods: We used dehydroepiandrosterone (DHEA)-induced PCOS-like rat model to measure circadian clock genes and insulin resistance-related genes. Additionally, we performed in vitro experiments in mature adipocytes to verify the molecular mechanisms.

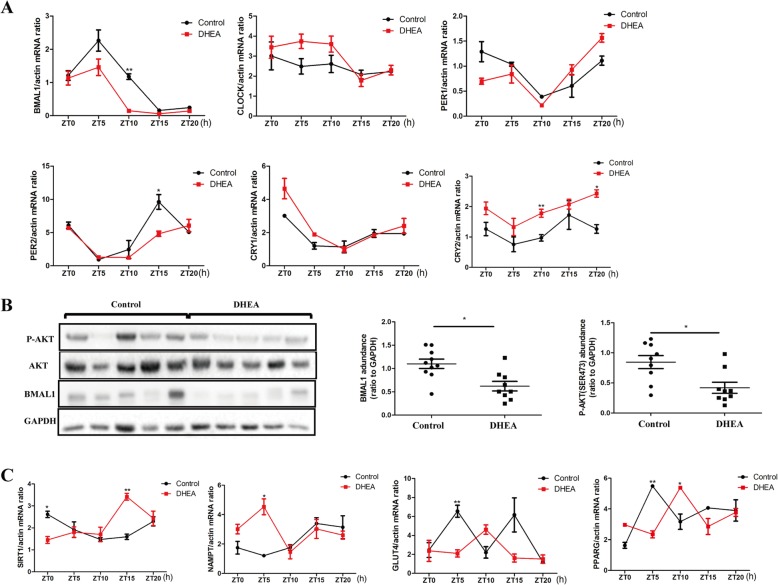
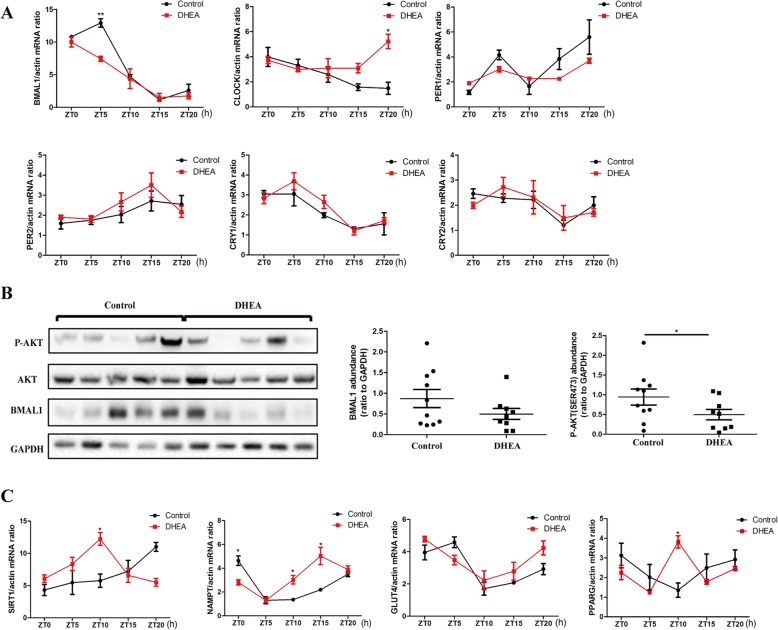
Results: DHEA-induced PCOS-like rats exhibited insulin resistance and arrhythmic expression of circadian clock genes in the liver and adipose tissues, particularly showing decreased brain and muscle ARNT-like protein 1 (BMAL1) expression. In addition, hyperandrogenism gave rise to negative regulation of BMAL1 expression to nicotinamide phosphoribosyltransferase and sirtuin 1, which further inhibited downstream glucose transporter type 4, leading to insulin resistance in mature adipocytes, which was consistent with our previous results in HepG2 cells.

Conclusions: Decreased BMAL1 expression in the liver and adipose played a potentially novel role in the contribution of hyperandrogenism to insulin resistance, which might be a possible mechanism accounting for the pathogenesis of PCOS.

Keywords: BMAL1; Circadian clock; Hyperandrogenism; Insulin resistance; PCOS.


Conflict of interest statement

The authors declare no competing or financial interests.

Figures

Fig. 1
Fig. 1
Characteristics of DHEA-induced PCOS-like rat model. a Estrous cycles of control and DHEA rats in the last 8 days. E (estrum), P (proestrus), M (metestrus), D (diestrus). b HE staining of the ovaries of control and DHEA rats. * for CL, → for cystic follicles. c Body weight of control and DHEA rats over 4 weeks. d Ovarian weight of control and DHEA rats after 4-week treatment. e GTT and area under the curve of control and DHEA rats after 4-week treatment. f Serum leptin levels in control and DHEA rats after 4-week treatment. g Serum adiponectin levels in control and DHEA rats after 4-week treatment. h Serum testosterone levels in control and DHEA rats after 4-week treatment. i Serum LH and FSH levels as well as LH/FSH ratio in control and DHEA rats after 4-week treatment. N = 30 per group. * p < 0.05, ** p < 0.01
Fig. 2
Fig. 2
Expression of circadian clock genes and insulin pathway genes in the liver tissue of control and DHEA rats. aBmal1, Clock, Per1, Per2, Cry1, and Cry2 mRNA expressions in the liver of control and DHEA rats. b P-AKT, T-AKT, and BMAL1 protein expressions in the liver of control and DHEA rats. Left, a representative western blot is shown. Middle, the immunoreactive bands for BMAL1 were quantified densitometrically. Right, the immunoreactive bands for AKT phosphorylation were quantified densitometrically. c mRNA expression of insulin pathway-associated genes including Sirt1, Nampt, Glut4, and Pparg in the liver of control and DHEA rats. N = 6 per time point and N = 30 for each group in total. * p < 0.05, ** p < 0.01
Fig. 3
Fig. 3
Expression of circadian clock genes and insulin pathway genes in the adipose tissue of control and DHEA rats. aBmal1, Clock, Per1, Per2, Cry1, and Cry2 mRNA expressions in the adipose of control and DHEA rats. b P-AKT, T-AKT, and BMAL1 protein expressions in the adipose of control and DHEA rats. Left, a representative western blot is shown. Middle, the immunoreactive bands for BMAL1 were quantified densitometrically. Right, the immunoreactive bands for AKT phosphorylation were quantified densitometrically. c mRNA expression of insulin pathway-associated genes including Sirt1, Nampt, Glut4, and Pparg in the adipose of control and DHEA rats. N = 6 per time point and N = 30 for each group in total. * p < 0.05, ** p < 0.01
Fig. 4
Fig. 4
Hyperandrogenism facilitated BMAL1-mediated insulin resistance through the NAMPT/NAD+/SIRT1 pathway in mature adipocytes. a The mature adipose cells were differentiated from 3 T3-L1 preadipocytes after oil red O staining. b Glucose uptake after NC siRNA, testosterone (10− 6 M for 24 h), Bmal1 siRNA, or Nampt siRNA treatment in mature adipocytes. Glucose uptake was measured after insulin stimulation (100 nM for 20 min). cBmal1, Sirt1, Nampt, Glut4, and Pparg mRNA expressions after knocking down Bmal1 in mature adipocytes. d Cellular NAD+ level after knocking down Bmal1 in mature adipocytes. eBmal1, Sirt1, Nampt, Glut4, and Pparg mRNA expressions after knocking down Sirt1 in mature adipocytes. fBmal1, Sirt1, Nampt, Glut4, and Pparg mRNA expressions after knocking down Nampt in mature adipocytes. gBmal1, Clock, Per1, Per2, Sirt1, and Nampt mRNA expressions after treatment with different doses of testosterone for 24 h in mature adipocytes. hBmal1, Nampt, Sirt1, Glut4, and Pparg mRNA expressions after Bmal1 overexpression and further incubation with testosterone (10− 6 M for 24 h) in mature adipocytes. * P < 0.05, ** P < 0.01, *** P < 0.001 against NC siRNA cells or against T0 0 M cells or against Control-vec cells; # P < 0.05, ## P < 0.01, ### P < 0.001 against BMAL1-vec cells

References

    1. Elia E, Sander V, Luchetti CG, Solano ME, Di Girolamo G, Gonzalez C, et al. The mechanisms involved in the action of metformin in regulating ovarian function in hyperandrogenized mice. Mol Hum Reprod. 2006;12:475–481. doi: 10.1093/molehr/gal057. - DOI - PubMed
    1. Stepto NK, Cassar S, Joham AE, Hutchison SK, Harrison CL, Goldstein RF, et al. Women with polycystic ovary syndrome have intrinsic insulin resistance on euglycaemic-hyperinsulaemic clamp. Hum Reprod. 2013;28:777–784. doi: 10.1093/humrep/des463. - DOI - PubMed
    1. Dunaif A, Wu X, Lee A, Diamanti-Kandarakis E. Defects in insulin receptor signaling in vivo in the polycystic ovary syndrome (PCOS) Am J Physiol Endocrinol Metab. 2001;281:E392–E399. doi: 10.1152/ajpendo.2001.281.2.E392. - DOI - PubMed
    1. Merkin SS, Phy JL, Sites CK, Yang D. Environmental determinants of polycystic ovary syndrome. Fertil Steril. 2016;106:16–24. doi: 10.1016/j.fertnstert.2016.05.011. - DOI - PubMed
    1. Ueda HR, Hayashi S, Chen W, Sano M, Machida M, Shigeyoshi Y, et al. System-level identification of transcriptional circuits underlying mammalian circadian clocks. Nat Genet. 2005;37:187–192. doi: 10.1038/ng1504. - DOI - PubMed

MeSH terms

Substances