. 2020;396(10252):693-724.
doi: 10.1016/S0140-6736(20)30608-5. Epub 2020 Apr 23.

Health sector spending and spending on HIV/AIDS, tuberculosis, and malaria, and development assistance for health: progress towards Sustainable Development Goal 3

Collaborators

Health sector spending and spending on HIV/AIDS, tuberculosis, and malaria, and development assistance for health: progress towards Sustainable Development Goal 3

Global Burden of Disease Health Financing Collaborator Network. Lancet. 2020.

Abstract

Background: Sustainable Development Goal (SDG) 3 aims to "ensure healthy lives and promote well-being for all at all ages". While a substantial effort has been made to quantify progress towards SDG3, less research has focused on tracking spending towards this goal. We used spending estimates to measure progress in financing the priority areas of SDG3, examine the association between outcomes and financing, and identify where resource gains are most needed to achieve the SDG3 indicators for which data are available.

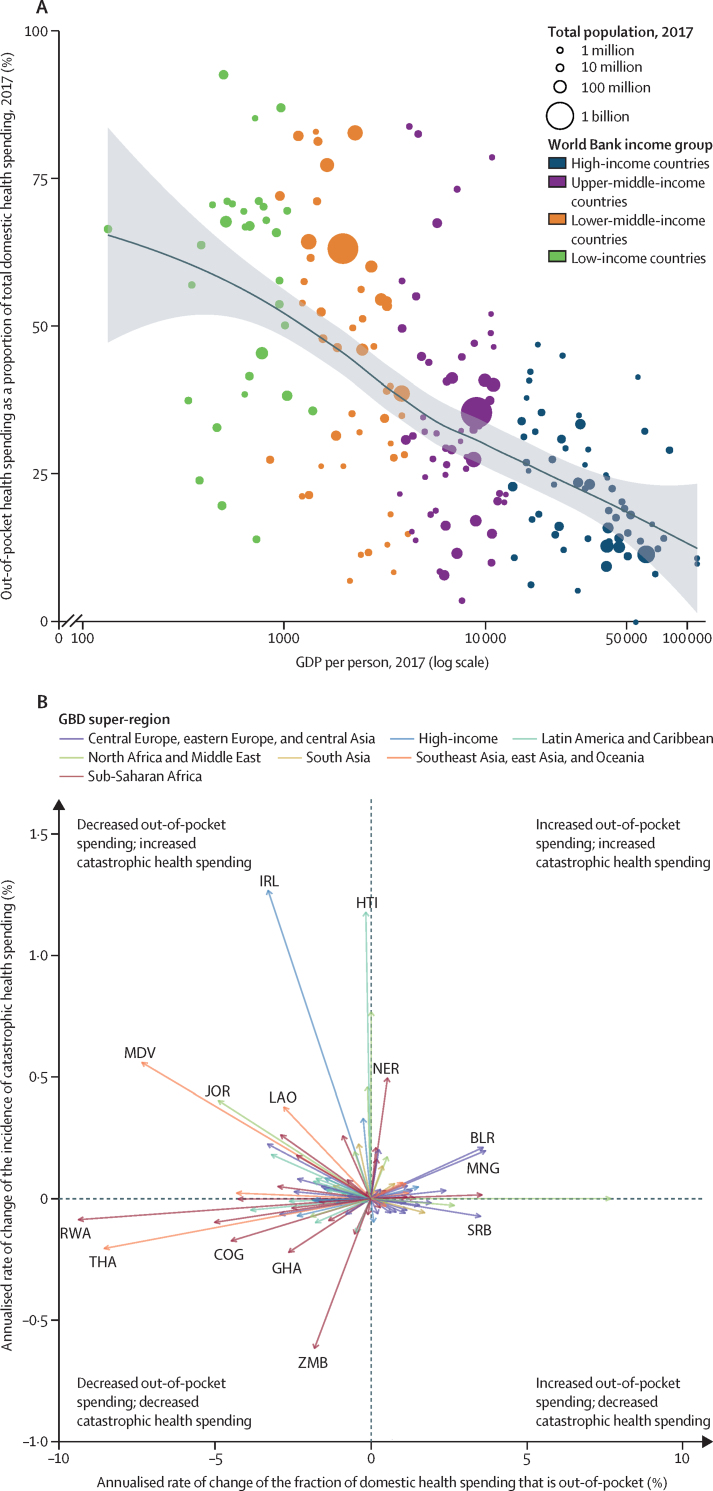
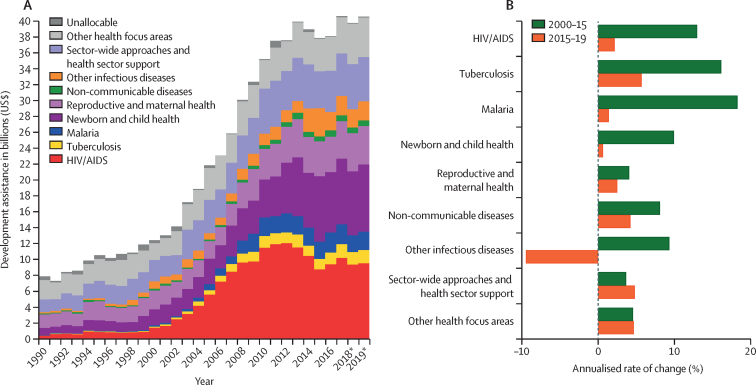
Methods: We estimated domestic health spending, disaggregated by source (government, out-of-pocket, and prepaid private) from 1995 to 2017 for 195 countries and territories. For disease-specific health spending, we estimated spending for HIV/AIDS and tuberculosis for 135 low-income and middle-income countries, and malaria in 106 malaria-endemic countries, from 2000 to 2017. We also estimated development assistance for health (DAH) from 1990 to 2019, by source, disbursing development agency, recipient, and health focus area, including DAH for pandemic preparedness. Finally, we estimated future health spending for 195 countries and territories from 2018 until 2030. We report all spending estimates in inflation-adjusted 2019 US$, unless otherwise stated.

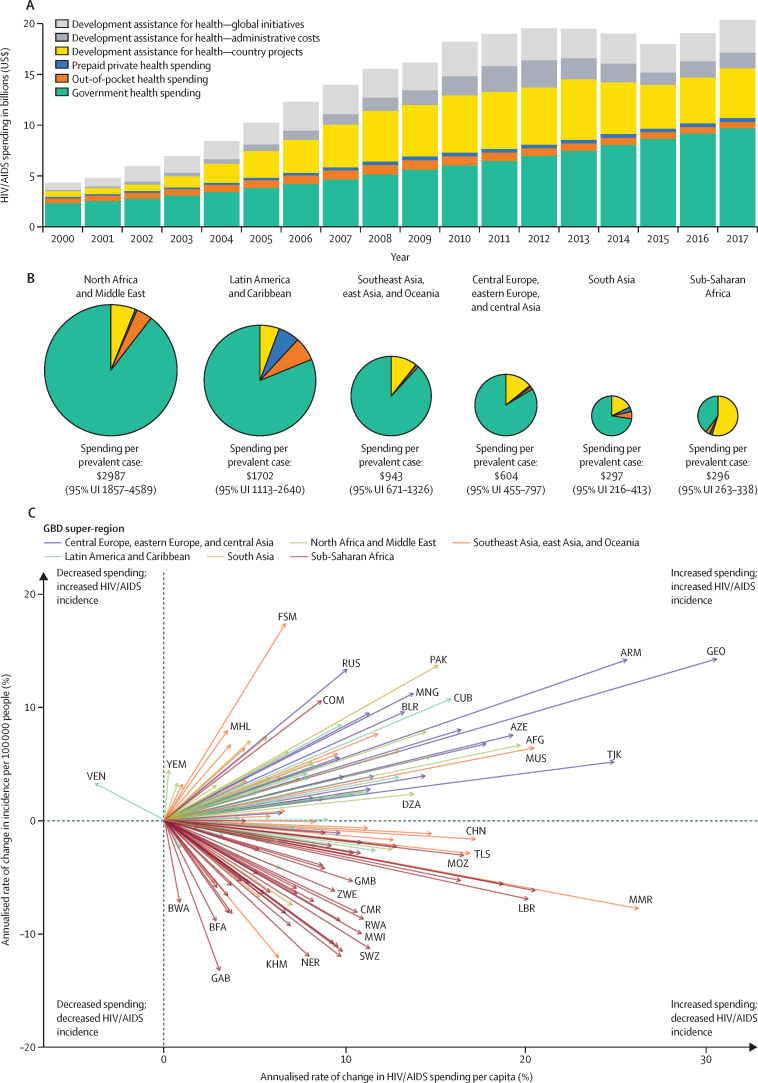
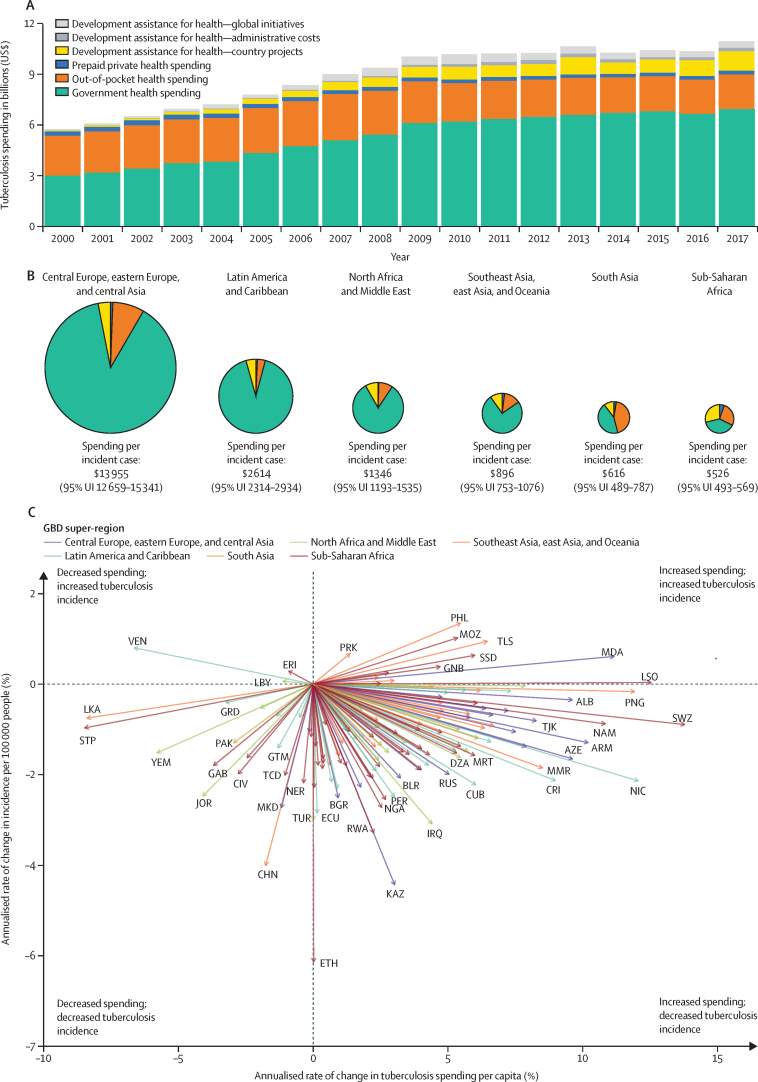
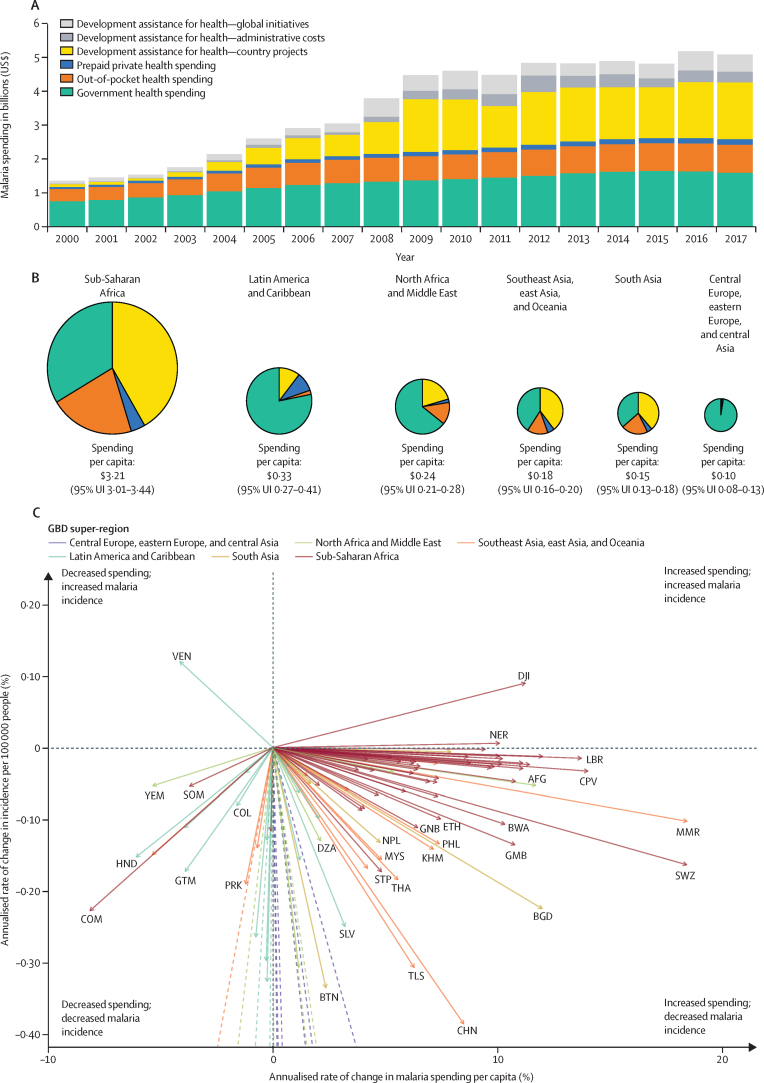
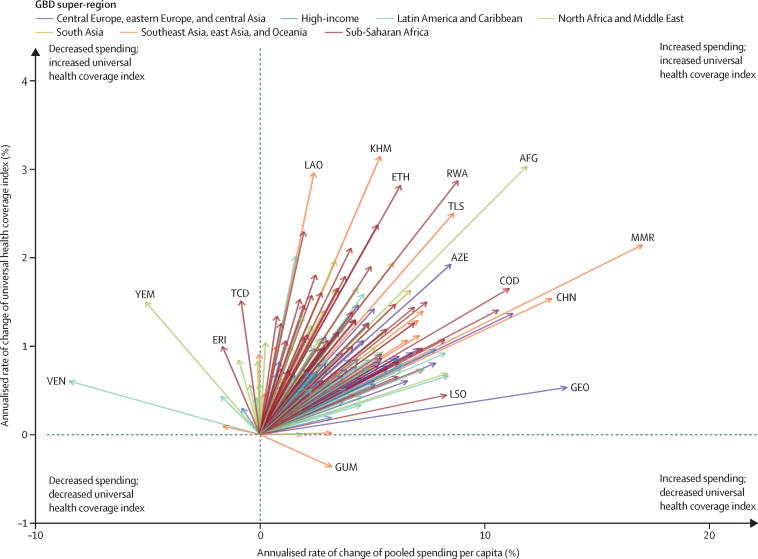
Findings: Since the development and implementation of the SDGs in 2015, global health spending has increased, reaching $7·9 trillion (95% uncertainty interval 7·8-8·0) in 2017 and is expected to increase to $11·0 trillion (10·7-11·2) by 2030. In 2017, in low-income and middle-income countries spending on HIV/AIDS was $20·2 billion (17·0-25·0) and on tuberculosis it was $10·9 billion (10·3-11·8), and in malaria-endemic countries spending on malaria was $5·1 billion (4·9-5·4). Development assistance for health was $40·6 billion in 2019 and HIV/AIDS has been the health focus area to receive the highest contribution since 2004. In 2019, $374 million of DAH was provided for pandemic preparedness, less than 1% of DAH. Although spending has increased across HIV/AIDS, tuberculosis, and malaria since 2015, spending has not increased in all countries, and outcomes in terms of prevalence, incidence, and per-capita spending have been mixed. The proportion of health spending from pooled sources is expected to increase from 81·6% (81·6-81·7) in 2015 to 83·1% (82·8-83·3) in 2030.

Interpretation: Health spending on SDG3 priority areas has increased, but not in all countries, and progress towards meeting the SDG3 targets has been mixed and has varied by country and by target. The evidence on the scale-up of spending and improvements in health outcomes suggest a nuanced relationship, such that increases in spending do not always results in improvements in outcomes. Although countries will probably need more resources to achieve SDG3, other constraints in the broader health system such as inefficient allocation of resources across interventions and populations, weak governance systems, human resource shortages, and drug shortages, will also need to be addressed.

Funding: The Bill & Melinda Gates Foundation.


Figures

Figure 1
Figure 1
HIV/AIDS spending in low-income and middle-income countries (A) Total spending on HIV/AIDS by financing source, 2000 to 2017. (B) Breakdown of financing sources of HIV/AIDS spending and total HIV/AIDS spending per prevalent case, by GBD super-region, in 2017 with pie size proportional to spending per prevalent case of HIV/AIDS. (C) Annualised rates of change in HIV/AIDS prevalence and HIV/AIDS spending per capita, with each arrow showing one country moving from 2000 to 2017. Data are from all World Bank low-income and middle-income countries and spending estimates are presented in 2019 $US. Venezuela's spending is presented in 2014 $US. Administrative expenses that are only shown in panel A and reflect the operational expense of deploying the grant that is accrued in the donor country (eg, salaries of headquarters office staff). AFG=Afghanistan. ARM=Armenia. AZE=Azerbaijan. BFA=Burkina Faso. BLR=Belarus. BWA=Botswana. CHN=China. CMR=Cameroon. COM=Comoros. CUB=Cuba. DZA=Algeria. FSM=Federated States of Micronesia. GAB=Gabon. GBD=Global Burden of Diseases, Injuries, and Risk Factors study. GEO=Georgia. GMB=The Gambia. KHM=Cambodia. LBR=Liberia. MHL=Marshall Islands. MMR=Myanmar. MNG=Mongolia. MOZ=Mozambique. MUS=Mauritius MWI=Malawi. NER=Niger. PAK=Pakistan. RUS=Russia. RWA=Rwanda. SWZ=eSwatini. TJK=Tajikistan. TLS=Timor-Leste. VEN=Venezuela. YEM=Yemen. ZWE=Zimbabwe.
Figure 2
Figure 2
Tuberculosis spending in low-income and middle-income countries (A) Spending on tuberculosis by financing source, 2000 to 2017. (B) Breakdown of financing sources of tuberculosis spending and total tuberculosis spending for each incident case, by GBD super-region, in 2017, with pie size proportional to spending per prevalent case of tuberculosis. (C) Annualised rates of change in tuberculosis incidence and tuberculosis spending per capita, with each arrow showing one country moving from 2000 to 2017. Data are from all World Bank low-income and middle-income countries and spending estimates are presented in 2019 US$. Venezuela's spending is presented in 2014 US$. Administrative expenses that are only shown in panel A reflect the operational expense of deploying the grant that is accrued in the donor country (eg, salaries of headquarters office staff). ALB=Albania. ARM=Armenia. AZE=Azerbaijan. BGR=Bulgaria. BLR=Belarus. CHN=China. CIV=Côte d'Ivoire. CRI=Costa Rica. CUB=Cuba. DZA=Algeria. ECU=Ecuador. ERI=Eritrea. GAB=Gabon. GBD=Global Burden of Diseases, Injuries, and Risk Factors study. GNB=Guinea-Bissau. GRD=Grenada. GTM=Guatemala. IRQ=Iraq. JOR=Jordan. KAZ=Kazakhstan. LBY=Libya. LKA=Sri Lanka. LSO=Lesotho. MDA=Moldova. MKD=North Macedonia. MMR=Myanmar. MOZ=Mozambique. MRT=Mauritania. NAM=Namibia. NER=Niger. NGA=Nigeria. NIC=Nicaragua. PAK=Pakistan. PER=Peru. PHL=Philippines. PNG=Papua New Guinea. PRK=North Korea. RUS=Russia. RWA=Rwanda. SSD=South Sudan. STP=São Tomé and Príncipe. SWZ=eSwatini. TCD=Chad. TJK=Tajikistan. TLS=Timor-Leste. TUR=Turkey. VEN=Venezuela. YEM=Yemen.
Figure 3
Figure 3
Malaria spending in 106 malaria endemic countries (A) Total spending on malaria by financing source, 2000 to 2017. (B) Breakdown of financing source of malaria spending and the total malaria spending for each incident case, by GBD super-region, in 2017, with pie size proportional to spending per prevalent case of malaria. (C) Annualised rates of change in malaria incidence and malaria spending per capita, with each arrow showing one country moving from 2000 to 2017. Data are from all malaria-endemic World Bank low-income and middle-income countries and spending estimates are presented in 2019 US$. Venezuela's spending is presented in 2014 US$. Administrative expenses are only shown in panel A reflect the operational expense of deploying the grant that is accrued in the donor country (eg, salaries of headquarters office staff). In panel C, dashed lines indicate countries that have eliminated malaria. World Bank low- and middle-income countries that have eliminated malaria since 2000 are Argentina, Armenia, Azerbaijan, Costa Rica, Georgia, Iraq, Kyrgyzstan, Morocco, Paraguay, Sri Lanka, Syria, Tajikistan, Turkey, and Uzbekistan. AFG=Afghanistan. BGD=Bangladesh. BTN=Bhutan. BWA=Botswana. CHN=China. COL=Colombia. COM=Comoros. CPV=Cape Verde. DJI=Djibouti. DZA=Algeria. ETH=Ethiopia. GBD=Global Burden of Diseases, Injuries, and Risk Factors study. GMB=The Gambia. GNB=Guinea-Bissau. GTM=Guatemala. HND=Honduras. KHM=Cambodia. LBR=Liberia. MMR=Myanmar. MYS=Malaysia. NER=Niger. NPL=Nepal. PHL=Philippines. PRK=North Korea. SLV=El Salvador. SOM=Somalia. STP=São Tomé and PrÍncipe. SWZ=eSwatini. THA=Thailand. TLS=Timor-Leste. VEN=Venezuela. YEM=Yemen.
Figure 4
Figure 4
Annualised rate of change in universal health service coverage index and annualised rate of change in pooled health spending per capita, 2000 to 2017 Data are for 195 countries in territories, by GBD super-region. Spending estimates are presented in 2019 US$, and pooled health spending is the sum of government spending, prepaid private spending, and development assistance for health. Each arrow shows one country moving from 2000 to 2017. Spending estimates are presented in 2019 US$. AFG=Afghanistan. AZE=Azerbaijan. CHN=China. COD=Democratic Republic of the Congo. ERI=Eritrea. ETH=Ethiopia. GBD=Global Burden of Diseases, Injuries, and Risk Factors study. GEO=Georgia. GUM=Guam. KHM=Cambodia. LAO=Laos. LSO=Lesotho. MMR=Myanmar. RWA=Rwanda. TCD=Chad. TLS=Timor-Leste. VEN=Venezuela. YEM=Yemen.
Figure 5
Figure 5
Out-of-pocket spending for health (A) Out-of-pocket spending as a share of total health spending, in 2017. (B) Change in proportion of households with catastrophic health spending versus change in proportion of domestic health spending that is out-of-pocket, 2000–17. Spending estimates are presented in 2019 US$. In panel A, estimates are plotted against GDP per capita with a loess regression line (span=0·95) and 95% uncertainty intervals shaded in grey. Timor-Leste is excluded from panel B because the World Bank estimates for 2000–17 showed that no households in the country had catastrophic health spending. BLR=Belarus. GBD=Global Burden of Diseases, Injuries, and Risk Factors study. GDP=Gross Domestic Product. HTI=Haiti. IRL=Ireland. JOR=Jordan. LAO=Laos. MDV=Maldives. MNG=Mongolia. NER=Niger. RWA=Rwanda. SRB=Serbia. THA=Thailand. ZMB=Zambia.
Figure 6
Figure 6
Development assistance for health (A) Changes in development assistance for health by health focus area, 1990–2019. (B) Annualised rate of change in development assistance for health by health focus area, 2000–15 and 2015–19. Estimates are presented in billions of 2019 US$. GBD=Global Burden of Diseases, Injuries, and Risk Factors study. *Data for 2018 and 2019 are preliminary estimates based on budget data and estimation.

Comment in

  • Understanding health spending for SDG 3.
    Sundewall J, Forsberg BC. Sundewall J, et al. Lancet. 2020 5-11 Sep;396(10252):650-651. doi: 10.1016/S0140-6736(20)30963-6. Epub 2020 Apr 23. Lancet. 2020. PMID: 32334652 Free PMC article. No abstract available.

References

    1. GBD 2017 SDG Collaborators Measuring progress from 1990 to 2017 and projecting attainment to 2030 of the health-related Sustainable Development Goals for 195 countries and territories: a systematic analysis for the Global Burden of Disease Study 2017. Lancet. 2018;392:2091–2138. - PMC - PubMed
    1. GBD 2016 SDG Collaborators Measuring progress and projecting attainment on the basis of past trends of the health-related Sustainable Development Goals in 188 countries: an analysis from the Global Burden of Disease Study 2016. Lancet. 2017;390:1423–1459. - PMC - PubMed
    1. WHO . World Health Organization; Geneva: Oct 25, 2019. 2019. Thirteenth general programme of work 2019–2023.https://www.who.int/about/what-we-do/thirteenth-general-programme-of-wor...
    1. United Nations; New York, NY: July, 2019. United Nations Secretary-General's roadmap for financing the 2030 agenda for sustainable development 2019 - 2021.https://www.un.org/sustainabledevelopment/wp-content/uploads/2019/07/UN-...
    1. United Nations Statistics Division SDG Indicators Metadata repository. New York, NY: United Nations. https://unstats.un.org/sdgs/metadata/?Text=&Goal=3&Target=3.8

Publication types