. 2020 Aug;177(15):3535-3551.
doi: 10.1111/bph.15077. Epub 2020 May 30.

B1 and B2 kinin receptor blockade improves psoriasis-like disease

Affiliations

B1 and B2 kinin receptor blockade improves psoriasis-like disease

Bruna da Silva Soley et al. Br J Pharmacol. 2020 Aug.

Abstract

Background and purpose: The entire kallikrein-kinin system is present in the skin, and it is thought to exert a relevant role in cutaneous diseases, including psoriasis. The present study was designed to evaluate the relevance of kinin receptors in the development and progression of a model of psoriasis in mice.

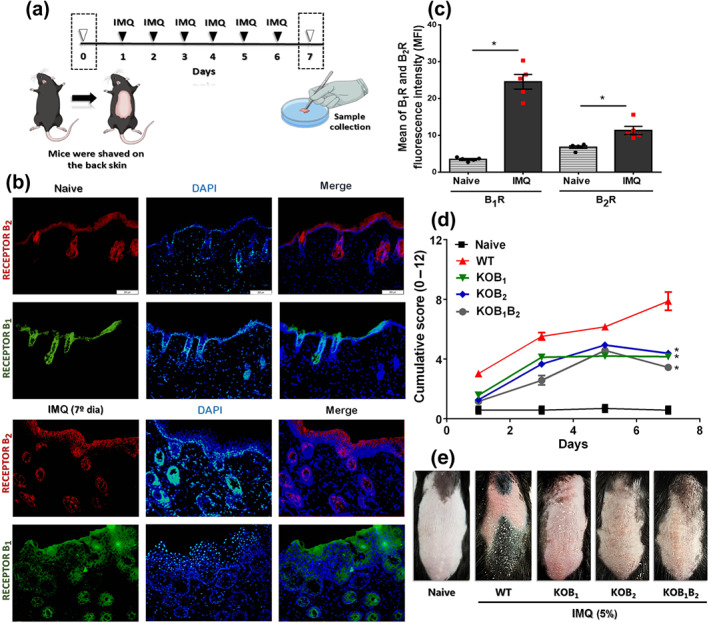
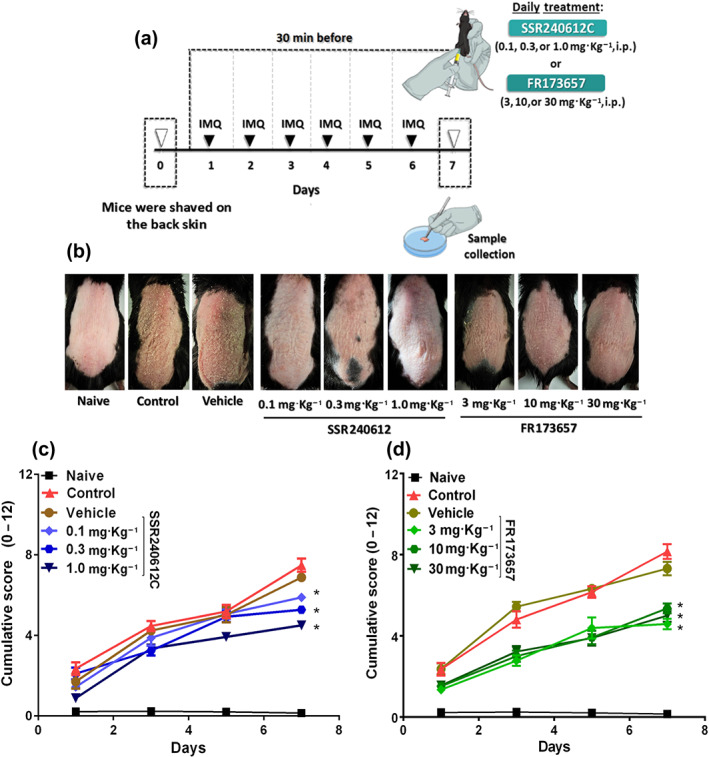
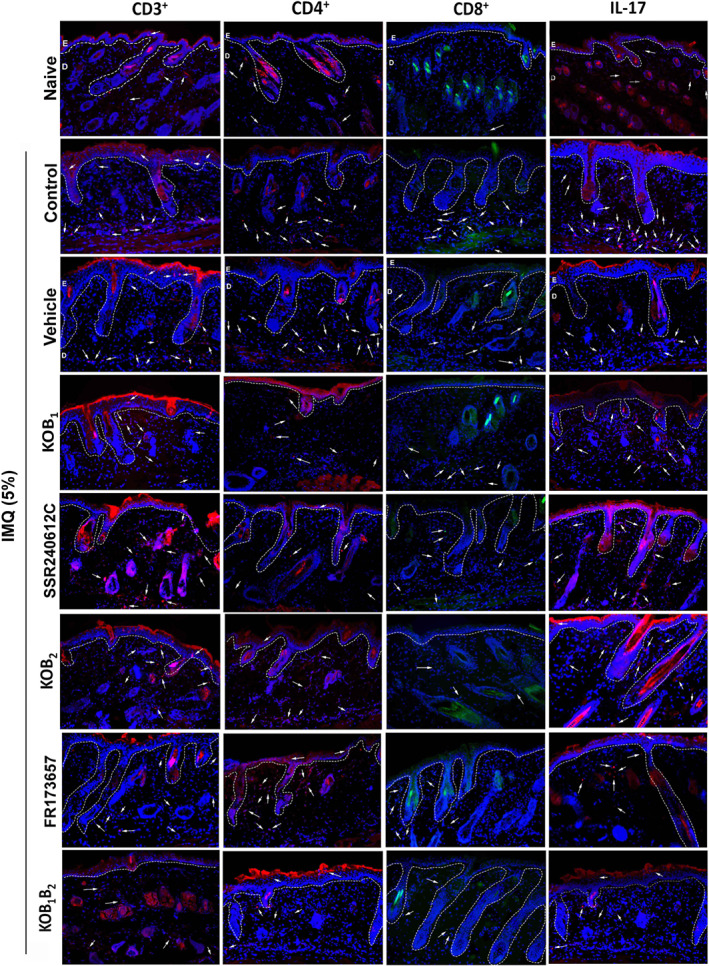
Experimental approach: The effects of kinin B1 and B2 receptor knockout and of kinin receptor antagonists (SSR240612C or FR173657) were assessed in a model of psoriasis induced by imiquimod in C57BL/6 mice. Severity of psoriasis was assessed by histological and immunohistochemical assays of skin, along with objective scores based on the clinical psoriasis area and severity index.

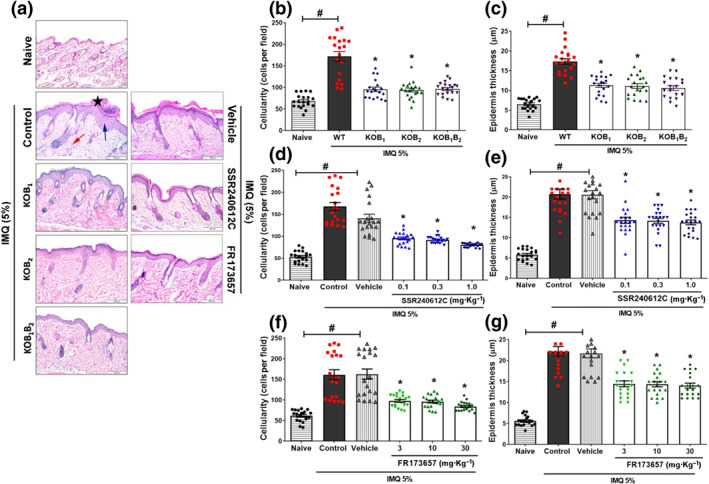
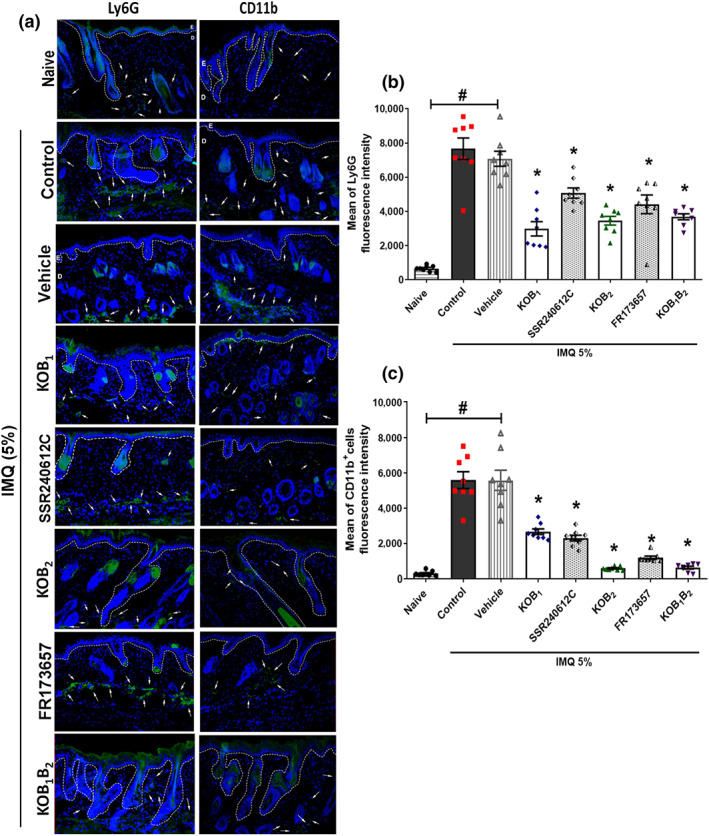
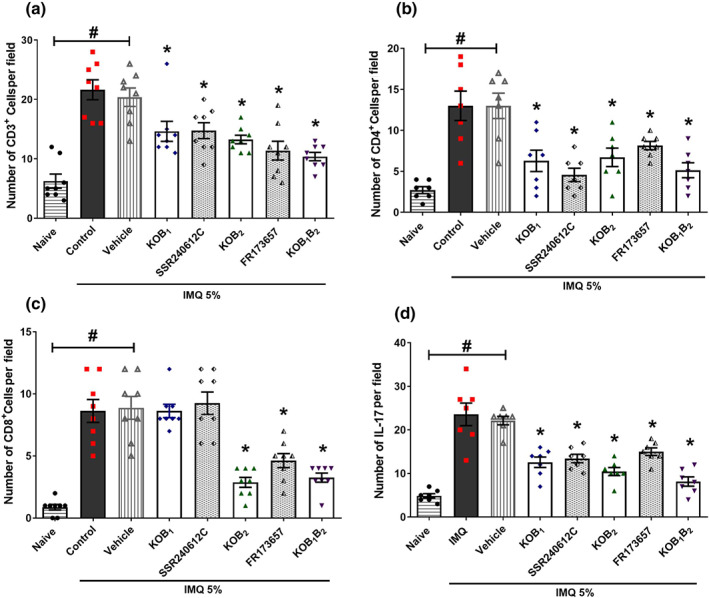
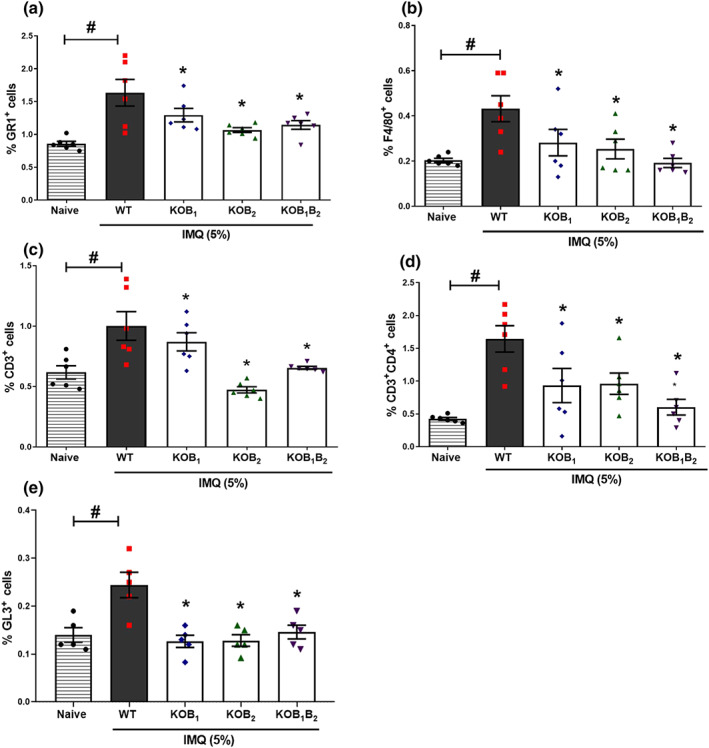
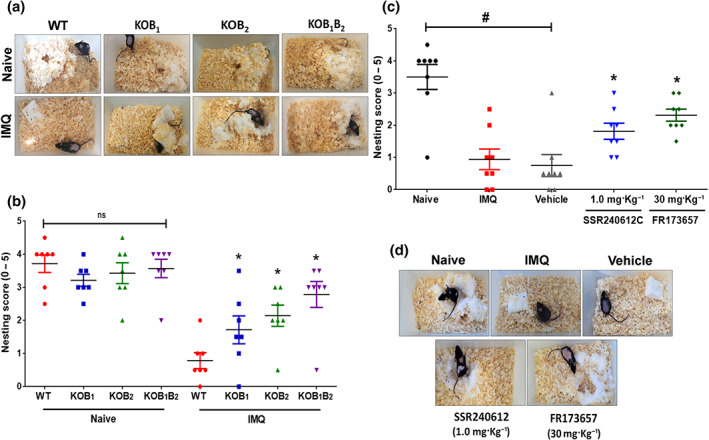
Key results: Both kinin receptors were up-regulated following 6 days of imiquimod treatment. Kinin B1 and B2 receptor deficiency and the use of selective antagonists show morphological and histological improvement of the psoriasis hallmarks. This protective effect was associated with a decrease in undifferentiated and proliferating keratinocytes, decreased cellularity (neutrophils, macrophages, and CD4+ T lymphocytes), reduced γδ T cells, and lower accumulation of IL-17. The lack of B2 receptors resulted in reduced CD8+ T cells in the psoriatic skin. Relevantly, blocking kinin receptors reflected the improvement of psoriasis disease in the well-being behaviour of the mice.

Conclusions and implications: Kinins exerted critical roles in imiquimod-induced psoriasis. Both B1 and B2 kinin receptors exacerbated the disease, influencing keratinocyte proliferation and immunopathology. Antagonists of one or even both kinin receptors might constitute a new strategy for the clinical treatment of psoriasis.


Conflict of interest statement

The authors declare no conflicts of interest.

Figures

FIGURE 1
FIGURE 1
Participation of kinin receptors in the development and progression of imiquimod (IMQ)‐induced psoriasis in mice. (a) Imiquimod was applied daily on the shaved back of wild‐type (WT) and kinin receptor knockout mice (KOB1, KOB2, and KOB1B2) for a total of six applications. (b) Fluorescence microscopy images illustrate the presence of B1 (green) and B2 (red) kinin receptors under physiological skin conditions, as well as in the psoriasis‐like lesions induced by imiquimod treatment. (c) Measurement of the mean fluorescence intensity (MFI), showing the occurrence of both kinin receptors on healthy skin and the higher index of B1 and B2 receptors (B1, B2R) in psoriasiform skin. The MFI was measured from slides of five different animals per group. Data are the mean ± SEM (n = 5). (d) The PASI cumulative score (erythema plus scaling plus thickness) shows the severity of the inflammatory process established in the skin of WT and kinin receptor knockout mice treated with imiquimod for 6 days. The naive group did not receive any treatment. (e) Phenotypical representation of psoriasiform skin lesions in WT and knockout (KOB1, KOB2, and KOB1B2) mice after 6 days of treatment with imiquimod . On Day 6, representative photos of the shaved dorsal skin of the mice were taken. The PASI was blindly assessed at each time point (Days 0 to 7) by four different investigators, and then the scores of each animal was averaged and the comparison between groups was assessed. The values are presented as the mean ± SEM of 20 individual animals per group, from two independent experiments. No outliers were removed from the database. In (c), *P < .05, significantly different from the naïve group; one‐way ANOVA, with the Newmann–Keuls post hoc test. In (d), *P < .05, significantly different from WT mice treated with imiquimod; two‐way ANOVA, with the Newmann–Keuls post hoc test
FIGURE 2
FIGURE 2
SSR240612C and FR173657 treatment protected against psoriasis‐like lesions induced by imiquimod (IMQ). In an attempt to further evaluate the participation of kinin receptors in the imiquimod ‐induced psoriasis model, (a) WT mice were treated daily with SSR240612C (0.1, 0.3, or 1.0 mg·kg−1) or FR173657 (3, 10, or 30 mg·kg−1), 30 min before imiquimod application. (b) Morphological cutaneous features of imiquimod‐induced psoriasis in mice that received SSR240612C or FR173657 on Day 7 of the experimental protocol. (c) Kinin B1 receptor participation in imiquimod‐induced psoriasis was assessed by the PASI cumulative score (erythema plus scaling plus thickening) from animals that received the SSR240612C treatment. (d) PASI cumulative score evaluation in mice that received FR173657 to evaluate kinin B2 receptor participation in the imiquimod‐induced psoriasis model. The naive group did not receive any treatment. The PASI was blindly assessed at each time point (Days 0 to 7) by five different investigators, and then the scores of each animal was averaged and the comparison between groups was assessed. The values are presented as the mean ± SEM of 18 individual animals each from two independent experiments. No outliers were removed from the database. *P < .05, significantly different from vehicle; two‐way ANOVA with the Newmann–Keuls post hoc test
FIGURE 3
FIGURE 3
Contribution of B1 and B2 kinin receptors to the development of the histological hallmark of psoriatic skin lesions induced by imiquimod (IMQ). On Day 7 of the experimental protocol, dorsal skin samples were collected and submitted to histopathological evaluation. (a) Representative images of H&E‐stained sections of psoriatic lesions for each treatment regimen. Analyses showing more pronounced (b) cellularity and (c) epidermis thickness in WT mice than in KOB1, KOB2, and KOB1B2 mice treated with imiquimod. Treatment with SSR240612C reduced (d) the inflammatory cells and the (e) epidermal hyperplasia imiquimod ‐induced. FR173657 treatment promoted lower (f) cellular infiltration and (g) epidermal thickness in imiquimod ‐induced psoriasis‐like skin inflammation model. Skin samples of animals that did not receive treatment (naive) were collected from each of the groups and subjected to the same analysis. The black star indicates hyperkeratosis, while the blue arrow indicates epidermal hyperplasia and the red arrow demonstrates the intense cellular influx induced by treatment with imiquimod . The results are presented as the mean ± SEM of 20 individual animals each from two independent experiments. Cell count and epidermis thickness were determined in seven random fields from three non‐continuous serial sections per mouse, with each symbol representing the average value of an individual mouse. No outliers were removed from the database. *P < .05, significantly different from the WT control group (for knockouts animals) or compared to the vehicle group (for animals treated with antagonists). # P < .05, significantly different from naive group; one‐way ANOVA, followed by the Newman–Keuls post hoc test
FIGURE 4
FIGURE 4
Involvement of B1 and B2 kinin receptors in keratinocyte differentiation and proliferation. Immunohistochemical analysis of mouse skin submitted to 6 days of IMQ treatment. Staining for (a) PCNA or (b) K14 representative images from each group is shown. Quantification of epidermis immuno‐positive cells for (c) PCNA and (d) K14 in WT, KOB1, KOB2, and KOB1B2 mice, as well as mice treated with different doses of (e and g) SSR240612C or (f and h) FR173657 and submitted to the imiquimod ‐induced psoriasis model. The values are presented as the mean ± SEM of 20 individual animals each from two independent experiments. The number of immunostained brown cells was quantified at the epidermis from four non‐continuous serial sections per mouse, with each symbol representing the average value from an individual mouse. No outliers were removed from the database. *P < .05, significantly different from the WT control group (for knockout animals) or compared to the vehicle group (when treated with the antagonists); # P < .05, significantly different from naive and WT imiquimod ‐treated mice or between naive and vehicle‐treated mice; one‐way ANOVA, followed by the Newman–Keuls post hoc test
FIGURE 5
FIGURE 5
Contribution of B1 and B2 kinin receptors to the Ly6G+ and CD11b+ response induced by 6 days of imiquimod (IMQ) treatment. Mouse dorsal skin samples were collected and submitted to immunofluorescence assay on Day 7 of imiquimod ‐induced psoriasis model. Psoriatic lesions from WT, knockout (KOB1, KOB2, and KOB1B2) mice, and WT mice treated with SSR240612C (1.0 mg·kg−1, i.p.) or FR173657 (30 mg·kg−1, i.p.) were submitted to immunofluorescence analysis. (a) One representative picture is shown for each experimental group. The mean fluorescence intensity (MFI) of (b) Ly6G+ and (c) CD11b+ immunostaining cells in psoriatic skin. Naive (untreated group) samples were collected and subjected to the same analysis. The white dotted lines indicate the basal membrane. The white arrows indicate some of the positively immunolabelled cells. Data are reported as mean ± SEM of eight individual animals per group. The MFI was analysed from three non‐consecutive serial sections per mouse, each symbol representing the average value from an individual mouse. No outliers were removed from the database. *P < .05, significantly different from the WT control group (for knockout mice) or from the vehicle group (for animals treated with antagonists); # P < .05 significantly different from naive and WT imiquimod ‐treated mice or between naive and vehicle‐treated mice; one‐way ANOVA, followed by the Newman–Keuls post hoc test
FIGURE 6
FIGURE 6
Relevance of B1 and B2 kinin receptors to the immune response induced by imiquimod (IMQ). On Day 7 of the experimental protocol, dorsal skin samples from mice were collected and examined by immunofluorescence assay. Representative images immunostained for CD3+, CD4+, CD8+, and IL‐17 in the psoriatic lesions induced by imiquimod in WT mice, knockout mice (KOB1, KOB2, and KOB1B2), and WT mice treated with vehicle (DMSO 0.03%, v/v), SSR240612C (1.0 mg·kg−1), or FR173657 (30 mg·kg−1). Naive (untreated group) samples were collected and subjected to the same analysis. Kinin‐B1 and B2 receptors were evaluated in three non‐consecutive serial sections from five mice each. The white dotted lines indicate the basal membrane. The white arrows indicate some of the positively immunolabelled cells
FIGURE 7
FIGURE 7
Analysis of kinin receptor participation in the immune response triggered by imiquimod (IMQ) in the skin. The number of (a) CD3+‐, (b) CD4+‐, and (c) CD8+‐positive cells was evaluated in the psoriatic lesion of imiquimod‐treated mice. (d) IL‐17 was also detected in the imiquimod‐induced, psoriatic skin of knockout and WT mice treated with the antagonists. Data are means ± SEM of eight (CD3+ T lymphocyte), seven (CD4+ T cell), eight (CD8+ T cells), and seven (IL‐17) individual animals each from two separate experiments. Positively immunolabelled cells were quantitated by counting fluorescent dots from three non‐consecutive serial sections per mouse. Symbols represent values for individual mouse and bars represent mean values for each group. No outliers were removed from the database. *P < .05, significantly different from the WT control group (for knockouts animals) or from the vehicle group (for animals treated with antagonists); # P < .05 between naive and WT imiquimod‐treated mice or between naive and vehicle‐treated mice; one‐way ANOVA with the Newman–Keuls post hoc test
FIGURE 8
FIGURE 8
Analysis of the immune cell subset phenotype in the skin of mice lacking kinin receptors submitted to the IMQ‐induced psoriasis model. The number of (a) GR1+‐, (b) F4/80+‐, (c) CD3+‐, and (d) CD4+‐positive cells was quantified by flow cytometry in psoriatic skin lesion of WT and kinin receptor knockout mice treated daily with imiquimod for 6 days. Using FACSCanto™ flow cytometry, 500.000 events were acquired, and the results expressed in percentage. The values are presented as the mean ± SEM of six individual animals per group. (e) The percentage of GL3+‐positive cells in dorsal skin of WT and KO mice, data are means ± SEM of five individual animals per group. Symbols represent values for individual mouse and bars represent mean values for each group. No outliers were removed from the database. *P < .05, significantly different from the WT control group; # P < .05, significantly different from naive and WT imiquimod‐treated mice; one‐way ANOVA with the Newman–Keuls post hoc test
FIGURE 9
FIGURE 9
Well‐being evaluation of mice treated with imiquimod (IMQ). Mice behaviour of nest building was used as an indicator of animal well‐being in psoriasis‐like skin disease. (a) Representative images of nests built by WT and knockout (KOB1, KOB2, and KOB1B2) mice treated with imiquimod for 6 days, as well as their respective naive group (healthy mice). (b) Nest building score. Data are means ± SEM of seven individual animals per group. (c) Illustrative picture of nests built by WT mice treated with SSR240612C (0.1 mg·kg−1), FR173657 (30 mg·kg−1), or vehicle (DMSO, 0.03%, v/v) and submitted to the imiquimod‐induced psoriasis model. (d) Nesting scores. The results are presented as the mean ± SEM of eight individual animals per group. Symbols represent values for individual mouse for each group. No outliers were removed from the database. *P < .05, significantly different from (in b) imiquimod‐treated WT mice or (in c) the vehicle group; # P < .05 between naive and WT imiquimod‐treated mice or between naive and vehicle‐treated mice; one‐way ANOVA with the Newman–Keuls post hoc test

References

    1. Alexander, S. P. H. , Christopoulos, A. , Davenport, A. P. , Kelly, E. , Mathie, A. , Peters, J. A. , … CGTP Collaborators . (2019). THE CONCISE GUIDE TO PHARMACOLOGY 2019/20: G protein‐coupled receptors. British Journal of Pharmacology, 176, S21–S141. 10.1111/bph.14748 - DOI - PMC - PubMed
    1. Alexander, S. P. H. , Fabbro, D. , Kelly, E. , Mathie, A. , Peters, J. A. , Veale, E. L. , … CGTP Collaborators . (2019). THE CONCISE GUIDE TO PHARMACOLOGY 2019/20: Enzymes. British Journal of Pharmacology, 176, S297–S396. 10.1111/bph.14752 - DOI - PMC - PubMed
    1. Alexander, S. P. H. , Roberts, R. E. , Broughton, B. R. S. , Sobey, C. G. , George, C. H. , Stanford, S. C. , … Ahluwalia, A. (2018). Goals and practicalities of immunoblotting and immunohistochemistry: A guide for submission to the British Journal of Pharmacology . British Journal of Pharmacology, 175, 407–411. 10.1111/bph.14112 - DOI - PMC - PubMed
    1. Aliberti, J. , Viola, J. P. B. , Vieira‐de‐Abreu, A. , Bozza, P. T. , Sher, A. , & Schartstein, J. (2003). Cutting edge: Bradykinin induces IL‐12 production by dendritic cells: A danger signal that drives Th1 polarization. The Journal of Immunology, 170(11), 5349–5353. 10.4049/jimmunol.170.11.5349 - DOI - PubMed
    1. Arora, N. , Shah, K. , & Pandey‐Rai, S. (2016). Inhibition of imiquimod‐induced psoriasis‐like dermatitis in mice by herbal extracts from some Indian medicinal plants. Protoplasma, 253(2), 503–515. 10.1007/s00709-015-0829-y - DOI - PubMed

Publication types