. 2020 Jun;14(6):1185-1206.
doi: 10.1002/1878-0261.12696. Epub 2020 May 13.

Deciphering MET-dependent modulation of global cellular responses to DNA damage by quantitative phosphoproteomics

Affiliations

Deciphering MET-dependent modulation of global cellular responses to DNA damage by quantitative phosphoproteomics

Ariel Bensimon et al. Mol Oncol. 2020 Jun.

Abstract

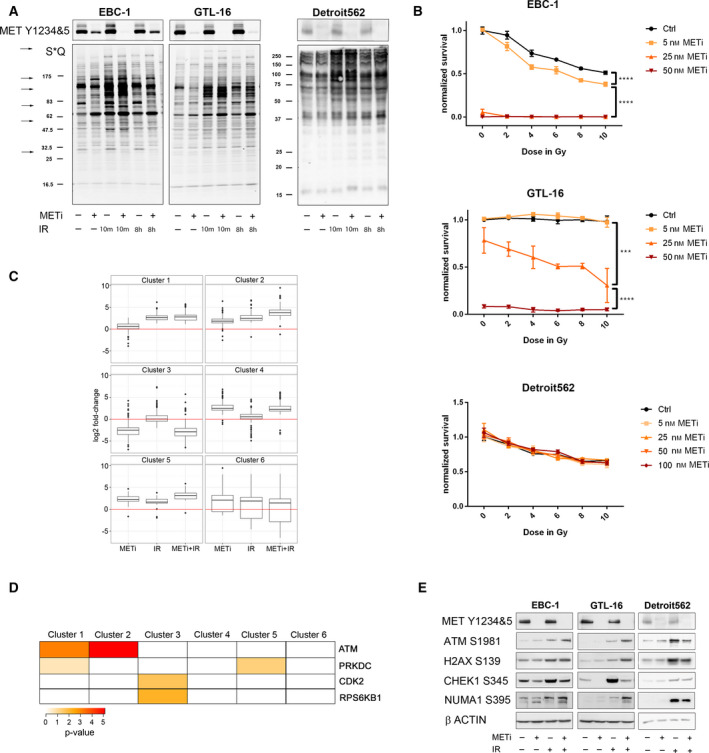
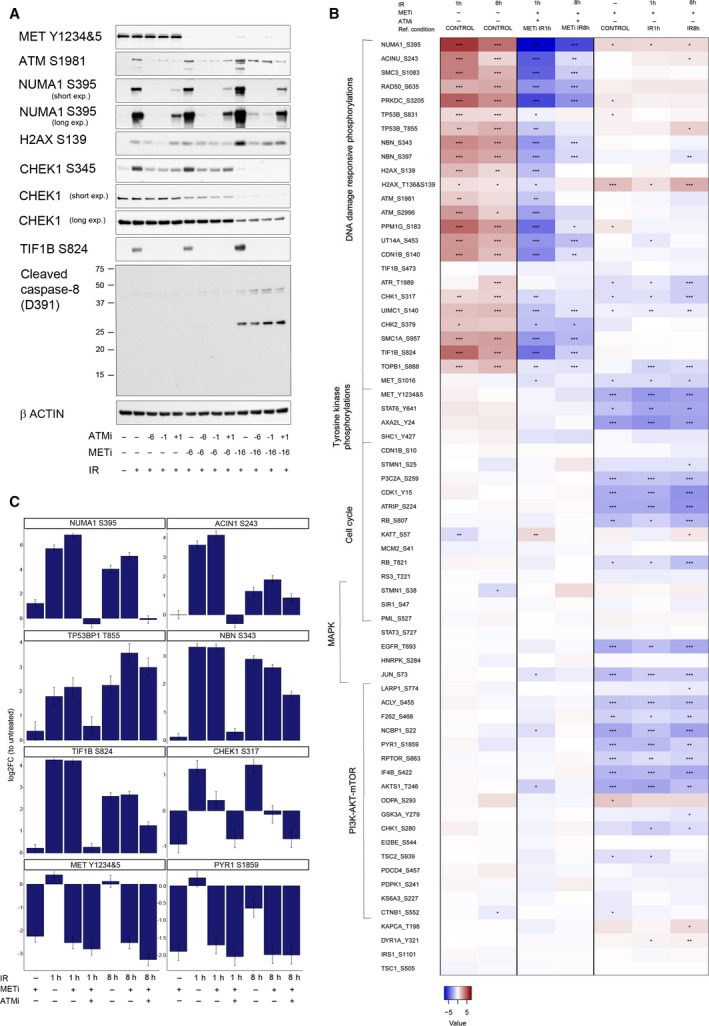
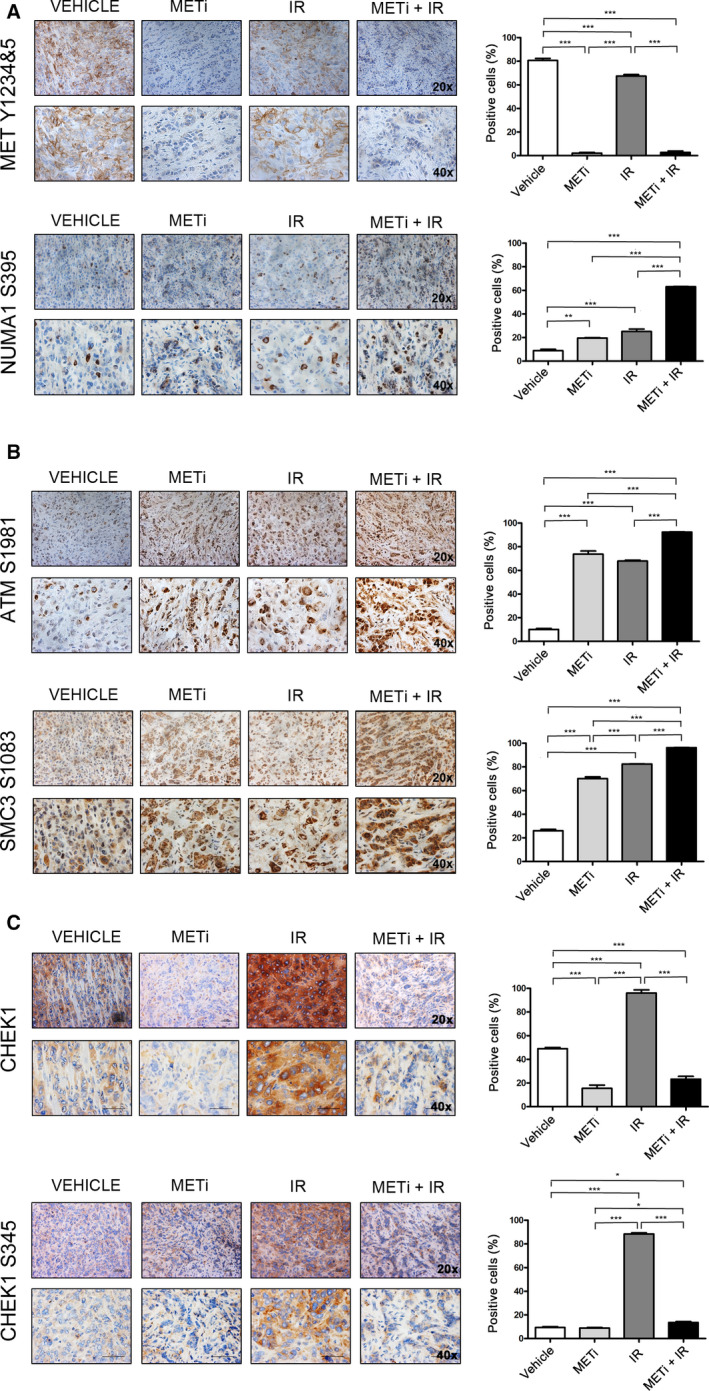
Increasing evidence suggests that interference with growth factor receptor tyrosine kinase (RTK) signaling can affect DNA damage response (DDR) networks, with a consequent impact on cellular responses to DNA-damaging agents widely used in cancer treatment. In that respect, the MET RTK is deregulated in abundance and/or activity in a variety of human tumors. Using two proteomic techniques, we explored how disrupting MET signaling modulates global cellular phosphorylation response to ionizing radiation (IR). Following an immunoaffinity-based phosphoproteomic discovery survey, we selected candidate phosphorylation sites for extensive characterization by targeted proteomics focusing on phosphorylation sites in both signaling networks. Several substrates of the DDR were confirmed to be modulated by sequential MET inhibition and IR, or MET inhibition alone. Upon combined treatment, for two substrates, NUMA1 S395 and CHEK1 S345, the gain and loss of phosphorylation, respectively, were recapitulated using invivo tumor models by immunohistochemistry, with possible utility in future translational research. Overall, we have corroborated phosphorylation sites at the intersection between MET and the DDR signaling networks, and suggest that these represent a class of proteins at the interface between oncogene-driven proliferation and genomic stability.

Keywords: ATM; DNA damage response; MET; ionizing radiation; mass spectrometry; receptor tyrosine kinase.


Conflict of interest statement

A. Blaukat is listed as a co‐inventor on all patents related to Merck's c‐Met inhibitor listed in this manuscript. No potential conflicts of interest were disclosed by the other authors.

Figures

Fig. 1
Fig. 1
Immunoaffinity‐based phosphoproteomics identified phosphoproteins modulated by METi and IR. (A) Modulation of S*Q phosphorylation motif‐containing substrates (* denotes S phosphorylation) upon METi (EMD1214063, at a final concentration of 50nm, 16h prior to IR), IR (at a single dose of 10Gy), or their combination at 10min or 8h post‐IR. Arrows point at examples of prominent phosphorylation changes. MET autophosphorylation was blotted separately as a control for MET inhibition. (B) Survival curves for EBC‐1, GTL‐16, and Detroit 562, upon single IR doses alone and in combination with METi, based on the crystal violet staining assay (n=3; ±SD). Statistical significance was calculated with the graphpad prism Software using a two‐way ANOVA test (*P<0.05; **P<0.01; ***P<0.001; ****P<0.0001). (C) Five hundred fifty‐three phosphopeptides, identified in the PTMScan dataset as regulated by METi‐ and/or IR, were clustered based on their quantitative changes across conditions (n=1; Log2FC). (D) Association of the significant predicted putative kinases with the identified clusters. (E) Selected DDR phosphorylation sites are differentially impacted by METi in MET‐overexpressing cancer cell lines. Cells were treated with METi (for 24h), IR, or their combination (METi added 16h prior IR), lysed 8h post‐IR, and analyzed using antibodies against selected phosphorylation sites based on our dataset.
Fig. 2
Fig. 2
METi‐ and IR‐related phosphorylations validated by targeted proteomics. (A) Phosphorylation sites selected for analysis by targeted proteomics. Phosphorylation sites identified in discovery screen (orange squares), phosphorylation sites on proteins identified in the discovery screen (yellow squares), and phosphorylation sites selected from literature (green squares) are linked to their known (full edges) or predicted (dashed edges) kinases. (B) METi‐based modulation of cellular DDR monitored by SRM. Assays were monitored in samples treated with METi, IR, or combination of both. Here are presented the results from statistical comparisons addressing two questions: Which are the significant changes in response to IR alone, compared with control; which are the significant changes in response to the combination of METi and IR, compared with IR alone. Log2FC (n = 3) is represented by a color code; adjusted P‐values by symbol: <0.0005, ‘***’; <0.005, ‘**’; <0.05, ‘*’. (C) Log2FC with standard error bars per condition is presented for selected phosphorylations in comparison with control sample (untreated) within each cell line (n = 3). Note the significant difference between IR alone and the combination for NUMA1 S395, ACIN1 S243 in selected time points and cell lines, as opposed to NBN S343.
Fig. 3
Fig. 3
METi‐induced modulation of selected phosphorylations is time‐dependent and partially ATM‐dependent. (A) Impact of METi pretreatment duration (6 or 16 h prior to IR) and ATM activity (ATM was inhibited 6 or 1 h prior or 1 h post‐IR) on phosphorylation of MET, ATM, NUMA1, H2AX, CHEK1, and TIF1B, on cleavage of caspase‐8 and on CHEK1 protein levels. Cells were harvested 2 h post‐IR, and β‐actin was used as a loading control. (B) METi‐ and ATMi‐based modulation of cellular phosphorylations measured by SRM in EBC‐1 cells. Listed assays have been monitored in samples treated with ATMi, METi, IR, or the combinations (METi + IR; ATMi + METi + IR). Here are presented the results from statistical comparisons addressing three questions: Which are the significant changes in response to IR alone, compared with control (left); which are the significant changes in response to the combination METi + IR, compared with IR alone (right); and which are the significant changes in response to the combination ATMi + METi + IR, compared with METi + IR (middle). Log2FC (n = 3) is represented by a color code; adjusted P‐values by symbol: <0.0005, ‘***’, <0.005, ‘**’, <0.05, ‘*’. (C) Log2FC per condition is presented in comparison with control sample (untreated) for selected phosphorylation events in EBC‐1 cells upon IR (1 or 8 h) with or without METi and/or ATMi pretreatment as compared to untreated condition (n = 3).
Fig. 4
Fig. 4
The relationship between METi and DNA damage‐related phosphorylations in vivo. IHC assessment in a xenograft tumor model of EBC‐1 cells. Animals were treated by oral administration of METi (15 mg·kg−1·day−1 for six consecutive days), local irradiation [a single dose (6 Gy) on day 3], or the combination of these two modalities. Following these treatments, the levels of mentioned proteins or phosphorylations sites were assessed in tumor tissues. Representative images (left panel) and quantification [% of positively stained area; mean (n = 3) ± SEM; right panel] of (A) MET Y1234&5, NUMA1 S395, (B) ATM S1981, SMC3 S1083, and (C) CHEK1 and CHEK1 S345 in EBC‐1 subcutaneous xenografts following IR, METi, or their combination. Statistical analysis was performed with the GraphPad Prism Software using one‐way ANOVA test (*P < 0.05; **P < 0.01; ***P < 0.001).

Similar articles

Cited by

References

    1. Al‐Ejeh F, Kumar R, Wiegmans A, Lakhani SR, Brown MP and Khanna KK (2010) Harnessing the complexity of DNA‐damage response pathways to improve cancer treatment outcomes. Oncogene 29, 6085–6098. - PubMed
    1. Balaji K, Vijayaraghavan S, Diao L, Tong P, Fan Y, Carey JP, Bui TN, Warner S, Heymach JV, Hunt KK et al (2017) AXL inhibition suppresses the DNA damage response and sensitizes cells to PARP inhibition in multiple cancers. Mol Cancer Res 15, 45–58. - PMC - PubMed
    1. Baschnagel AM, Williams L, Hanna A, Chen PY, Krauss DJ, Pruetz BL, Akervall J and Wilson GD (2014) c‐Met expression is a marker of poor prognosis in patients with locally advanced head and neck squamous cell carcinoma treated with chemoradiation. Int J Radiat Oncol Biol Phys 88, 701–707. - PubMed
    1. Beli P, Lukashchuk N, Wagner SA, Weinert BT, Olsen JV, Baskcomb L, Mann M, Jackson SP and Choudhary C (2012) Proteomic investigations reveal a role for RNA processing factor THRAP3 in the DNA damage response. Mol Cell 46, 212–225. - PMC - PubMed
    1. Benjamini Y and Hochberg Y (1995) Controlling the false discovery rate ‐ a practical and powerful approach to multiple testing. J Roy Stat Soc B Met 57, 289–300.

Publication types

MeSH terms