. 2020 Jul 17;127(3):335-353.
doi: 10.1161/CIRCRESAHA.119.316461. Epub 2020 Apr 27.

Regulatory T Cells License Macrophage Pro-Resolving Functions During Atherosclerosis Regression

Affiliations

Regulatory T Cells License Macrophage Pro-Resolving Functions During Atherosclerosis Regression

Monika Sharma et al. Circ Res. .

Abstract

Rationale: Regression of atherosclerosis is an important clinical goal; however, the pathways that mediate the resolution of atherosclerotic inflammation and reversal of plaques are poorly understood. Regulatory T cells (Tregs) have been shown to be atheroprotective, yet the numbers of these immunosuppressive cells decrease with disease progression, and whether they contribute to atherosclerosis regression is not known.

Objective: We investigated the roles of Tregs in the resolution of atherosclerotic inflammation, tissue remodeling, and plaque contraction during atherosclerosis regression.

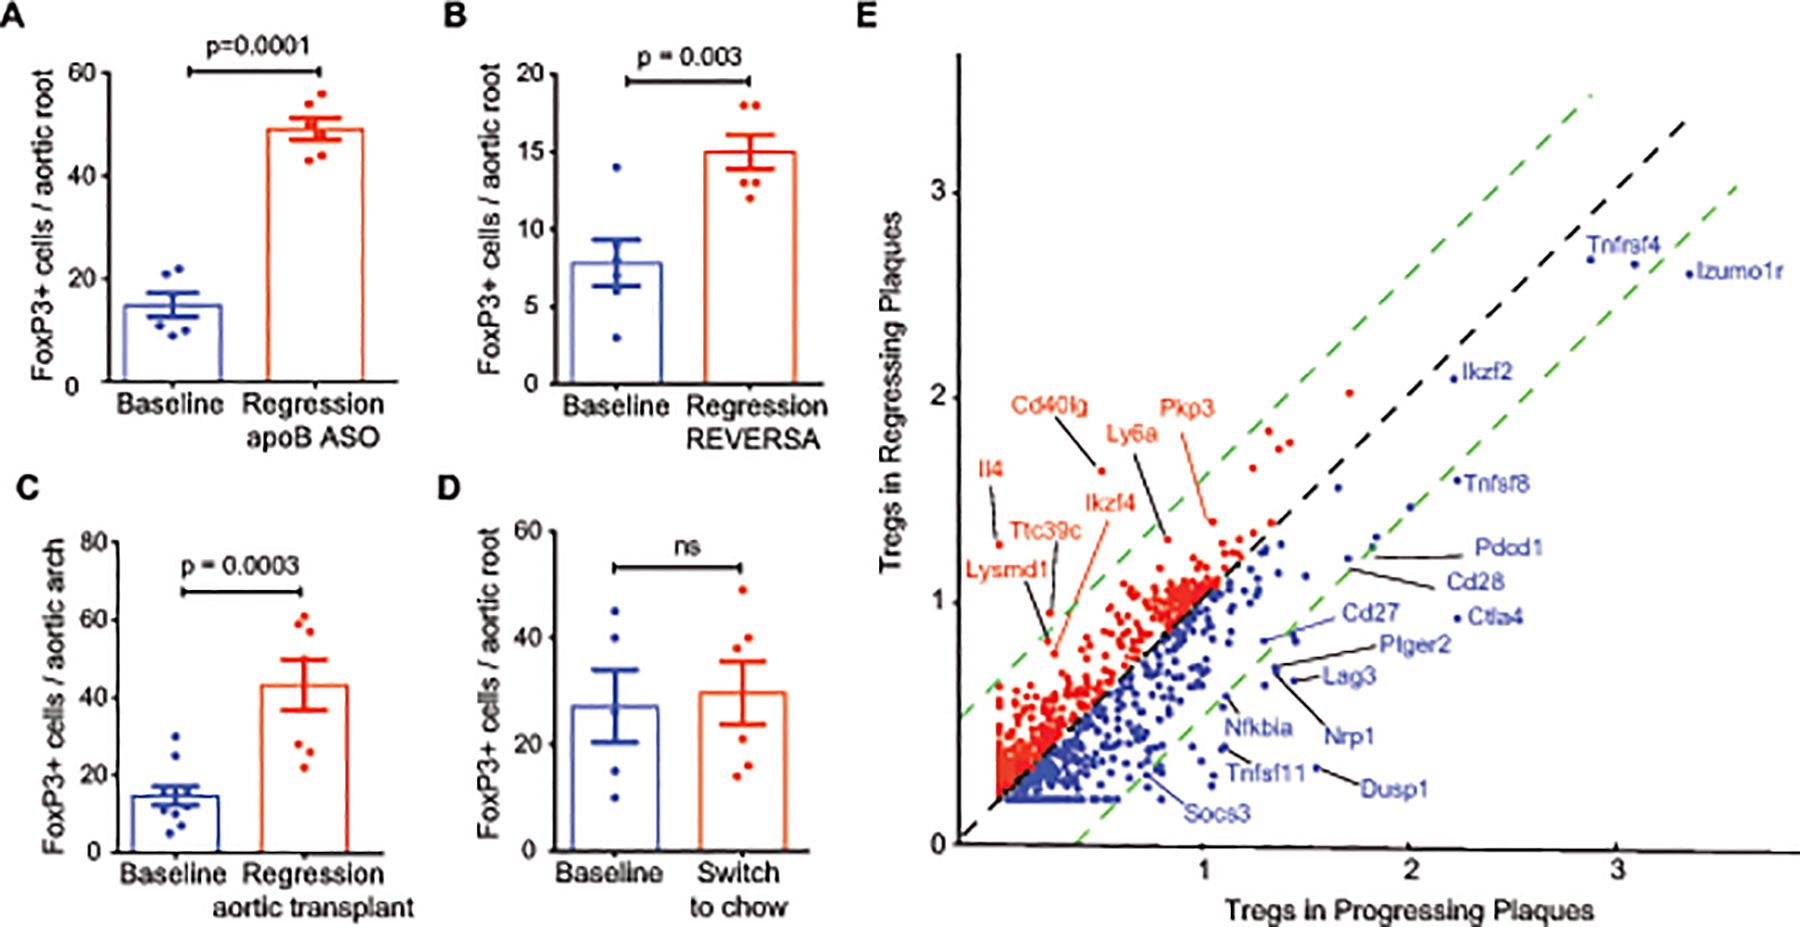
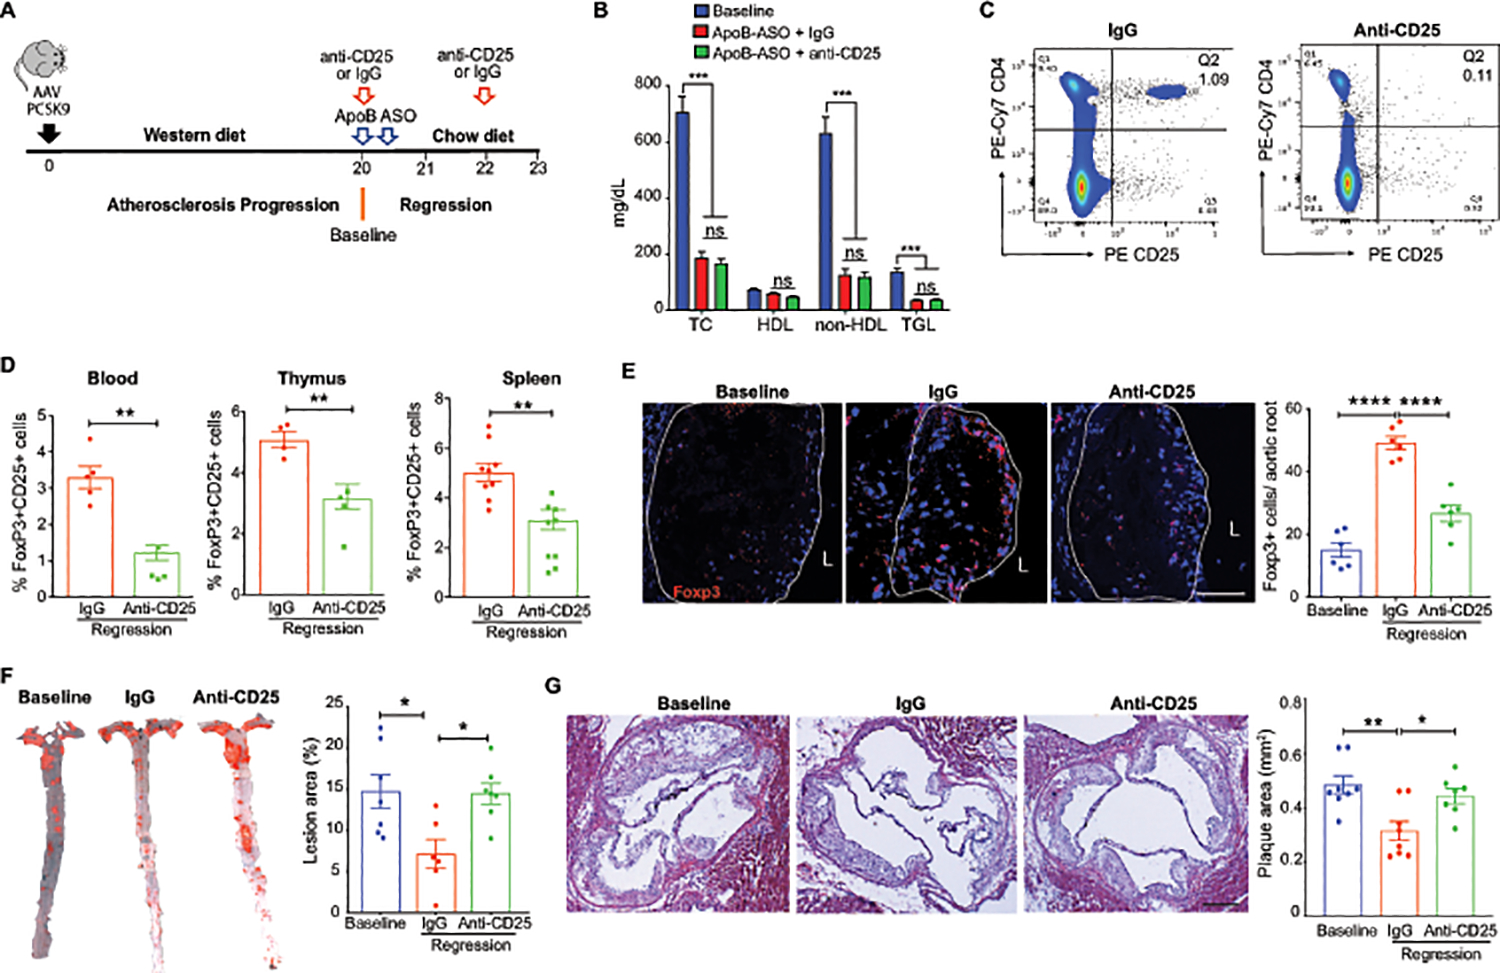
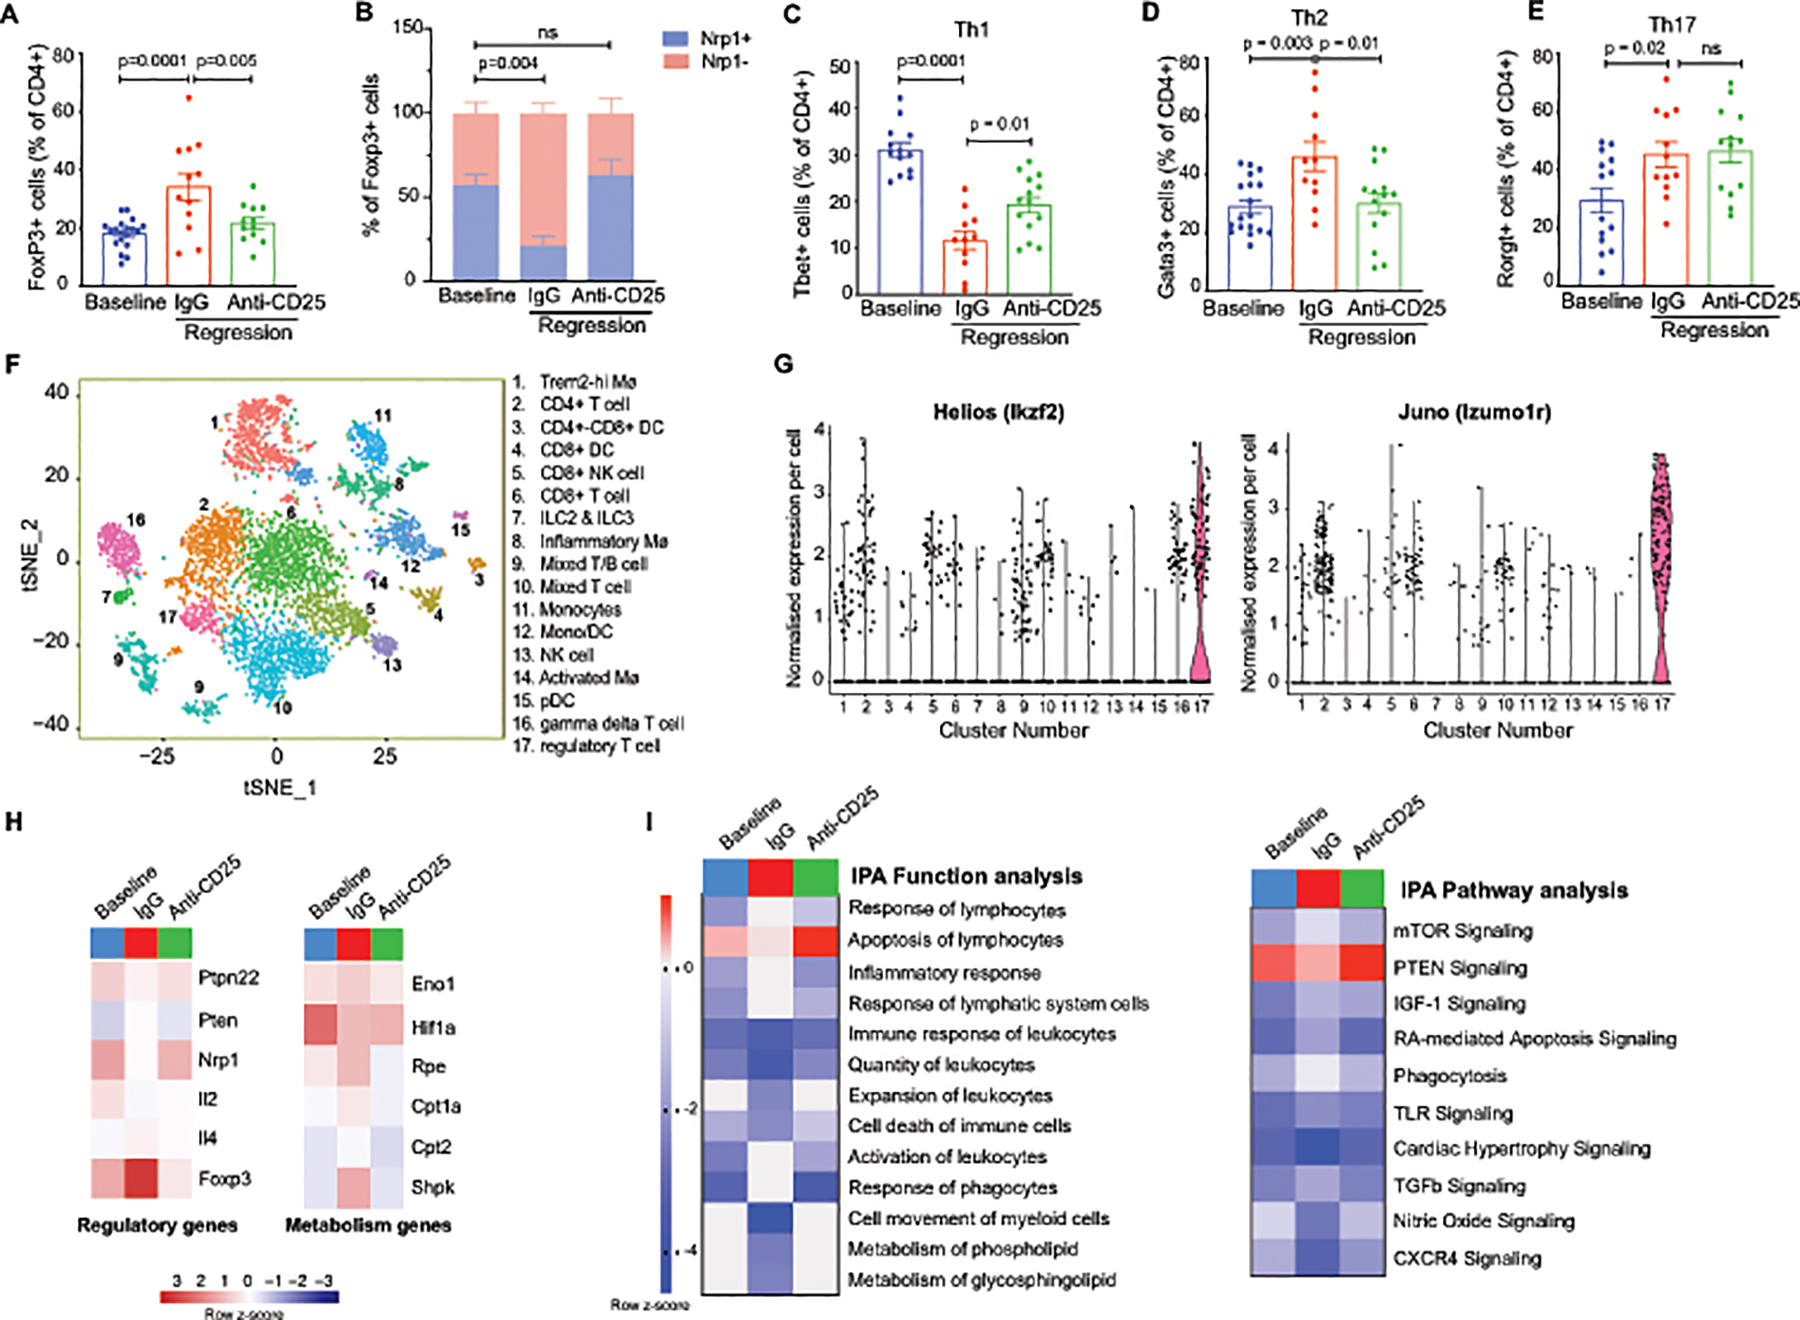
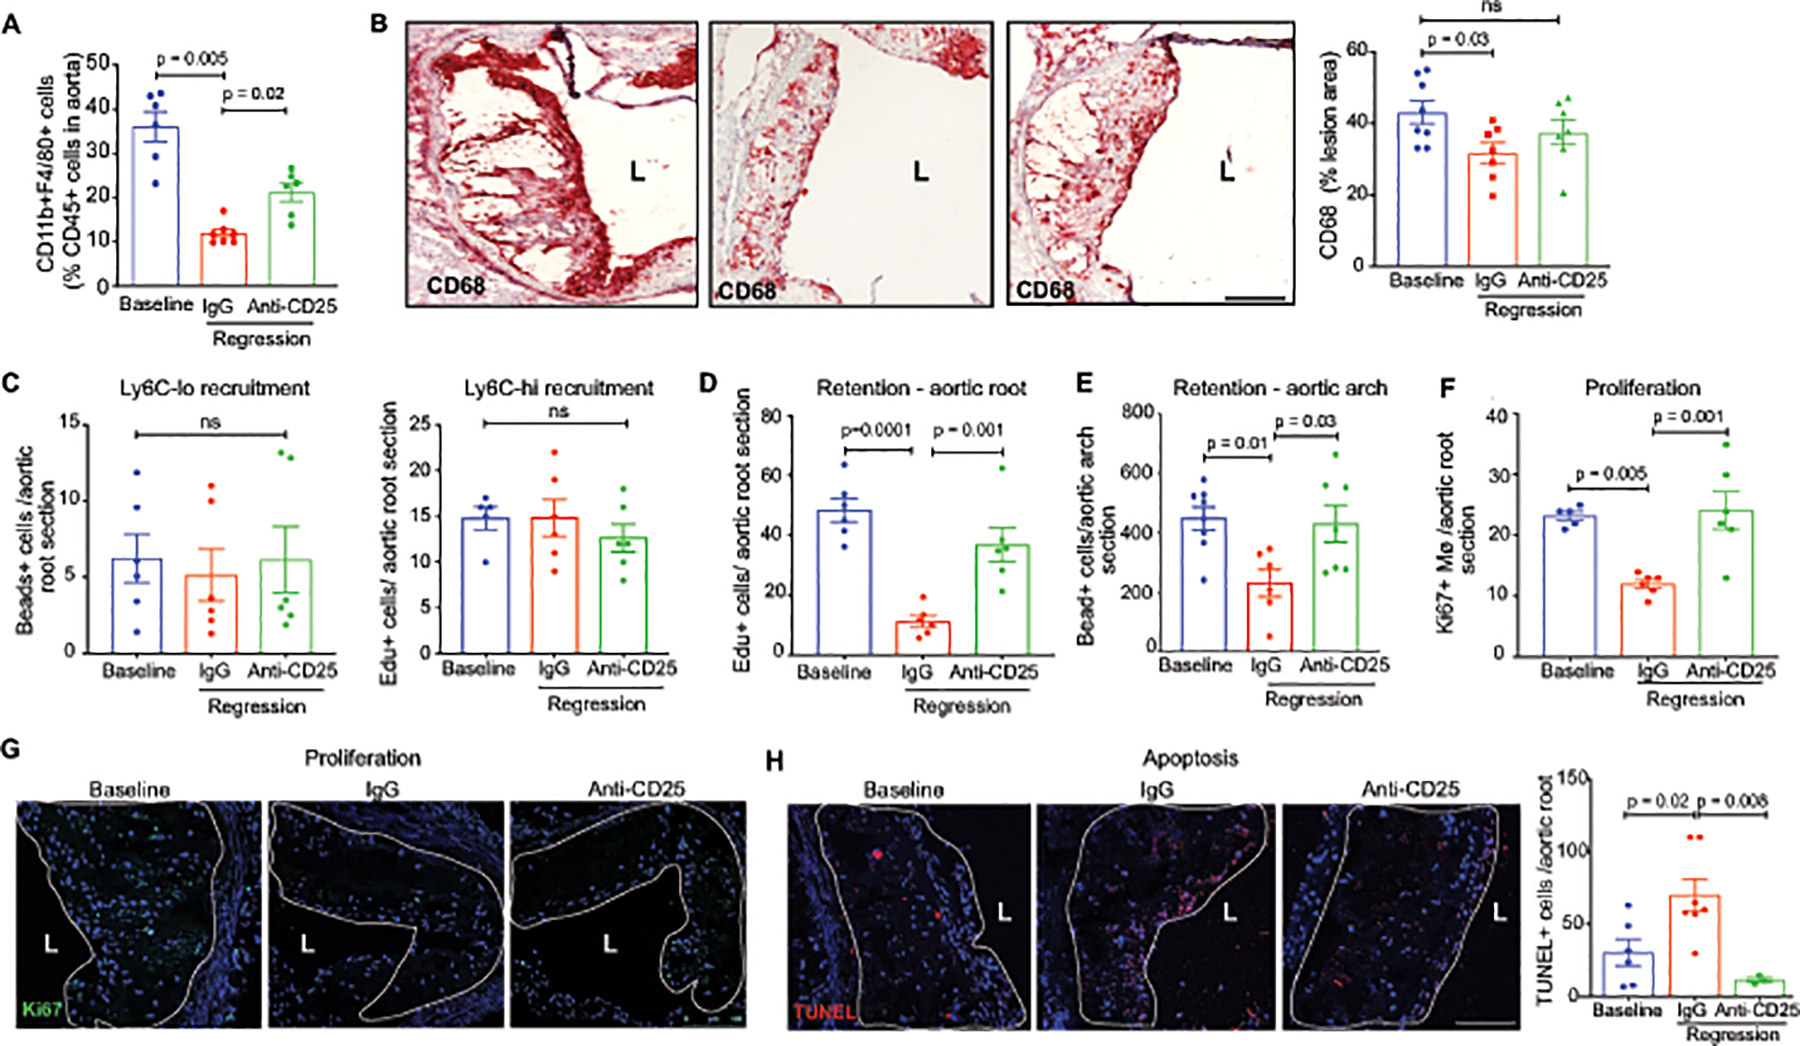
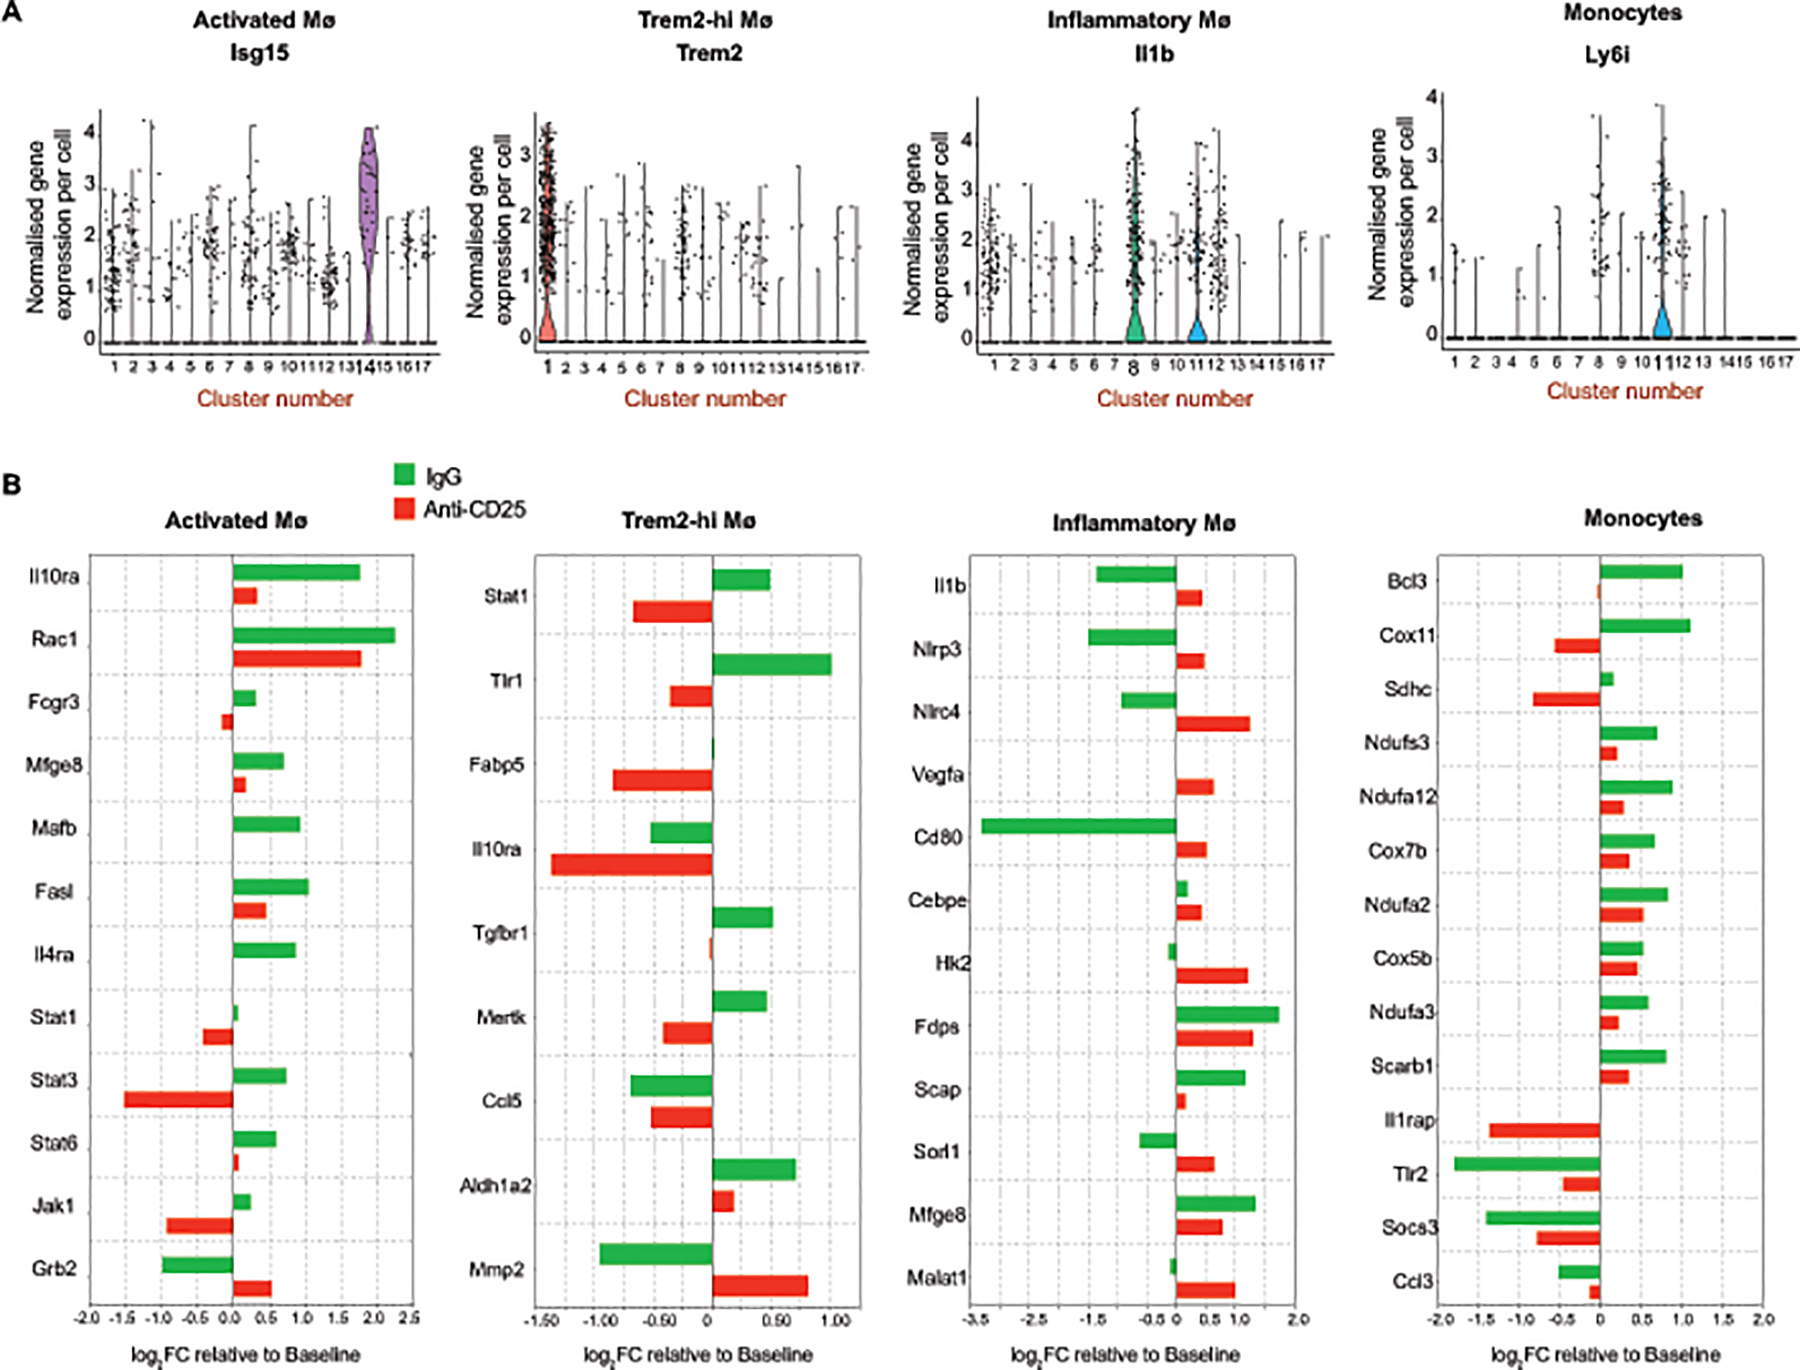
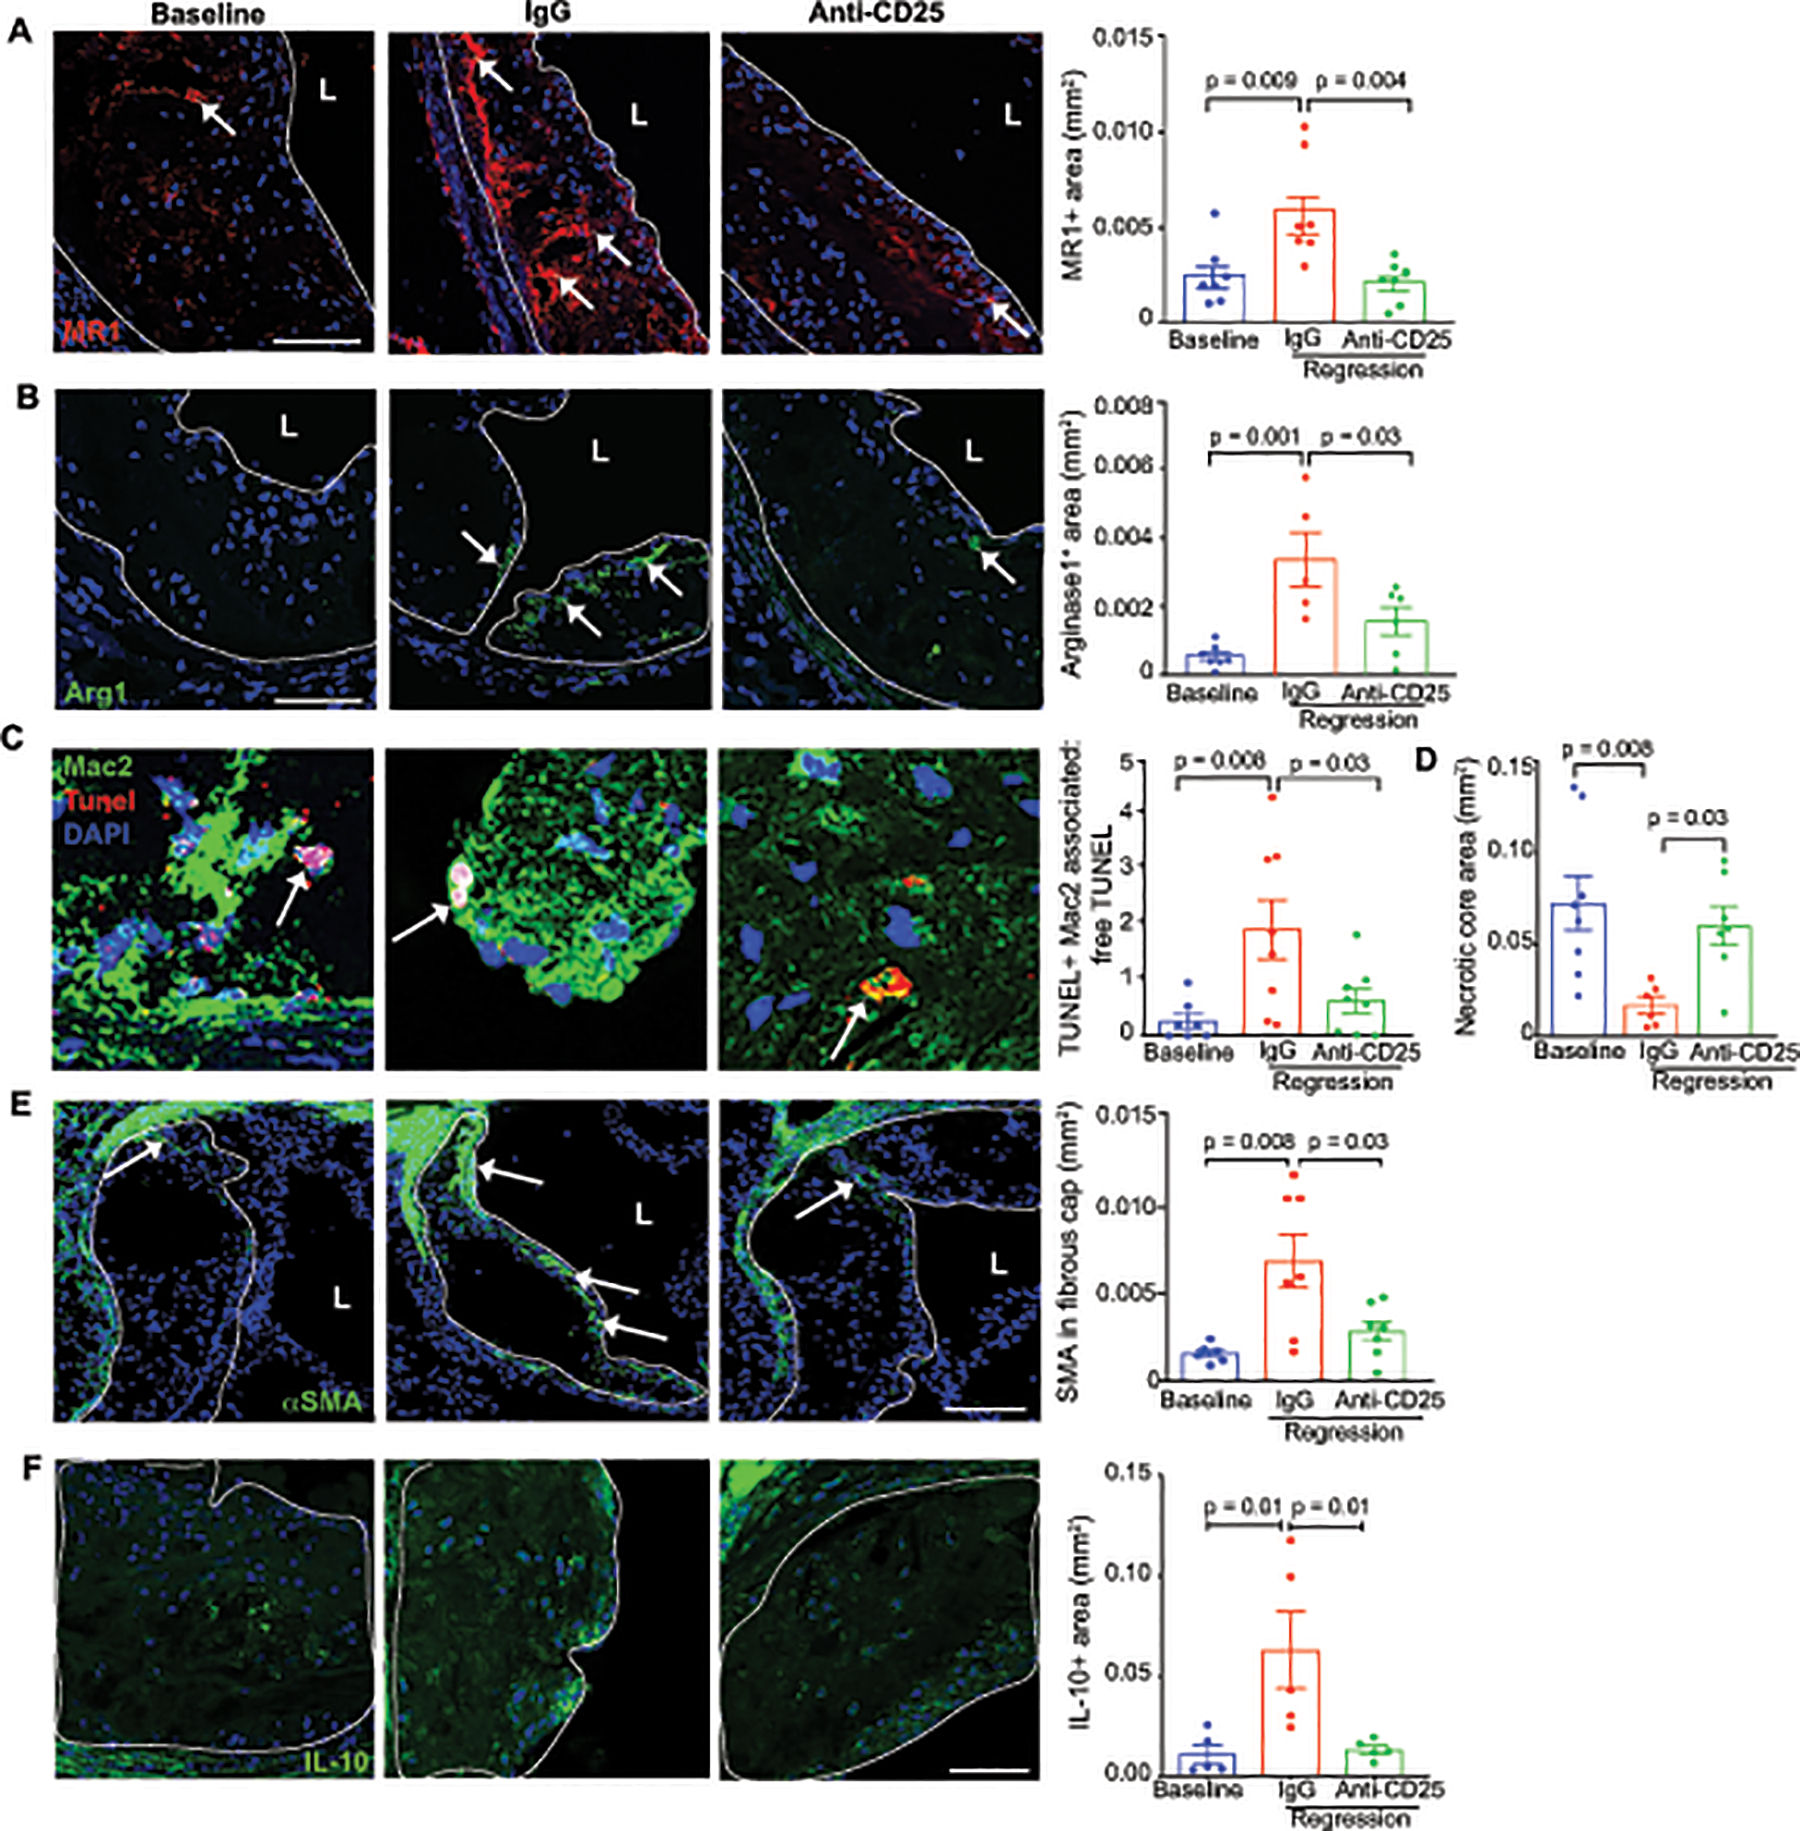
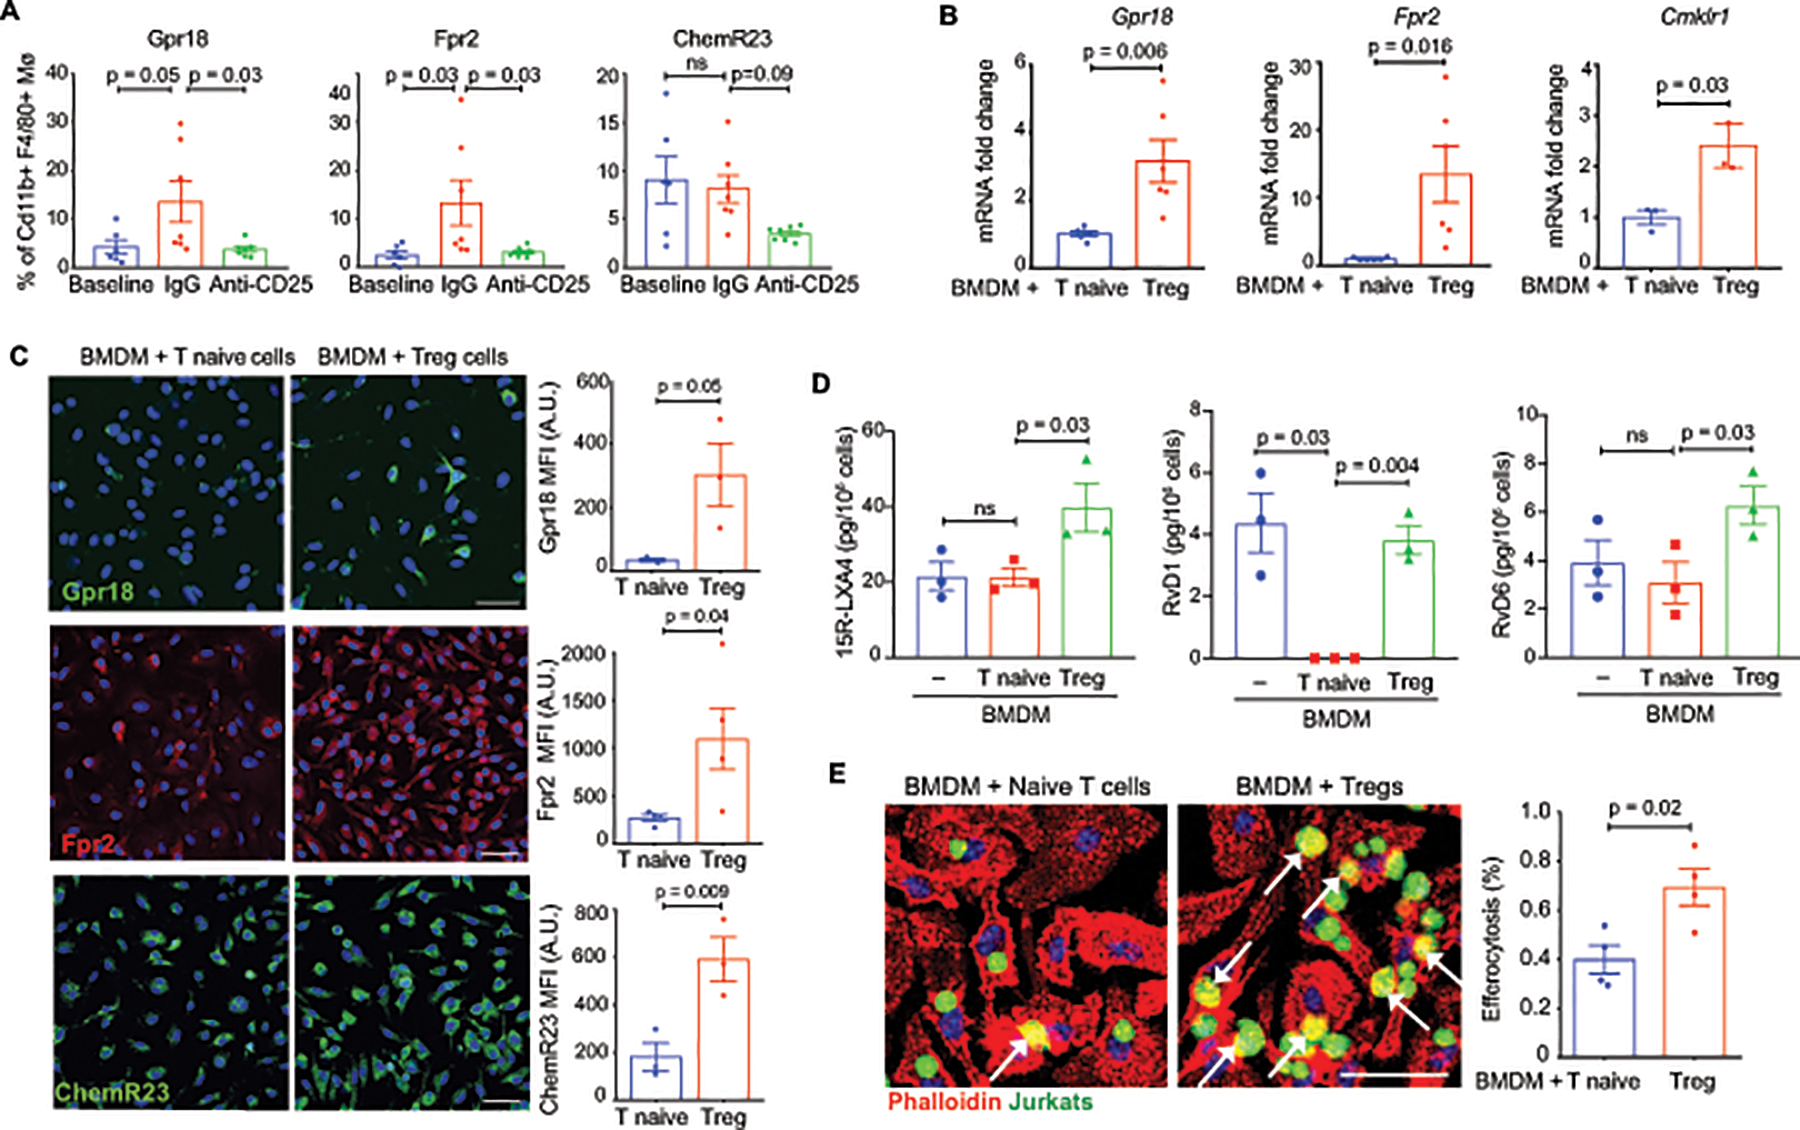
Methods and results: Using multiple independent mouse models of atherosclerosis regression, we demonstrate that an increase in plaque Tregs is a common signature of regressing plaques. Single-cell RNA-sequencing of plaque immune cells revealed that unlike Tregs from progressing plaques that expressed markers of natural Tregs derived from the thymus, Tregs in regressing plaques lacked Nrp1 expression, suggesting that they are induced in the periphery during lipid-lowering therapy. To test whether Tregs are required for resolution of atherosclerotic inflammation and plaque regression, Tregs were depleted using CD25 monoclonal antibody in atherosclerotic mice during apolipoprotein B antisense oligonucleotide-mediated lipid lowering. Morphometric analyses revealed that Treg depletion blocked plaque remodeling and contraction, and impaired hallmarks of inflammation resolution, including dampening of the T helper 1 response, alternative activation of macrophages, efferocytosis, and upregulation of specialized proresolving lipid mediators.

Conclusions: Our data establish essential roles for Tregs in resolving atherosclerotic cardiovascular disease and provide mechanistic insight into the pathways governing plaque remodeling and regression of disease.

Keywords: atherosclerosis; cardiovascular disease; immunity; inflammation; macrophages.


Figures

Figure 1.
Figure 1.. Tregs are expanded in regressing atherosclerotic plaques and exhibit a gene signature distinct from Tregs in progressing plaques.
A-D) Quantification of Foxp3 immunostaining in cross-sections of the A) aortic root of atherosclerotic C57BL6/J mice at baseline [AAV-PCSK9 and western diet (WD) for 20 weeks] and 3 weeks after lipid lowering using apoB-ASO (regression) (n=6 mice/group), B) aortic root of atherosclerotic REVERSA mice at baseline (16 weeks WD) and 4 weeks after lipid lowering by MTP deletion (regression) (n=6 mice/group), C) aortic arch of atherosclerotic Apoe–/– mice at baseline (16 weeks WD; n= 10) and 3 weeks after transplant into normolipidemic C57BL6/J (regression; n=7), D) aortic root of atherosclerotic C57BL6/J mice at baseline (AAV-PCSK9 and WD for 20 weeks; n=5) and 3 weeks after switching mice to chow diet to halt plaque progression (n=6). E) Scatter plot of scaled average gene expression values for the 1,327 most variable genes in the Treg clusters from aortas of mice (n=4 mice pooled per group) undergoing atherosclerosis progression using PCSK9-AAV + WD 20 wk (blue, x-axis) or after 3 weeks of regression (red, y-axis) induced by ApoB-ASO treatment. Green dotted lines indicate 1.5-fold change in expression. Genes of interest due to change in expression or known biology are labelled. Data in (A-D) are the mean ± s.e.m. P values were determined by an unpaired Student’s t-test (A-D).
Figure 2.
Figure 2.. Treg depletion abrogates atherosclerosis regression.
A) Experimental design: Atherosclerosis was established in C57BL6/J mice by injection of AAV-PCSK9 followed by western diet feeding for 20 weeks (Baseline). Mice were then switched to chow diet and atherosclerosis regression was initiated by apoB-ASO-mediated lipid lowering in conjunction with anti-CD25 or IgG isotype control antibody treatment for 3 weeks. B) Plasma total cholesterol, HDL and non-HDL cholesterol and triglyceride levels at baseline and after regression + IgG anti-CD25 treatment (n=11 mice/group). C) Representative flow cytometric analyses of CD4+CD25+ cells in the circulation of mice treated with IgG or anti-CD25 during atherosclerosis regression. D) Quantification of FoxP3+CD25+ cells in peripheral blood (n=5/group), thymus (n-5/group) and spleen (n=9/group) of mice by flow cytometry. Data are mean ± SEM and are representative of 2 independent experiments. P values were determined by a Student’s t-test. E) Representative immunofluorescence staining for FoxP3 in aortic root plaques from mice at baseline and after regression + IgG or anti-CD25 treatment (n=6 mice/group). Quantification shown at right. Scale bars = 100 μM. F-G) Representative images and quantification of atherosclerotic plaque area by en face analysis of the aorta (n=7 mice/group). (F) and cross-sectional analysis of the aortic root (baseline & IgG n=7 mice; anti-CD25 n=8 mice). (G). Scale bars = 250 μM. Data are mean ±SEM. P values were determined by Student’s t-test (B) or in a one-way ANOVA (C-G) with post-hoc Sidak’s test.
Figure 3.
Figure 3.. The T cell profile of plaques is altered during atherosclerosis regression.
A-E) Quantification of CD4+ T cell subsets in aortic arch plaques by flow cytometric analysis of markers for A) Tregs (FoxP3) (n=19 baseline, 12 IgG, 12 anti-CD25), B) natural (Nrp1+) or induced (Nrp1) Tregs (n=12/group), C) Th1 (Tbet) (n=13 baseline, 11 IgG, 14 anti-CD25), D) Th2 (Gata3) (n=18 baseline, 11 IgG, 14 anti-CD25). and E) Th17 (RORγδ) (n=14 baseline, 12 IgG, 14 anti-CD25) in mice at baseline and after regression + IgG or anti-CD25 treatment Data are mean ±SEM. P values in A-E were determined by a one-way ANOVA with post-hoc Sidak’s test. F) t-SNE visualization of CD45+ cells isolated from aortic arches of mice at baseline and after regression + IgG or anti-CD25 mAb showing 17 distinct clusters based on single cell transcriptomes. G) Violin plots showing the highest expression of the Treg cell markers Helios (Izkf2) and Juno (Izumo1r) in cluster 17. H-I) Heatmaps of regulatory and metabolism genes (H) and molecular function and signaling pathways (I) differentially expressed in aortic Treg cells isolated from aortic arches of mice at baseline and after regression + IgG or anti-CD25 mAb. Scale represents z-score. Data in F-I are from n=4 mice pooled per group.
Figure 4.
Figure 4.. Tregs alter macrophage dynamics and phenotype in the regressing plaque.
A) Quantification of F4/80+ macrophages in aortic arch plaques of mice at baseline (n=6) and after regression + IgG (n=7) or anti-CD25 (n=6) treatment by flow cytometric analysis. B) Representative images and quantification of immunohistochemical staining for the macrophage marker CD68 (red) in aortic root plaques of mice at baseline (n=8) and after regression + IgG (n=7) or anti-CD25 treatment (n=8). C) Quantification of the recruitment of bead-labeled Ly6Clo monocytes and Edu-labeled Ly6Chi monocytes to aortic root plaques of mice at baseline and after regression + IgG or anti-CD25 treatment (n=6 mice/group). D-E) Quantification of the retention of Edu-labeled Ly6Chi monocyte-derived macrophages in aortic root plaques (n=6 mice/group) (D) and bead-labeled Ly6Clo monocyte-derived macrophages in aortic arch plaques 21 days after pulse-labeling (n=8 baseline, n=6 IgG, n=7 anti-CD25). F-H) Quantification and representative images of immunostaining for the cell proliferation marker Ki67 (n=5 baseline, n=6 IgG and anti-CD25)(F, G) and for cellular apoptosis by TUNEL in aortic root plaques of mice at baseline (n=6) and after regression + IgG (n=7) or anti-CD25 treatment (n=3). Scale bars = 100 μM. Data are the mean ± SEM. P values in A-H were determined by a one-way ANOVA with post-hoc Sidak’s test.
Figure 5.
Figure 5.. Tregs alter the plaque macrophage transcriptional profile during regression.
A) Violin plots showing the normalized gene expression per cell of cluster-specific markers for activated macrophages (Isg15), Trem2-hi macrophages (Trem2), inflammatory macrophages (Il1b) and monocytes (Ly6i) monocytes. B) Barplot of genes differentially expressed in monocytes and macrophages of regressing plaques in IgG (green) or anti-CD25 mAb (red) treated mice compared to baseline plaques. Data are from n=4 mice pooled per group.
Figure 6.
Figure 6.. Treg cells support M2-macrophage enrichment, efferocytosis and IL-10 production in regressing plaques.
Representative images and quantification of immunofluorescence staining in aortic root plaques from mice at baseline and during regression with IgG or anti-CD25 treatment for: A-B) the M2-like macrophage markers, MR1 (n=7/group) and Arg1 (n=7 baseline, n=5 IgG, n=6 anti-CD25)(arrows indicate positive staining), C) TUNEL and Mac2 to measure macrophage efferocytosis capacity (n=7 baseline, n=9 IgG, n=8 anti-CD25) (arrows indicate apoptotic cell efferocytosis), D) necrotic area (n=8 baseline, n=6 IgG, n=8 anti-CD25), E) smooth muscle cell α-actin (n=6 baseline, n=7 IgG, n=7 anti-CD25) (arrows indicate positive staining), and F) the anti-inflammatory cytokine IL-10 (n=5 mice/group). Scale bars = 100 μm (A, B, D-F); 25 μm (C). Data are mean ±SEM, P values in A-B, D-E were determined by a one-way ANOVA with post-hoc Sidak’s test; C, Kruskal Wallis test.
Figure 7.
Figure 7.. Treg cells enhance the pro-resolving capacity of macrophages in plaques.
A) Flow cytometric quantification of Gpr18, Fpr2 and ChemR23 expression in macrophages of digested aortic arches of mice at baseline and after regression + IgG or anti-CD25 mAb (n=6 baseline, n=7 IgG and anti-CD25). B) qPCR analysis of receptors for specialized pro-resolving mediators. Data are the mean ±SEM of six (Gpr18, Fpr2) or three (Cmklr1) independent experiments. C) Immunofluorescent staining and quantification for GPR18 (green), FPR2 (red) and CHEMR23 (green) expression in BMDMs (nuclei, blue) co-cultured with naïve T cells or Tregs. Data are the mean ±SEM of 3 (Gpr18, ChemR23) or 4 (Fpr2) independent experiments. D) LC-MS/MS analysis of the specialized pro-resolving lipid mediators 15R-LXA4, RvD1, and RvD6 in BMDMs co-cultured with naïve T cells or Tregs Data are the mean ±SEM of 3 independent experiments. E) Representative images and quantification of BMDMs (red, phalloidin stain) co-cultured with naïve T cells or Tregs and then exposed to apoptotic Jurkat cells (Green, CellTracker™) to assess efferocytosis. Data are the mean ±SEM of four independent experiments. P values were determined by a Student t-test (B, C, E) or one-way ANOVA with post-hoc Sidak’s test (A, D).

Comment in

  • Treg cells promote plaque regression.
    Fernández-Ruiz I. Fernández-Ruiz I. Nat Rev Cardiol. 2020 Jul;17(7):384. doi: 10.1038/s41569-020-0392-x. Nat Rev Cardiol. 2020. PMID: 32393855 No abstract available.

References

    1. Benjamin EJ, Virani SS, Callaway CW, Chamberlain AM, Chang AR, Cheng S, Chiuve SE, Cushman M, Delling FN, Deo R, et al. Heart disease and stroke statistics-2018 update: A report from the american heart association. Circulation. 2018;137:e67–e492 - PubMed
    1. Kwan AC, Aronis KN, Sandfort V, Blumenthal RS, Bluemke DA. Bridging the gap for lipid lowering therapy: Plaque regression, coronary computed tomographic angiography, and imaging-guided personalized medicine. Expert Rev Cardiovasc Ther. 2017;15:547–558 - PMC - PubMed
    1. Williams KJ, Feig JE, Fisher EA. Rapid regression of atherosclerosis: Insights from the clinical and experimental literature. Nat Clin Pract Cardiovasc Med. 2008;5:91–102 - PubMed
    1. Blankstein R, Libby P, Bhatt DL. Arterial inflammation: The heat before the storm. J Am Coll Cardiol. 2019;73:1383–1385 - PubMed
    1. Libby P, Everett BM. Novel antiatherosclerotic therapies. Arterioscler Thromb Vasc Biol. 2019;39:538–545 - PMC - PubMed

Publication types

MeSH terms