

Dynamics of conflict during the Ebola outbreak in the Democratic Republic of the Congo 2018-2019
- PMID: 32336281
- PMCID: PMC7184697
- DOI: 10.1186/s12916-020-01574-1
Dynamics of conflict during the Ebola outbreak in the Democratic Republic of the Congo 2018-2019
Abstract
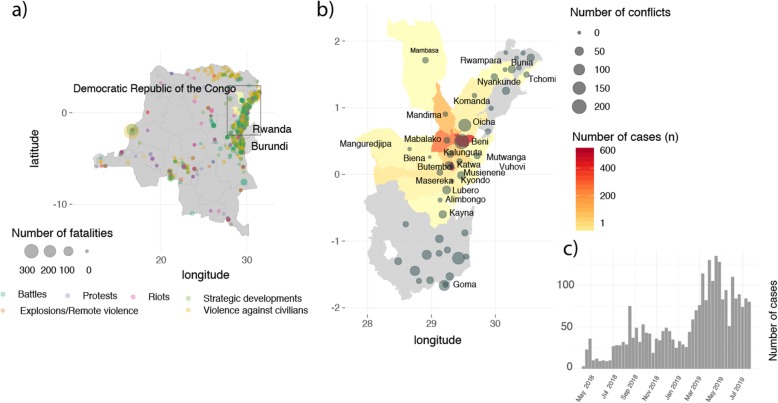
Background: The 2018-2019 Ebola virus disease (EVD) outbreak in North Kivu and Ituri provinces in the Democratic Republic of the Congo (DRC) is the largest ever recorded in the DRC. It has been declared a Public Health Emergency of International Concern. The outbreak emerged in a region of chronic conflict and insecurity, and directed attacks against health care workers may have interfered with disease response activities. Our study characterizes and quantifies the broader conflict dynamics over the course of the outbreak by pairing epidemiological and all available spatial conflict data.
Methods: We build a set of conflict variables by mapping the spatial locations of all conflict events and their associated deaths in each of the affected health zones in North Kivu and Ituri, eastern DRC, before and during the outbreak. Using these data, we compare patterns of conflict before and during the outbreak in affected health zones and those not affected. We then test whether conflict is correlated with increased EVD transmission at the health zone level.
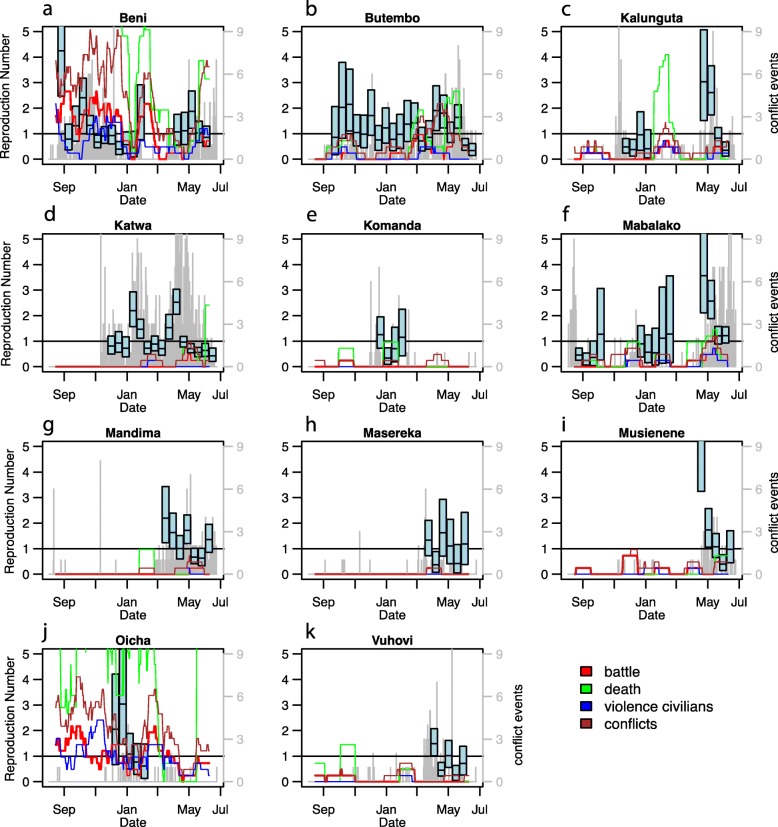
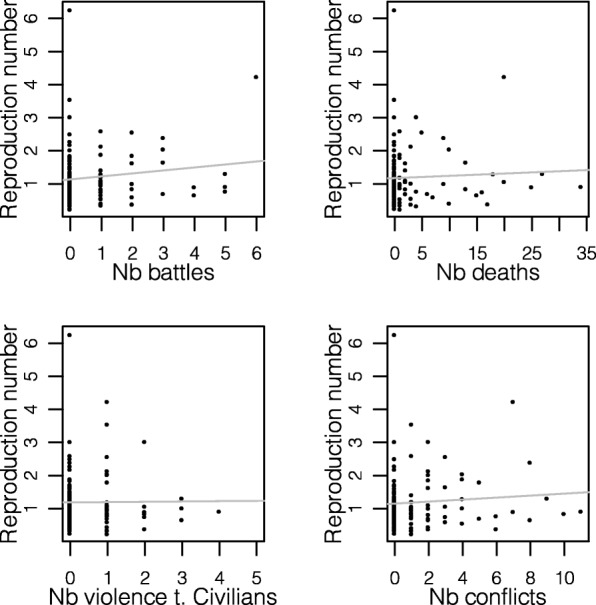
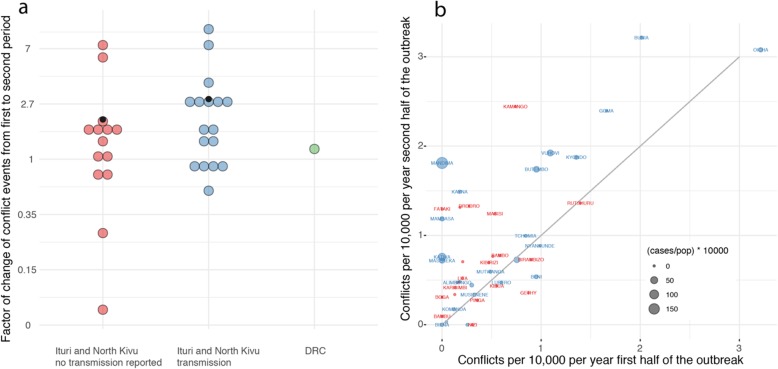
Findings: The incidence of conflict events per capita is ~ 600 times more likely in Ituri and North Kivu than for the rest of the DRC. We identified 15 time periods of substantial uninterrupted transmission across 11 health zones and a total of 120 bi-weeks. We do not find significant short-term associations between the bi-week reproduction numbers and the number of conflicts. However, we do find that the incidence of conflict per capita was correlated with the incidence of EVD per capita at the health zone level for the entire outbreak (Pearson's r = 0.33, 95% CI 0.05-0.57). In the two provinces, the monthly number of conflict events also increased by a factor of 2.7 in Ebola-affected health zones (p value < 0.05) compared to 2.0 where no transmission was reported and 1.3 in the rest of the DRC, in the period between February 2019 and July 2019.
Conclusion: We characterized the association between variables documenting broad conflict levels and EVD transmission. Such assessment is important to understand if and how such conflict variables could be used to inform the outbreak response. We found that while these variables can help characterize long-term challenges and susceptibilities of the different regions they provide little insight on the short-term dynamics of EVD transmission.
Keywords: Conflict; Democratic Republic of the Congo; Ebola; Outbreak; Violence.
Conflict of interest statement
The authors declare that they have no conflicts of interest.
Figures
Similar articles
-
Ebola Virus Disease Outbreak - Democratic Republic of the Congo, August 2018-November 2019.MMWR Morb Mortal Wkly Rep. 2019 Dec 20;68(50):1162-1165. doi: 10.15585/mmwr.mm6850a3. MMWR Morb Mortal Wkly Rep. 2019. PMID: 31856146 Free PMC article.
-
Estimating the impact of violent events on transmission in Ebola virus disease outbreak, Democratic Republic of the Congo, 2018-2019.Epidemics. 2019 Sep;28:100353. doi: 10.1016/j.epidem.2019.100353. Epub 2019 Jul 26. Epidemics. 2019. PMID: 31378584 Free PMC article.
-
Ebola virus outbreak in North Kivu and Ituri provinces, Democratic Republic of Congo, and the potential for further transmission through commercial air travel.J Travel Med. 2019 Oct 14;26(7):taz063. doi: 10.1093/jtm/taz063. J Travel Med. 2019. PMID: 31414699
-
Screening for Eye Disease in Ebola Virus Disease Survivors: Program Implementation During an Active Outbreak in the North Kivu and Ituri Provinces, Democratic Republic of the Congo.Int Ophthalmol Clin. 2024 Oct 1;64(4):55-61. doi: 10.1097/IIO.0000000000000533. Epub 2024 Oct 29. Int Ophthalmol Clin. 2024. PMID: 39480208 Review.
-
Impact of Ebola epidemics on the daily operation of existing systems in Eastern Democratic Republic of the Congo: a brief review.J Med Econ. 2024 Jan-Dec;27(1):184-192. doi: 10.1080/13696998.2024.2305009. Epub 2024 Jan 22. J Med Econ. 2024. PMID: 38240249 Review.
Cited by
-
Epidemic Response amidst Insecurity: Addressing the Ebola Virus Epidemic in the Provinces of North Kivu and Ituri.J Immunol Sci. 2023 May 12;Suppl 3:1-10. doi: 10.29245/2578-3009/2023/S3.1102. J Immunol Sci. 2023. PMID: 38333351 Free PMC article.
-
Drivers of the dynamics of the spread of cholera in the Democratic Republic of the Congo, 2000-2018: An eco-epidemiological study.PLoS Negl Trop Dis. 2023 Aug 28;17(8):e0011597. doi: 10.1371/journal.pntd.0011597. eCollection 2023 Aug. PLoS Negl Trop Dis. 2023. PMID: 37639440 Free PMC article.
-
Evaluating the risk of conflict on recent Ebola outbreaks in Guinea and the Democratic Republic of the Congo.BMC Public Health. 2024 Mar 20;24(1):860. doi: 10.1186/s12889-024-18300-8. BMC Public Health. 2024. PMID: 38509557 Free PMC article.
-
Promoting risk communication and community engagement during Mpox outbreak in fragile conflict zones of Eastern DRC.One Health. 2025 Mar 12;20:101012. doi: 10.1016/j.onehlt.2025.101012. eCollection 2025 Jun. One Health. 2025. PMID: 40160936 Free PMC article.
-
Analysis of individual-level data from 2018-2020 Ebola outbreak in Democratic Republic of the Congo.Sci Rep. 2022 Apr 1;12(1):5534. doi: 10.1038/s41598-022-09564-4. Sci Rep. 2022. PMID: 35365724 Free PMC article.
References
-
- World Health Organization (WHO) Ebola outbreak in the Democratic Republic of the Congo declared a Public Health Emergency of International Concern. 2019.
-
- Wells CR, Pandey A, Ndeffo Mbah ML, Gaüzère B-A, Malvy D, Singer BH, et al. The exacerbation of Ebola outbreaks by conflict in the Democratic Republic of the Congo. Proc Natl Acad Sci. 2019:201913980. 10.1073/pnas.1913980116. Available from: http://www.ncbi.nlm.nih.gov/pubmed/31636188. - PMC - PubMed
-
- Medecins Sans Frontieres (MSF). Crisis update - July 2019. DRC Ebola Outbreaks. 2019; Available from: https://www.msf.org/drc-ebola-outbreak-crisis-update. Accessed 10 Apr 2020.
Publication types
MeSH terms
LinkOut - more resources
Full Text Sources
Medical
