

Temporal trends in emergency department volumes and crowding metrics in a western Canadian province: a population-based, administrative data study
- PMID: 32336295
- PMCID: PMC7183635
- DOI: 10.1186/s12913-020-05196-4
Temporal trends in emergency department volumes and crowding metrics in a western Canadian province: a population-based, administrative data study
Abstract
Background: Emergency Department (ED) crowding is a pervasive problem, yet there have been few comparisons of the extent of, and contributors to, crowding among different types of EDs. The study quantifies and compares crowding metrics for 16 high volume regional, urban and academic EDs in one Canadian province.
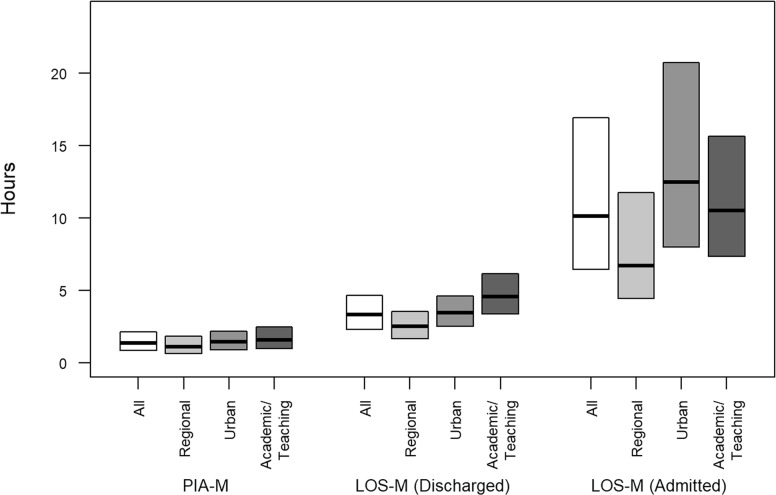
Methods: The National Ambulatory Care Reporting System (NACRS) provided ED presentations by adults to 16 high volume Alberta EDs during April 2010 to March 2015 for this retrospective cohort study. Time to physician initial assessment (PIA), length of stay (LOS) for discharges and admissions were grouped by start hour of presentation and facility. Multiple crowding metrics were created by taking the means, medians (PIA-M, LOS-M), and 90th percentiles of the hourly, ED-specific values. Similarly, proportion left against medical advice (LAMA) and proportion left without being seen (LWBS) were day and ED aggregated. Calculated based on the start of the presentation and the facility and for PIA and LOS. The mean, median, and 90th percentiles for the date and time ED-specific metrics for PIA and LOS were obtained. Summary statistics were used to describe crowding metrics.
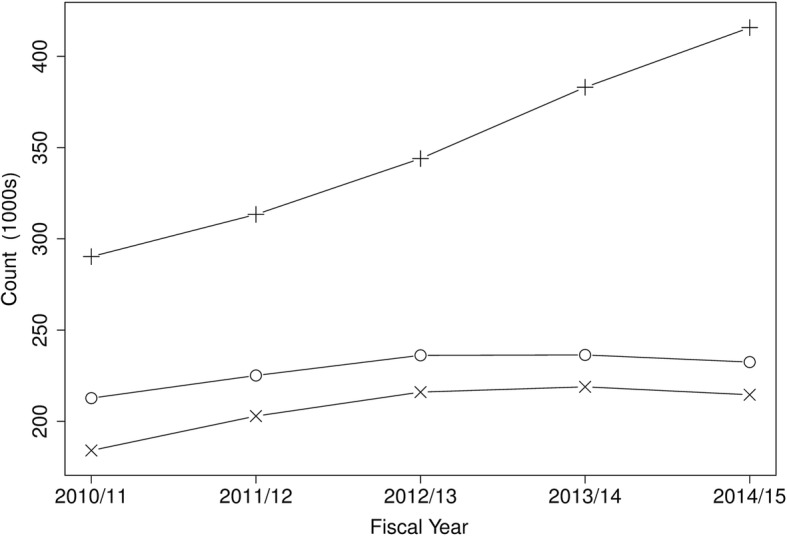
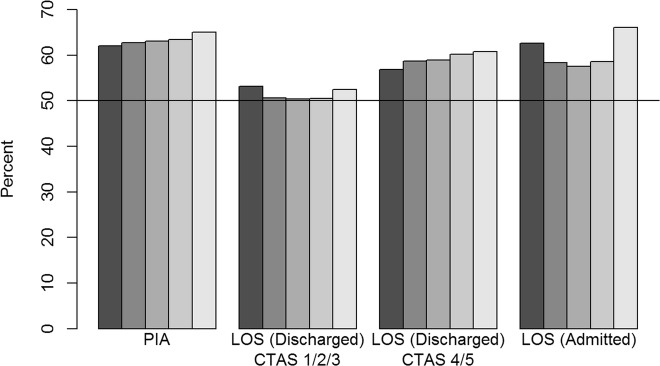
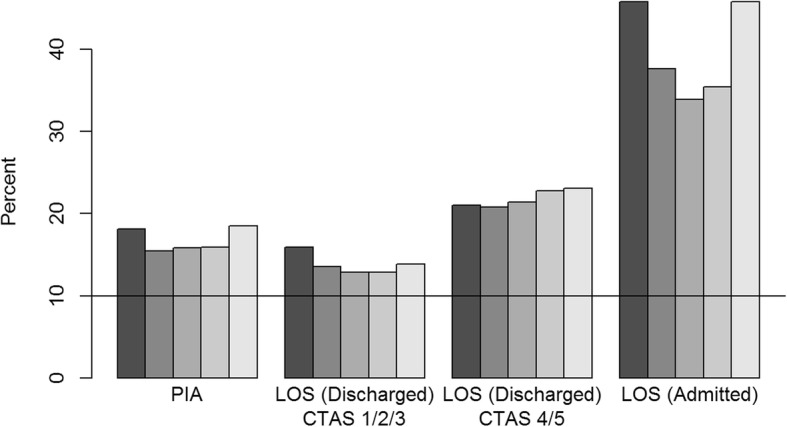
Results: There were 3,925,457 presentations by 1,420,679 adults. The number of presentations was similar for each sex and the mean age was 46 years. Generally, the three categories of EDs had similar characteristics; however, urban and academic/teaching EDs had more urgent triage scores and a higher percentage of admissions than regional EDs. The median of the PIA-M metric was 1 h23m across all EDs. For discharges, the median of the LOS-M metric was 3h21m whereas the median of the LOS-M metric for admissions was 10h08m. Generally, regional EDs had shorter times than urban and academic/teaching EDs. The median daily LWBS was 3.4% and the median daily LAMA was about 1%.
Conclusions: Emergency presentations have increased over time, and crowding metrics vary considerably among EDs and over the time of day. Academic/teaching EDs generally have higher crowding metrics than other EDs and urgent action is required to mitigate the well-known consequences of ED crowding.
Keywords: Admission; Crowding metrics; Emergency department; Patient flow.
Conflict of interest statement
The authors declare that they have no competing interest.
Figures
Similar articles
-
Type of facility influences lengths of stay of children presenting to high volume emergency departments.BMC Pediatr. 2020 Nov 2;20(1):500. doi: 10.1186/s12887-020-02400-6. BMC Pediatr. 2020. PMID: 33131492 Free PMC article.
-
Emergency department crowding negatively influences outcomes for adults presenting with asthma: a population-based retrospective cohort study.BMC Emerg Med. 2022 Dec 24;22(1):209. doi: 10.1186/s12873-022-00766-7. BMC Emerg Med. 2022. PMID: 36566194 Free PMC article.
-
Emergency department crowding negatively influences outcomes for children presenting with asthma: a population-based retrospective cohort study.Pediatr Res. 2021 Feb;89(3):679-685. doi: 10.1038/s41390-020-0918-2. Epub 2020 Apr 28. Pediatr Res. 2021. PMID: 32344424
-
Comparison of methods for measuring crowding and its effects on length of stay in the emergency department.Acad Emerg Med. 2011 Dec;18(12):1269-77. doi: 10.1111/j.1553-2712.2011.01232.x. Acad Emerg Med. 2011. PMID: 22168190 Review.
-
Impact of employing primary healthcare professionals in emergency department triage on patient flow outcomes: a systematic review and meta-analysis.BMJ Open. 2022 Apr 20;12(4):e052850. doi: 10.1136/bmjopen-2021-052850. BMJ Open. 2022. PMID: 35443941 Free PMC article.
Cited by
-
Describing resident physician productivity in a Canadian academic emergency department.CJEM. 2024 Dec;26(12):890-896. doi: 10.1007/s43678-024-00781-6. Epub 2024 Sep 27. CJEM. 2024. PMID: 39333354
-
Critical evaluation of novel health system interventions is essential.CMAJ. 2023 Nov 6;195(43):E1483-E1484. doi: 10.1503/cmaj.231496. CMAJ. 2023. PMID: 37931953 Free PMC article. No abstract available.
-
Overcrowding in emergency departments: an overview of reviews describing global solutions and their outcomes.Intern Emerg Med. 2024 Mar;19(2):483-491. doi: 10.1007/s11739-023-03477-4. Epub 2023 Dec 2. Intern Emerg Med. 2024. PMID: 38041766 Review.
-
Emergency department use by persons with MS: A population-based descriptive study with a focus on infection-related visits.Mult Scler. 2022 Oct;28(11):1825-1828. doi: 10.1177/13524585221078497. Epub 2022 Mar 1. Mult Scler. 2022. PMID: 35232298 Free PMC article.
-
Turbulence in the system: Higher rates of left-without-being-seen emergency department visits and associations with increased risks of adverse patient outcomes since 2020.J Am Coll Emerg Physicians Open. 2024 Dec 18;5(6):e13299. doi: 10.1002/emp2.13299. eCollection 2024 Dec. J Am Coll Emerg Physicians Open. 2024. PMID: 39703807 Free PMC article.
References
-
- Affleck A, Parks P, Drummond A, Rowe B, Ovens H. Emergency department overcrowding and access block. CJEM. 2013;15(6):59–37. - PubMed
MeSH terms
Grants and funding
LinkOut - more resources
Full Text Sources
Miscellaneous
