Review
. 2020 May;30(2):205-216.
doi: 10.1016/j.nic.2020.01.002. Epub 2020 Apr 9.

Magnetoencephalography for Schizophrenia

Affiliations
Review

Magnetoencephalography for Schizophrenia

J Christopher Edgar et al. Neuroimaging Clin N Am. 2020 May.

Abstract

Schizophrenia (Sz) is a chronic mental disorder characterized by disturbances in thought (such as delusions and confused thinking), perception (hearing voices), and behavior (lack of motivation). The lifetime prevalence of Sz is between 0.3% and 0.7%, with late adolescence and early adulthood, the peak period for the onset of psychotic symptoms. Causal factors in Sz include environmental and genetic factors and especially their interaction. About 50% of individuals with a diagnosis of Sz have lifelong impairment.

Keywords: Magnetoencephalography; Neuroimaging; Neuroradiologists; Schizophrenia.


Figures

Figure 1.
Figure 1.
Between-group VEctor-based Spatio-Temporal analysis using L1-minimum norm (VESTAL) analyses for theta (4 Hz to 8 Hz). Clusters in yellow/red show more right-hemisphere slow-wave activity in the schizophrenia group than in the control group (P<0.05, family-wise corrected). Adapted from YH Chen, B Stone-Howell, Edgar, J. C., et al. Frontal slow-wave activity as a predictor of negative symptoms, cognition and functional capacity in schizophrenia. Br J Psychiatry. 2016 Feb; 208(2), 160–167. doi:10.1192/bjp.bp.114.156075
Figure 2.
Figure 2.
Left (green) and right (purple) superior temporal gyrus (primary/secondary auditory cortex) evoked source waveforms to tone stimuli. Arrows show typical adult auditory evoked responses at 50 ms and 100 ms.
Figure 3.
Figure 3.
Total power (a) and inter-trial coherence (b) activity in response to pure tone stimuli. The x axis shows time and the y axis the percent change in activity from baseline. The tone is presented at 0 ms.
Figure 4.
Figure 4.
Analysis of variance (ANOVA) group differences and associated bar charts showing results of 100 ms (M100) simple-effects analyses at the 4 identified regions of interest (ROIs) (*p < .05, **p < .001). From YH Chen, B Howell, JC Edgar. Associations and Heritability of Auditory Encoding, Gray Matter, and Attention in Schizophrenia. Schizophr Bull. 2018 doi:10.1093/schbul/sby111
Figure 5.
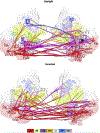
Figure 5.
Low gamma (30–40 Hz) band cortical networks stronger for controls than Sz for upright faces (top) and inverted faces (bottom). Graphs display the 200 strongest connections on a flattened, inflated cortical surface. Red = visual network (Vis); Green = sensorimotor network (SM); Purple = dorsal attention network (DAN); Yellow = ventral attention network (VAN); Blue = Frontoparietal network. AG = angular gyrus; iFS/G = inferior frontal sulcus/gyrus; MI = primary motor cortex; mOG = middle occipital gyrus, mTG = middle temporal gyrus; Fus = fusiform gyrus; POS = parieto-occipital sulcus; prCN = precuneus; SI = primary somatosensory cortex; sTG = superior temporal gyrus. From J Hirvonen, M Wibral, JM Palva. Whole-Brain Source-Reconstructed MEG-Data Reveal Reduced Long-Range Synchronization in Chronic Schizophrenia. eNeuro, 2017 4(5).
Figure 6.
Figure 6.
Functional network connectivity (FNC) for MEG, for healthy controls (left column), patients with schizophrenia (center column), and false discovery rate corrected group differences (right column). Color scale describes the p-value after FDR correction. From JM Houck, MS Cetin, AR Mayer. Magnetoencephalographic and functional MRI connectomics in schizophrenia via intra- and inter-network connectivity. Neuroimage. 2017 Jan 15;145(Pt A), 96–106. doi:10.1016/j.neuroimage.2016.10.011

Similar articles

Cited by

References

    1. Adler LE, Pachtman E, Franks RD, Pecevich M, Waldo MC, & Freedman R (1982). Neurophysiological evidence for a defect in neuronal mechanisms involved in sensory gating in schizophrenia. Biol Psychiatry, 17(6), 639–654. - PubMed
    1. Alamian G, Hincapie AS, Pascarella A, Thiery T, Combrisson E, Saive AL, … Jerbi K. (2017). Measuring alterations in oscillatory brain networks in schizophrenia with resting-state MEG: State-of-the-art and methodological challenges. Clin Neurophysiol, 128(9), 1719–1736. doi:10.1016/j.clinph.2017.06.246 - DOI - PubMed
    1. American_Psychiatric_Association. (2013). Diagnostic and statistical manual of mental disorders 5th edition. Washington, DC: American Psychiatric Association.
    1. Andreasen NC (1997). The evolving concept of schizophrenia: from Kraepelin to the present and future. Schizophr Res, 28(2–3), 105–109. - PubMed
    1. Bachmann S, Weisbrod M, Rohrig M, Schroder J, Thomas C, Scherg M, & Rupp A (2010). MEG does not reveal impaired sensory gating in first-episode schizophrenia. Schizophr Res, 121(1–3), 131–138. doi:10.1016/j.schres.2010.03.007 - DOI - PubMed