. 2020 Apr 17:6:21.
doi: 10.1038/s41420-020-0257-4. eCollection 2020.

Age related retinal Ganglion cell susceptibility in context of autophagy deficiency

Affiliations

Age related retinal Ganglion cell susceptibility in context of autophagy deficiency

Katharina Bell et al. Cell Death Discov. .

Abstract

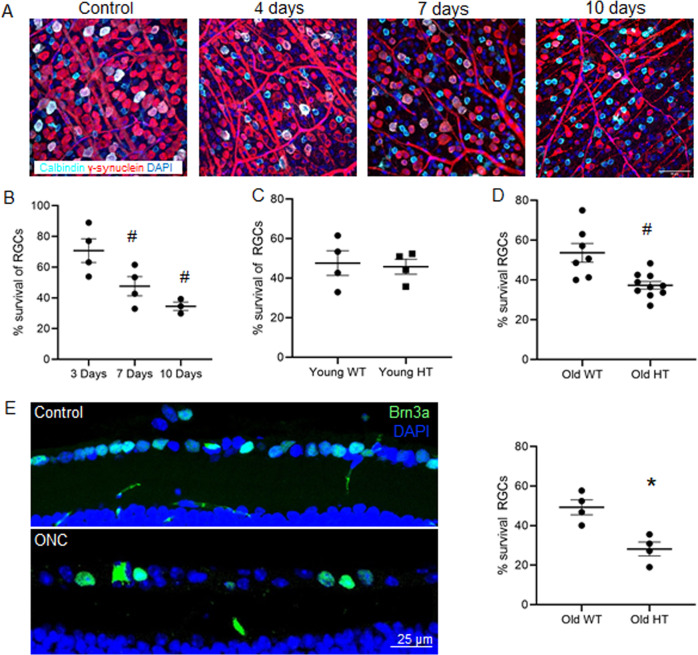
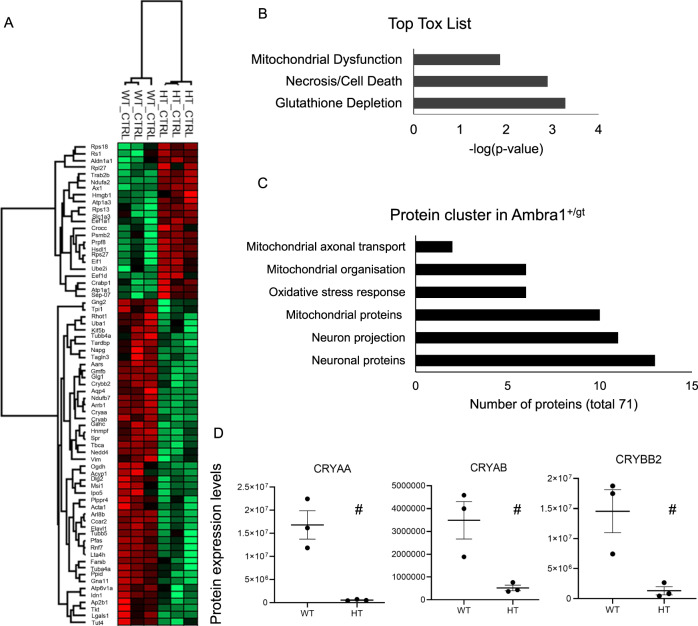
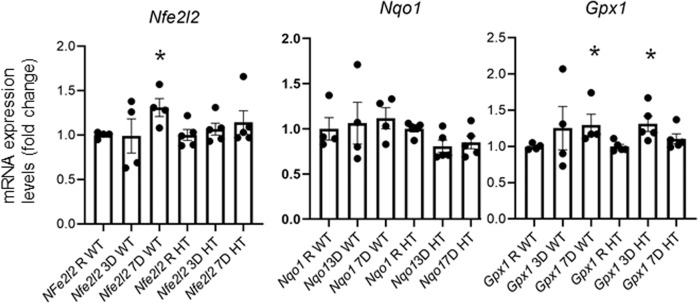
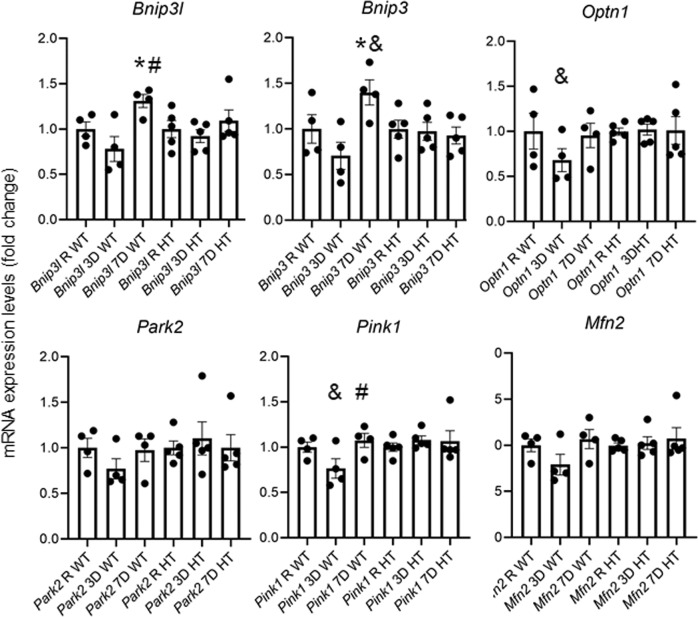
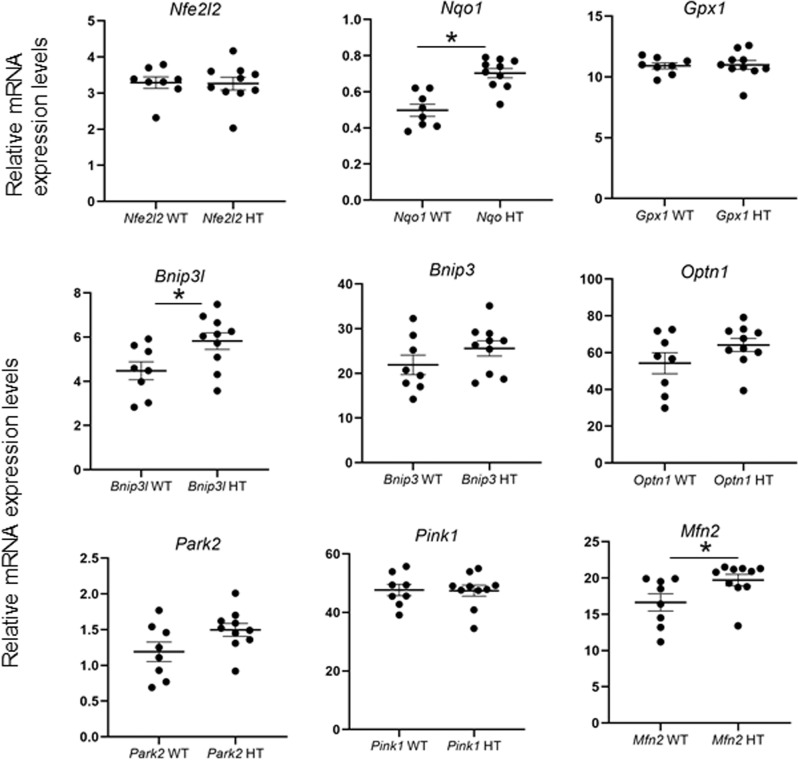
Glaucoma is a common age-related disease leading to progressive retinal ganglion cell (RGC) death, visual field defects and vision loss and is the second leading cause of blindness in the elderly worldwide. Mitochondrial dysfunction and impaired autophagy have been linked to glaucoma and induction of autophagy shows neuroprotective effects in glaucoma animal models. We have shown that autophagy decreases with aging in the retina and that autophagy can be neuroprotective for RGCs, but it is currently unknown how aging and autophagy deficiency impact RGCs susceptibility and survival. Using the optic nerve crush model in young and olWelcome@1234d Ambra1 +/gt (autophagy/beclin-1 regulator 1+/gt) mice we analysed the contribution of autophagy deficiency on retinal ganglion cell survival in an age dependent context. Interestingly, old Ambra1 +/gt mice showed decreased RGC survival after optic nerve crush in comparison to old Ambra1 +/+, an effect that was not observed in the young animals. Proteomics and mRNA expression data point towards altered oxidative stress response and mitochondrial alterations in old Ambra1 +/gt animals. This effect is intensified after RGC axonal damage, resulting in reduced oxidative stress response showing decreased levels of Nqo1, as well as failure of Nrf2 induction in the old Ambra1 +/gt. Old Ambra1 +/gt also failed to show increase in Bnip3l and Bnip3 expression after optic nerve crush, a response that is found in the Ambra1 +/+ controls. Primary RGCs derived from Ambra1 +/gt mice show decreased neurite projection and increased levels of apoptosis in comparison to Ambra1 +/+ animals. Our results lead to the conclusion that oxidative stress response pathways are altered in old Ambra1 +/gt mice leading to impaired damage responses upon additional external stress factors.

Keywords: Cell death in the nervous system; Mitophagy.


Conflict of interest statement

Conflict of interestThe authors declare that they have no conflict of interest.

Figures

Fig. 1
Fig. 1. Old Ambra1+/gt mice display reduced RGC survival after ONC.
a Immunostaining of retinal ganglion cells in flat mounts at different time points after ONC showing γ-Synuclein (red) and Calbindin (cyan) staining. b % of RGCs throughout a time course up to 10 days after ONC in young Ambra1+/+ (WT) animals. The number of RGCs was calculated by subtracting from the amount of γ-Synuclein positive cells minus the displaced amacrine double stained γ-Synuclein and Calbindin cells. The control eyes are represented as baseline value, n = 4 animals per group. #p < 0.01 in comparison to the corresponding non-injured eye. c % survival of RGCs in 3-months-old (young) Ambra1+/+ and Ambra1+/gt mice 7 days after ONC, n = 4 animals per group. d Graph showing the survival of RGCs in old (13-months-old) Ambra1+/+ and Ambra1+/gt mice 7 days after ONC, n = 8 animals per group. #p < 0.01 e % of RGCs stained with Brn3a in cryosections of old Ambra1+/+ and Ambra1+/gt mice 7 days after ONC, n = 5 animals per group. Data show mean +/− SEM, *p < 0.05.
Fig. 2
Fig. 2. Proteomics of Ambra1+/gt vs Ambra1+/+ retina.
a Heat map depicting the hierarchical clustering of the differentially expressed proteins in the old Ambra1+/+ (WT) and Ambra1+/gt (HT) animals at baseline. Gene names of the proteins are listed. Green indicated proteins significantly downregulated, red indicated proteins significantly upregulated. b Significant toxicological list derived from the IPA analysis of the old Ambra1+/gt (HT) vs. Ambra1+/+ (WT) animals at baseline, after performing Benjamini-Hochberg correction. c Relevant protein clusters statistically significantly differently regulated between Ambra1+/+ (WT) and Ambra1+/gt (HT) animals derived from the String analysis (p < 0.05). The number of proteins belonging to the clusters is displayed. d Alpha-crystallin A-Chain (CRYAA), Alpha-crystallin B-chain (CRYBA) and Beta-crystallin B2 (CRYBB2) protein expressions in Ambra1+/+ and Ambra1+/gt, #p < 0.01.
Fig. 3
Fig. 3. Impaired oxidative stress response in old Ambra1+/gt after ONC.
mRNA expression levels determined by qPCR of Nfe2l2, Gpx1 and Nqo1 were measured in old Ambra1+/+ and Ambra1+/gt mice retinas 3 and 7 days after ONC. Data represent mean +/− SEM, *p < 0.05 in comparison to the corresponding control eye, n = 4–5 per group.
Fig. 4
Fig. 4. Mitophagy regulator mRNA expression altered after ONC.
mRNA expression levels determined by qPCR analysis of mitophagy regulators and receptors Pink1, Parkin, Bnip3l, Bnip3, Optn, and Mfn2 were performed in old Ambra1+/+ and Ambra1+/gt mice of the retinas 3 and 7 days after ONC. Data represent mean +/− SEM, *p < 0.05), n = 4–5 animals per group. *p < 0.05 represents the significance against the corresponding control eye, #p < 0.05 vs. 3D value of the same genotype, and &p < 0.05 vs. same time point in the Ambra1+/gt mice.
Fig. 5
Fig. 5. Altered mitochondrial and oxidative stress gene levels in control Ambra1+/gt retina.
mRNA levels of oxidative stress response genes Nfe2l2, Gpx1, Nqo1, and mitophagy receptors and adaptors Pink1, Parkin, Bnip3l, Bnip3, Optn, and Mfn2 were measured in old Ambra1+/+ and Ambra1+/gt mice retinas. The graphs represent the relative mRNA expression levels. Data represent mean +/− SEM, *p < 0.05, n = 4–5 animals per group.
Fig. 6
Fig. 6. Increased RGC apoptosis and decreased neuronal growth in Ambra1+/gt derived RGCs.
a % of apoptotic cells determined by counting condensed nuclei in Ambra1+/+ and Ambra1+/gt retinal cell cultures (n = 4 for WT, n = 5 for HT), #p < 0.01, referring to comparison with WT, Data represent mean +/− SEM. b RGC numbers in culture were determined 1 and 3 DIV using DIC pictures. The graph shows the number of RGCs, n = 15. #p < 0.01, *p < 0.05. Data represent mean +/− SEM. c Representative DIC pictures of the RGCs cultures after 3DIV. The scale bar 25 µm. d % of apoptotic RGCs in culture in Ambra1+/+ and Ambra1+/gt Apoptotic RGCs were counted using DAPI and TUJ1 staining (n = 4 for WT, n = 5 for HT), *p < 0.05, in comparison to the corresponding WT value. e The length of RGC neurites was measured manually in DIC pictures in Ambra1+/+ and Ambra1+/gt. The graph represents the length of neuronal projection that each RGC grows at 1 DIV and 3 DIV, n = 15, *p < 0.05, referring to comparison with corresponding WT value, data represent mean +/− SEM.

References

    1. Tham YC, et al. Global prevalence of glaucoma and projections of glaucoma burden through 2040: a systematic review and meta-analysis. Ophthalmology. 2014;121:2081–2090. - PubMed
    1. Mirzaei M, et al. Age-related neurodegenerative disease associated pathways identified in retinal and vitreous proteome from human glaucoma eyes. Sci. Rep. 2017;7:12685. - PMC - PubMed
    1. Van Bergen NJ, et al. Measurement of systemic mitochondrial function in advanced primary open-angle glaucoma and leber hereditary optic neuropathy. PLoS ONE. 2015;10:e0140919. - PMC - PubMed
    1. Funke S, et al. Glaucoma related proteomic alterations in human retina samples. Sci. Rep. 2016;6:29759. - PMC - PubMed
    1. Boya P, Reggiori F, Codogno P. Emerging regulation and functions of autophagy. Nat. Cell Biol. 2013;15:713–720. - PMC - PubMed